


In the cheese industry, one important indicator of milk quality is its coagulation properties, which affects both the yield and the quality of the cheese (Skeie, Reference Skeie2007; De Marchi et al., Reference De Marchi, Bittante, Dal Zotto, Dalvit and Cassandro2008; Olsen et al., Reference Olsen, Ferneborg, Vhile, Kidane and Skeie2023) and hence production profitability. Milk suitability for cheese-making is of particular importance in the production of protected denomination of origin cheeses and for increasing the economic sustainability of farming endangered native breeds, through processing milk into high-quality branded cheeses (Inglingstad et al., Reference Inglingstad, Devold, Damiano, Holene, Svartedal, Comi, Eliassen, Asledottir, Ulleberg and Vegarud2024).
It is generally recognized that milk suitability for cheese-making, including milk coagulation properties (MCP), is affected by various cow-related and on-farm factors (Priyashantha and Lundh, Reference Priyashantha and Lundh2021). Among extensively studied cow-related factors are breed (De Marchi et al., Reference De Marchi, Dal Zotto, Cassandro and Bittante2007; Bittante et al., Reference Bittante, Penasa and Cecchinato2012), milk chemical composition (Jõudu et al., Reference Jõudu, Henno, Kaart, Püssa and Kärt2008; Bland et al., Reference Bland, Grandison and Fagan2015), milk protein profile and polymorphism (Bittante et al., Reference Bittante, Penasa and Cecchinato2012; Nadugala et al., Reference Nadugala, Pagel, Raynes, Ranadheera and Logan2022), the size of casein micelles and fat globules (Logan et al., Reference Logan, Day, Pin, Auldist, Leis, Puvanenthiran and Augustin2014), parity and stage of lactation (Tyrisevä et al., Reference Tyrisevä, Vahlsten, Ruottinen and Ojala2004; Jõudu et al., Reference Jõudu, Henno, Värv, Kaart, Kärt and Kalamees2007; Bittante et al., Reference Bittante, Cipolat-Gotet, Malchiodi, Sturaro, Tagliapietra, Schiavon and Cecchinato2015). Among on-farm factors, the impact of various feeding systems has been studied most extensively: different combinations of grazing and indoor feeding (Auldist et al., Reference Auldist, Greenwood, Wright, Hannah, Williams, Moate and Wales2016; Akert et al., Reference Akert, Kreuzer, Kunz, Reidy and Berard2021), hay vs. silage (Manzocchi et al., Reference Manzocchi, Hengartner, Kreuzer and Giller2020). In addition to feeding system, MCPs are also affected by the type and quality of feed, and although the impact of these factors on milk composition is well established (Walker et al., Reference Walker, Dunshea and Doyle2004; Brun-Lafleur et al., Reference Brun-Lafleur, Delaby, Husson and Faverdin2010; Coppa et al., Reference Coppa, Pomiès, Martin, Bouchon, Renaud, Aoun, Deroche and Baumont2025), only a few studies directly address MCP. Olsen et al. (Reference Olsen, Ferneborg, Vhile, Kidane and Skeie2023) reported the protein source of the concentrate feed, and Piccioli-Cappelli et al. (Reference Piccioli-Cappelli, Seal, Parker, Loor, Minuti, Lopreiato and Trevisi2022) reported the starch content of the feed to be associated with alterations in MCP. In addition, De Marchi et al. (Reference De Marchi, Penasa and Cassandro2017) observed a negative impact of automatic milking systems on MCP, compared to milking parlours, and Summer et al. (Reference Summer, Franceschi, Formaggioni and Malacarne2014) reported a favourable effect of free-stall housing compared to tie-stall housing. In contrast to cow-related factors, farm-level influences on MCP have been studied to a lesser extent, and the results are contradictory. Several authors (Vallas et al., Reference Vallas, Bovenhuis, Kaart, Pärna, Kiiman and Pärna2010; Bittante et al., Reference Bittante, Penasa and Cecchinato2012; Stocco et al., Reference Stocco, Cipolat-Gotet, Bobbo, Cecchinato and Bittante2017) claim that the farm has modest to no impact on the coagulation properties of milk.
No studies have jointly assessed cow-related and farm effects on MCP while comparing a commercial breed with an endangered breed often managed under more variable conditions. Our objective was to evaluate the relative importance of farm- and cow-related factors on MCP in commercial and native breeds, exposed to different housing and management systems.
Materials and methods
Experimental design and milk sampling
The study was carried out on 86 Estonian Red (ER) and 132 Estonian Native (EN) dairy cows from 12 single-breed (ER: n = 6, EN: n = 6) and 3 dual-breed dairy farms. All herds were recommended for inclusion based on their involvement in milk recording and willingness to participate in the study by the Animal Breeders’ Association of Estonia and the Estonian Native Cattle Breed Society. The average number of cows studied per farm was 14 (minimum 5 and maximum 42). Before the start of the experiment, all farms were visited, and an interview was conducted with the farm manager to characterize the farm and its management practices. The descriptions of farms based on the number of cows in milk, breed, housing system, milking system and feeding arrangement are presented in Fig. 1. Individual animal data (breed, sire, parity, stage of lactation) were obtained from Estonian Livestock Performance Recording Ltd. databases.
Farm characteristics and management practices (farms are ordered according to the breed and size, and the cells are coloured according to the values); breed: ER – Estonian Red, EN – Estonian Native; housing: free stall vs. tie stall, milking system: parlour vs. pipeline; feeding: TMR (total mixed ration) vs. component feeding.

Figure 1 Long description
The table has eight columns: Farm, Breed, Number of cows in milk, Freestall housing, Parlour milking, TMR, Concentrates in dry matter percent, Grazing in summer. Row 1: Farm 1, ER, 1096, Yes, Yes, Yes, greater than or equal to 40, No. Row 2: Farm 2, ER, 1035, Yes, Yes, Yes, greater than or equal to 40, No. Row 3: Farm 3, ER, 719, Yes, Yes, Yes, greater than or equal to 40, No. Row 4: Farm 4, ER, 630, Yes, Yes, Yes, greater than or equal to 40, No. Row 5: Farm 5, ER, 591, Yes, Yes, Yes, greater than or equal to 40, No. Row 6: Farm 6, ER, 294, Yes, Yes, Yes, greater than or equal to 40, No. Row 7: Farm 7, ER/EN, 864, No, Yes, Yes, less than or equal to 10, No. Row 8: Farm 8, ER/EN, 151, No, No, No, less than or equal to 10, No. Row 9: Farm 9, ER/EN, 151, No, No, No, less than or equal to 10, No. Row 10: Farm 10, EN, 189, Yes, Yes, Yes, greater than 10 and less than 40, Yes. Row 11: Farm 11, EN, 88, Yes, Yes, Yes, greater than 10 and less than 40, Yes. Row 12: Farm 12, EN, 46, Yes, Yes, Yes, greater than 10 and less than 40, Yes. Row 13: Farm 13, EN, 26, Yes, Yes, Yes, greater than 10 and less than 40, Yes. Row 14: Farm 14, EN, 19, No, Yes, Yes, less than or equal to 10, Yes. Row 15: Farm 15, EN, 18, No, No, No, less than or equal to 10, Yes.
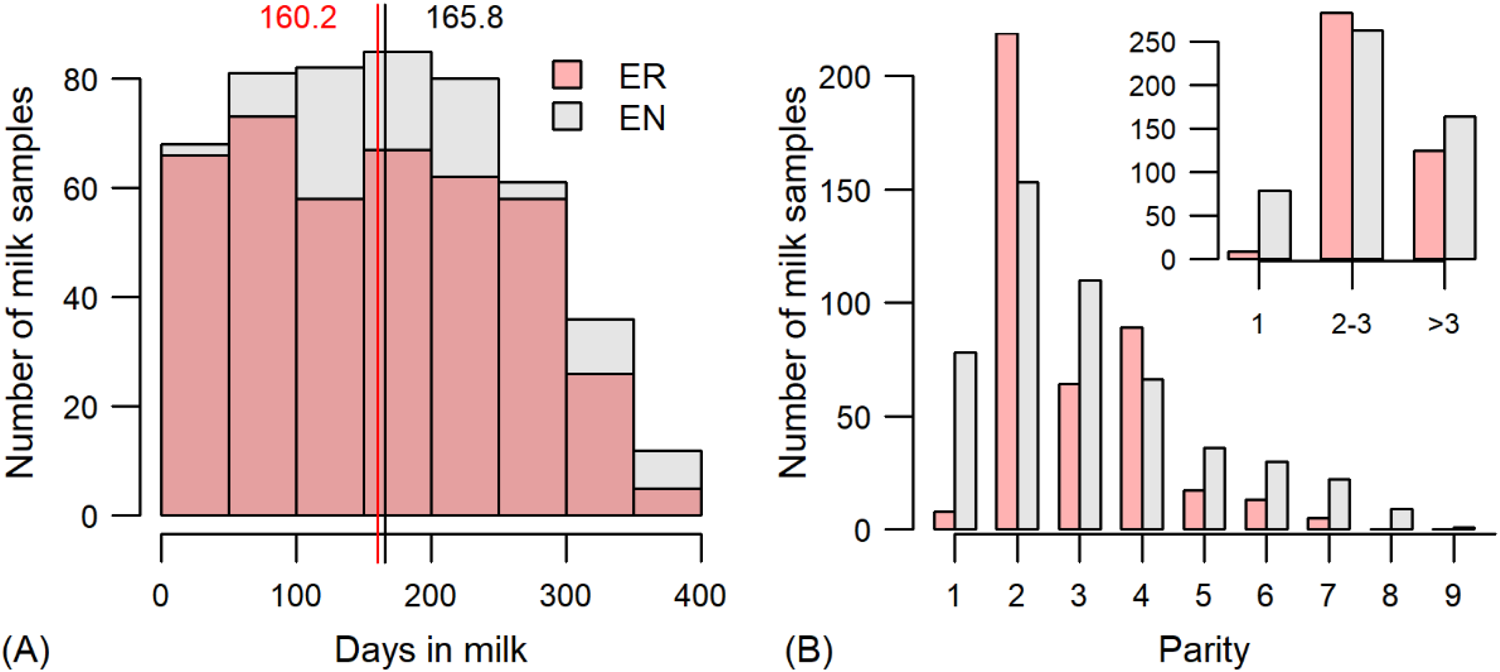
Individual milk samples were collected every second month during the morning milking on test days from November 2020 to January 2022. The total number of milk samples was 920 (ER: n = 415, EN: n = 505), with an average of 4.2 samples per cow (minimum 1, maximum 8). The distribution of milk samples by days in milk (DIM) and parities is presented in Fig. 2.
Distribution of milk samples from Estonian Red (ER) and Estonian Native (EN) cows (A) across lactations (vertical lines and numbers indicate the average days in milk), and (B) across parities (the smaller upper figure shows the distribution of samples by parity groups used in subsequent analyses).

Figure 2 Long description
The image A showing a bar graph comparing ER and EN. The vertical axis label is “Number of milk samples” with tick marks at 0, 20, 40, 60 and 80. The horizontal axis label is “Days in milk” with tick marks at 0, 100, 200, 300 and 400. A legend lists “ER” and “EN”, shown as two overlapping bar series distinguished by different fill shading. Two vertical reference lines are drawn with the numbers “160.2” and “165.8” above them. The tallest bars occur in the mid-range of days in milk, around the 100 to 250 region, reaching close to the 80 tick mark. Bars are smaller near the lowest days in milk and near the highest days in milk, with the smallest bars near the 400 end of the axis. The image B showing a bar graph comparing ER and EN by parity. The vertical axis label is “Number of milk samples” with tick marks at 0, 50, 100, 150 and 200. The horizontal axis label is “Parity” with tick marks at 1, 2, 3, 4, 5, 6, 7, 8 and 9. A legend lists “ER” and “EN”, shown as two bar series distinguished by different fill shading. The highest counts are at parity 2, with bars reaching around the 200 tick mark. Parity 1 and parity 3 also show high counts, with bars above the 100 tick mark. Counts decrease from parity 4 onward, with smaller bars at parities 6 through 9. An inset bar graph summarizes parity grouped into “1”, “2-3” and “>3”. The inset vertical axis shows tick marks at 0, 100, 200 and 250. The grouped category “2-3” has the tallest bars, near the 250 tick mark. The grouped category “1” is lower than “2-3” and above the 200 tick mark. The grouped category “>3” is lower than both “1” and “2-3”, between the 100 and 200 tick marks. Both graphs compare ER and EN sample counts, with image A organized by days in milk and image B organized by parity and the inset providing a grouped parity summary.
Milk samples (two subsamples per cow) were taken with milk meters, stabilized with bronopol (Broad Spectrum Microtabs, Advanced Instruments, Norwood, MA, USA). The first subsample (40 ml) was transported to the Milk Analysis Laboratory of Estonian Livestock Performance Recording Ltd. (Tartu, Estonia) and was analysed as a regular milk-recording sample with an automatic infrared milk analyser (System FT+, Foss, Hilleroed, Denmark). The results for fat, protein and lactose contents and somatic cell counts were used in the analysis. The second subsample (40 ml) was taken to the Milk Quality Research Laboratory at the Chair of Animal Nutrition, Estonian University of Life Sciences (Tartu, Estonia). It was then divided into three aliquots for the analysis of additional traits.
Milk sample analyses
Milk coagulation properties
The analysis of MCP was performed using a lactodinamograph (Formagraph, Foss Italia, Padua, Italy), and pH was measured using an MP 220 (Mettler Toledo, Greifensee, Switzerland). The milk-clotting enzyme Milase MRS 750 IMCU/ml (CSK Food Enrichment, Leeuwarden, Netherlands) was diluted with distilled water (1:100, v/v), and 200 μl of the coagulant solution was added to 10 ml of milk. Two MCP traits were recorded: (1) the time from coagulant addition to the start of coagulation, referred to as rennet coagulation time (RCT, min); and (2) curd firmness 30 min after the addition of the coagulant (a30, mm).
Casein content
Casein content was analysed using the Kjeldahl method. Precipitation of casein was performed by adding combined solution, at pH 4.6, of acetic acid and sodium acetate in a Kjeldahl tube, followed by filtration in accordance with the ISO/DIS 17997–2|IDF 29–2 standard (ISO/IDF, 2004). The nitrogen content of the precipitate was then determined following the ISO 8968|IDF 20 standard (ISO/IDF, 2014).
Size distribution of casein micelles
Milk samples were diluted 100 times in RPMI 1640 medium (Mediatech Inc., Manassas, USA). The diluted samples were then filtered through a 0.45-μm pore diameter syringe filter (Whatman UNIFLO 25/0.45 RC, Maidstone, UK) into disposable sizing cuvettes (Sarstedt 10 × 10 × 45 mm; Sarstedt AG&Co, Nümbrecht, Germany). The size distribution of casein micelles was analysed at 20°C using a Zetasizer Nano ZS analyser with a 633 nm He–Ne laser and software version 7.13 (Malvern Instruments Ltd., Worcestershire, UK). The size distribution was determined at a fixed 173° backscattered angle using the default ‘protein analysis mode’ with automatic duration and attenuation selection, following the procedure described by Sats et al. (Reference Sats, Kaart and Jõudu2024).
Size distribution of fat globules
The size distribution of milk fat globules was determined using a laser diffraction analyser (Malvern Mastersizer 3000, Malvern Instruments Ltd., Worcestershire, UK). Milk samples were transferred into the analyser's dispersion tank containing reverse osmosis water (grade 2, conductivity 0.055 µS/cm). The material (lipid, refractive index 1.6) and dispersant (water, refractive index 1.33) were selected according to the recommendations of the Mastersizer software, with the stirrer set to 2,000 rpm. The size distribution of the fat globules was measured after adding a sufficient amount of sample to achieve an obscuration of 5–8%, as previously described by Sats et al. (Reference Sats, Yurchenko, Kaart, Tatar, Lutter and Jõudu2022). The size of the fat globules was expressed as the median (Dv50) of the size distribution.
κ-CN genetic variants
DNA was extracted from hair samples by using a commercial Puregene DNA Tissue Kit (Qiagen, Germany). The κ-CN gene polymorphisms were analysed according to the method described by Velmala et al. (Reference Velmala, Mäntysaari and Mäki-Tanila1993). The amplified PCR products were digested with HinfI and HaeIII restriction enzymes and 10× reaction buffer (Fermentas, Lithuania) at 37°C for 4 h. The PCR-RFLP products were visualized by electrophoresis on 3% agarose gel and documented using Bio-Capt v. 12.5 software (Vilbert Lourmant, France).
Statistical analysis
For the first robust overview, the descriptive statistics of the studied production variables by breeds were calculated, and the between-breed differences were tested with a t-test followed by a Bonferroni correction for multiple testing. As there were only three dual-breed farms (where both breeds were housed together) and farms’ characteristics and management practices and their variability were different for the two breeds (Fig. 1), there was almost no opportunity to correct for the confounding of breed and farm-related effects. Therefore, most of the following analyses were performed by (within) breed, and differences in results were interpreted as differences in sources of MCP variation in genetically distinct breeds managed under distinct conditions. The pairwise relationships between MCP and other milk production, quality and technological indicators were analysed with Pearson correlation analysis. The overall prediction ability of the set of production variables on MCP and the relative importance of variables were analysed with a random forest algorithm. This algorithm also naturally considers potential nonlinear relationships and interactions and therefore offers potentially higher prediction accuracy. The κ-casein genotype distribution between breeds was compared with Pearson’s chi-squared test with simulated P-value (based on 10,000 replicates). The same test was used to compare the genotype distribution of both breeds with the Hardy–Weinberg equilibrium. To study the effect of κ-casein genotype and lactation stage, as well as farm and sire, on MCP, mixed linear models were fitted. The models considered fixed effects of breed, κ-casein genotype, calendar month, parity group (three levels: 1, 2–3, >3), third-order polynomial of DIM and breed interactions with κ-casein genotype, parity group and DIM and random effects of farm and sire. Additionally, separate models (without breed effect) were fitted for both breeds. The effects of κ-casein genotype and DIM were estimated in the form of expected marginal means, and the magnitude of sire and farm effects was estimated in the form of intraclass correlation coefficients. The repeated measures of the same cows were not considered because the corresponding models did not converge (the random cow effect was zero). To estimate the potential effect of summer grazing, the models with calendar month replaced with season (October–March vs. April–September) effect were fitted. As the seasonal effects for both breeds were close to zero and statistically not significant (P-values ranged from 0.22 to 0.85), and the effects of other factors almost did not change, these results are not presented. Due to the relatively small number of animals and observations, the complex models did not converge, and the results of simplified models did not differ remarkably from initial models fitted to the entire dataset; therefore, no results of separate models fitted by seasons are presented either. Results of statistical analyses were considered to be significant at P ≤ 0.05, and all analyses were performed, and figures were constructed using R 4.4.1 (R Core Team, 2024). For the random forest algorithm, the package ‘randomForest’, for the Hardy–Weinberg equilibrium testing package ‘genetics’ and for modelling, the packages ‘car’, ‘lme4’, ‘emmeans’, ‘multcompView’ and ‘performance’ were used.
Results
Descriptive statistics
The descriptive statistics of milk yield, composition and coagulation traits, along with robust between-breed comparison results based on t-tests, are summarized in Table 1. EN cows had a lower daily milk yield (16.75 vs. 33.52 kg) and lower milk urea content (214.4 vs. 232.6 mg/L) compared to ER cows. The milk fat content and fat globule size were higher in EN cows than in ER cows, at 4.82% vs. 4.21% and 4.07 µm vs. 3.85 µm, respectively. No significant differences were observed between the breeds in terms of milk protein content, casein-to-protein ratio, casein micelle size, or MCP (RCT, a30). However, EN cows had a higher casein content (2.74% vs. 2.65%) and somatic cell score (3.36 vs. 2.81) than ER cows.
Means (standard deviation) of test-day milk yield, composition and coagulation traits by breeds

Table 1 Long description
The table reports average test-day milk yield, milk composition, and coagulation-related traits for Estonian Native and Estonian Red cows, with standard deviations and p-values for breed differences. Estonian Red has much higher milk yield (33.40 kg/day) than Estonian Native (16.75 kg/day), with a very small p-value. Estonian Native shows higher fat (4.82% vs 4.21%) and higher casein (2.74% vs 2.65%), and also a higher somatic cell score (3.36 vs 2.81); these differences are statistically significant. Urea is higher in Estonian Red (232.6 mg/l) than Estonian Native (214.4 mg/l), also significant. Protein percentage (3.59% vs 3.52) and the casein-to-protein ratio (0.761 vs 0.754) do not show clear breed differences based on their p-values. Casein micelle size is essentially the same between breeds (about 211 to 212 nm) with no evidence of a difference. Fat globule median size is larger in Estonian Native (4.07 micrometers) than Estonian Red (3.85 micrometers), with a very small p-value. Coagulation traits show no clear breed differences: rennet coagulation time is 11.95 vs 13.13 minutes and curd firmness at 30 minutes is 34.84 vs 32.82 mm, both with non-significant p-values. Results are descriptive by breed and should be interpreted with the reported variability and without assuming causation.
SCS, somatic cell score = log2(SCC/100,000) + 3; SCC, somatic cell count; Dv 50, milk fat globule size distribution median; RCT, rennet coagulation time; a30, curd firmness 30 min after rennet addition.
MCP relationships with milk production and quality traits
There was a strong and expected negative correlation between milk coagulation time and curd firmness in both breeds (r = −0.93 and r = −0.92 in case of ER and EN, respectively). However, all other relationships with MCP were weak. The correlation coefficient values rarely exceed 0.3 level (Table 2), even with casein percentage and casein-to-protein ratio. Curd firmness was more strongly associated with fat, protein and casein percentages than with milk coagulation time. In EN cows, both coagulation properties showed a stronger association with SCS and urea content, whereas in ER cows, these relationships were negligible.
Correlations of milk coagulation properties (RCT – milk coagulation time; a30 – curd firmness 30 minutes after the addition of the coagulant) with other studied milk variables, and quality by breeds (ER, Estonian Red; EN, Estonian Native)

Table 2 Long description
The table reports correlation coefficients between two milk coagulation traits, coagulation time and curd firmness at 30 minutes, and multiple milk variables for two breeds (ER and EN). In both breeds, coagulation time is very strongly and negatively related to curd firmness, indicating that longer coagulation time goes with much lower firmness. Curd firmness shows consistent positive correlations with protein and casein: in ER, protein about 0.23 and casein about 0.30; in EN, protein about 0.19 and casein about 0.27, with several of these marked as highly significant. The casein to protein ratio is also positively related to firmness in both breeds, stronger in EN (about 0.28) than ER (about 0.17), and it is negatively related to coagulation time, especially in EN (about minus 0.16). For EN, higher somatic cell score and higher urea are moderately associated with longer coagulation time (about 0.26 and 0.31) and with lower firmness (about minus 0.22 and minus 0.29), while these relationships are weak or near zero in ER. Milk yield has a small negative correlation with coagulation time in ER and a small positive correlation with firmness in ER, but little association in EN. Fat percentage has small negative correlations with coagulation time and small positive correlations with firmness in both breeds, whereas micelle size and fat globule size show weak or inconsistent relationships overall. Correlations indicate association only and do not establish cause, and the significance markers show which relationships are unlikely to be due to chance.
SCS, somatic cell score = log2(SCC/100,000) + 3; SCC, somatic cell count; Dv 50, milk fat globule size distribution median.
* P ≤ 0.05.
** P ≤ 0.01.
*** P ≤ 0.001.
The random forest analysis predicting the coagulation properties based on the other milk production and quality indicators by breeds revealed that, overall, the prediction accuracy was higher for curd firmness and for EN cows. The latter was mainly caused by higher predictive power of urea on EN cows compared to ER cows (Fig. 3).
Relative importance of the studied milk production, quality and technological indicators of Estonian Red (ER) and Estonian Native (EN) cows in predicting the coagulation time RCT and curd firmness a30 with random forest algorithm: the height of the bars indicates how much the prediction error increases on average when the corresponding variable was excluded from the prediction algorithm, compared to cases where it was included (SCS = log2(SCC/100,000) + 3 is the somatic cell count score, SCC – somatic cell count; Dv 50 – milk fat globule size distribution median); numerically are presented proportions of variance of studied coagulation properties explained by predictor variables.

Figure 3 Long description
Two horizontal bar graphs. Left graph title: RCT. X axis label: Increase in mean squared error omitting the variable, percent. X axis range: 0 percent to 70 percent. Y axis categories, top to bottom: Milk, kg; SCS; Urea, mg l; Fat, percent; Protein, percent; Casein, percent; Casein over Protein; Casein micelle size, nm; Fat globule Dv 50, micrometer. Legend: ER and EN. Visible text annotation: 9.0 percent slash 19.5 percent. Right graph title: a0. X axis label: Increase in mean squared error omitting the variable, percent. X axis range: 0 percent to 70 percent. Y axis categories, top to bottom: Milk, kg; SCS; Urea, mg l; Fat, percent; Protein, percent; Casein, percent; Casein over Protein; Casein micelle size, nm; Fat globule Dv 50, micrometer. Legend: ER and EN. Visible text annotation: 16.7 percent slash 26.0 percent.
Modelling results: breed, lactation stage, κ-casein genotype, farm and sire effects
There were no clearly directional and statistically significant effects of calendar month, parity, or their interactions with breed and DIM on MCP (all P > 0.2). The coagulation time of EN cows’ milk was slightly, but statistically not significantly shorter, and the curd was firmer compared to ER cows’ milk (P = 0.245 and P = 0.022, respectively). MCP changed significantly during lactation (P < 0.001), with the best values (shorter coagulation time and firmer curd) observed at the beginning of lactation and the worst in the fourth to fifth month. The changes in coagulation properties were more pronounced in ER cows compared to EN cows (Fig. 4).
Dynamics of coagulation time RCT (A) and curd firmness a30 (B) in 1–365 days in milk (DIM) depending on breed (ER, Estonian Red; EN, Estonian Native). The DIM-effect was estimated in the form of third-order polynomial with linear mixed model considering also fixed effects of breed, breed by DIM interaction, calendar month, parity group, κ-casein genotype and their interactions with breed, and random effects of farm and sire; presented p-values indicate statistical significance of breed (pB), DIM (pDIM) and breed by DIM interaction effects (pB×DIM); the polygons around estimated trajectories mark 95% confidence intervals.

Figure 4 Long description
Two sub-images labeled A and B. The image A showing a line graph with two series and shaded bands. Text at top left reads: P b equals 0.245, P d equals 0.001, P b times d equals 0.127. The x-axis label is DIM, with tick labels 50, 100, 150, 200, 250, 300, 350. The y-axis label is RCT, min, with tick labels 5, 10, 15, 20. A legend inside the plot shows ER as a solid line with square markers and EN as a dashed line with square markers. The ER line starts near 5 at DIM 0, rises to about 12 by DIM 50, stays around 12 to 13 through about DIM 200, then rises to about 15 by DIM 350. The EN line starts near 5 at DIM 0, rises to about 10 by DIM 50, stays around 10 to 11 through about DIM 250, then rises to about 12 by DIM 350. Each line has a surrounding shaded band that widens toward higher DIM. The image B showing a line graph with two series and shaded bands. Text at top left reads: P b equals 0.022, P d less than 0.001, P b times d equals 0.003. The x-axis label is DIM, with tick labels 0, 50, 100, 150, 200, 250, 300, 350. The y-axis label is a30, mm, with tick labels 20, 30, 40, 50. A legend inside the plot shows ER as a solid line with square markers and EN as a dashed line with square markers. The ER line starts near 40 at DIM 0, decreases to about 25 by around DIM 150, then increases to about 35 by DIM 350. The EN line starts near 40 at DIM 0, decreases to about 33 by around DIM 100, then stays around 33 to 36 through about DIM 350. Each line has a surrounding shaded band that widens toward higher DIM.
Both milk coagulation characteristics, coagulation time and curd firmness, depended significantly on cows’ κ-casein genotype (both P < 0.001), where the B-allele was favourable and the A-allele unfavourable. The E-allele was present only in ER cows, with no homozygous animals, and its effect depended on the other allele in genotype (A or B). (Fig. 5A,B). The breed effect on differences was significant for curd firmness but not for coagulation time. The κ-casein genotype distribution differed significantly between breeds; however, within each breed, the distribution did not deviate from the Hardy–Weinberg equilibrium (Fig. 5C).
Expected marginal means (with 95% confidence intervals) of (A) coagulation time RCT and (B) curd firmness a30 estimated with linear mixed model considering fixed effects of breed (ER – Estonian Red, EN – Estonian Native), calendar month, parity group, κ-casein genotype, third-order polynomial of days in milk and κ-casein genotype and days in milk interactions with breed, and random effects of farm and sire; means without common letters in the same breed are statistically significantly different (Tukey post hoc test). (C) Distribution of κ-casein genotypes by breed; P-values indicate statistically significant difference between breeds (pER vs. EN), but no difference from Hardy–Weinberg genetic equilibrium for either breed (pHW).

Figure 5 Long description
The image A showing a line graph with error bars. The horizontal axis label is kappa-casein genotype, with categories A slash A, A slash B, B slash B, A slash E and B slash E. The vertical axis label is RCT, min, with tick labels 5, 10, 15, 20. A legend shows ER and EN. ER values shown at the categories: A slash A 16.4, A slash B 16.0, B slash B 13.0, A slash E 16.5, B slash E 12.1. EN values shown at the categories: A slash A 13.7, A slash B 13.6, B slash B 7.5. Text inside the plot area: P subscript B equals 0.245; P subscript G less than 0.001; P subscript B times G equals 0.656. The image B showing a line graph with error bars. The horizontal axis label is kappa-casein genotype, with categories A slash A, A slash B, B slash B, A slash E and B slash E. The vertical axis label is a 30, mm, with tick labels 20, 30, 40, 50, 60. A legend shows ER and EN. ER values shown at the categories: A slash A 22.0, A slash B 24.0, B slash B 32.0, A slash E 23.1, B slash E 33.0. EN values shown at the categories: A slash A 34.4, A slash B 39.0, B slash B 47.6. Text inside the plot area: P subscript B equals 0.022; P subscript G less than 0.001; P subscript B times G equals 0.613. The image C showing a grouped bar graph. The horizontal axis label is kappa-casein genotype, with categories A slash A, A slash B, B slash B, A slash E and B slash E. The vertical axis label is Proportion of cows, percent, with tick labels 0, 10, 20, 30, 40, 50. A legend shows ER and EN. Bars with values printed above them: A slash A: ER 43.0 percent, EN 39.2 percent. A slash B: ER 30.0 percent, EN 43.9 percent. B slash B: ER 9.3 percent, EN 8.3 percent. A slash E: ER 8.1 percent. B slash E: ER 9.6 percent. Text near the top: ER versus EN less than 0.001. Text near the right: P subscript H W equals 0.423; P subscript H W equals 0.390.
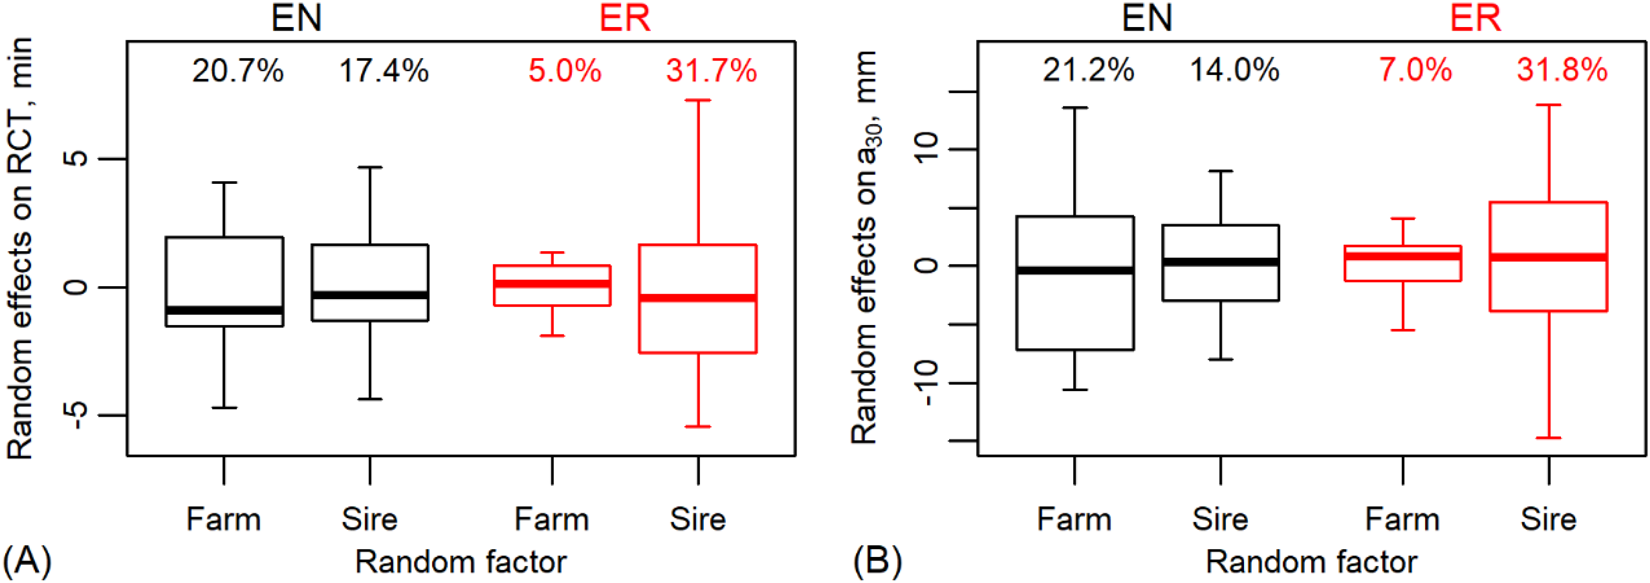
The separate models fitted for both breeds showed that the combined farm and sire effects explained approximately 35–39% of the variance in coagulation properties in both breeds. However, for ER, most of the variance was attributed to the sire effect. In contrast, for EN, the farm and sire effects contributed similarly to the explained variance, with the farm effect being slightly more prominent (Fig. 6).
Size of random farm and sire effects on (A) milk coagulation time (RCT) and (B) curd firmness (a30) by breeds (ER, Estonian Red; EN, Estonian Native). Numerically presented are intraclass correlation coefficient values indicating the proportion of variance of the dependent variable explained by random factors.

Discussion
This study examined the impact of cow-related and on-farm factors on MCP in two breeds: the endangered EN and the commercial ER breed. In 2021, the milk yield of EN cows was 4,547 kg per year, with fat and protein contents of 4.60% and 3.52%, respectively (EPJ, 2021). The annual milk yield of ER cows was 9,117 kg, and the fat and protein contents were 4.09% and 3.50%, respectively. Our results for milk composition were similar to the average values reported for the breeds; the milk yield of the ER cows was nearly twice as high as that of the EN cows.
Comparing MCP between breeds, the milk from local breeds has generally shown better coagulation properties than that of commercial reference breeds (Bittante et al., Reference Bittante, Penasa and Cecchinato2012; Poulsen et al., Reference Poulsen, Glantz, Rosengaard, Paulsson and Larsen2017; Inglingstad et al., Reference Inglingstad, Devold, Damiano, Holene, Svartedal, Comi, Eliassen, Asledottir, Ulleberg and Vegarud2024). Similarly, Jõudu et al. (Reference Jõudu, Henno, Värv, Viinalass, Püssa, Kaart, Arney and Kärt2009) also showed that the EN breed had superior MCP compared to the Estonian Holstein breed. However, as with the current study, no significant differences were found between the EN and ER breeds (Jõudu et al., Reference Jõudu, Henno, Värv, Viinalass, Püssa, Kaart, Arney and Kärt2009).
Differences in MCP among breeds are primarily associated with variations in milk composition, particularly protein concentration and composition (Frederiksen et al., Reference Frederiksen, Hammershøj, Bakman, Andersen, Andersen, Qvist and Larsen2011; Jensen et al., Reference Jensen, Poulsen, Andersen, Hammershøj, Poulsen and Larsen2012; Sanjayaranj et al., Reference Sanjayaranj, Lopez-villalobos, Blair, Janssen, Holroyd and MacGibbon2023), which are attributed to genetic variation. Based on the mean values of the studied variables here, the higher milk fat and casein contents in EN cows did not result in significantly superior MCP compared to ER cows. However, numerically, the MCP of the EN breed were slightly better than that of the ER breed. The relatively small impact of milk fat, protein and casein content, as well as casein micelle size and fat globule size distribution, on the rennet coagulation properties of milk was further confirmed by the weak correlations between these parameters and rennet coagulation properties within breed. Regarding other cow-related factors, the model analysis showed a significant effect of the κ-casein genotype and lactation stage on MCP, as well as the influence of breed on the extent of differences in curd firmness. In relation to the association of milk protein genetic variants with MCP, κ-casein variants have been the most widely studied (Bittante et al., Reference Bittante, Penasa and Cecchinato2012). Similarly to our results, previous studies have shown that, compared to other alleles, the B-allele is associated with superior MCP (Bittante et al., Reference Bittante, Penasa and Cecchinato2012; Nadugala et al., Reference Nadugala, Pagel, Raynes, Ranadheera and Logan2022). Studies comparing the composition and properties of milk from local/native breeds with the corresponding traits of modern/commercial reference breeds have found that the frequency of the κ-casein B-allele is higher in native breeds than in reference non-native breeds (Poulsen et al., Reference Poulsen, Glantz, Rosengaard, Paulsson and Larsen2017; Inglingstad et al., Reference Inglingstad, Devold, Damiano, Holene, Svartedal, Comi, Eliassen, Asledottir, Ulleberg and Vegarud2024). However, in the current study, both native (EN) and modern (ER) breeds showed a predominance of the unfavourable allele A, and the genotype distribution did not deviate from the Hardy–Weinberg equilibrium. This indicates that no genetic selection occurred in either breed based on the κ-casein genotype and MCP. The coagulation properties of milk showed a similar lactation dynamic for both breeds and were consistent with previous findings (Jõudu et al., Reference Jõudu, Henno, Värv, Kaart, Kärt and Kalamees2007; Visentin et al., Reference Visentin, De Marchi, Berry, McDermott, Fenelon, Penasa and McParland2017).
The presence or absence of differences in MCP between the EN and ER breeds cannot be entirely attributed to the genetic background of the breeds. The stronger farm effect observed in the EN breed likely reflects greater heterogeneity in farm size, housing and feeding practices, whereas the ER herds were larger and more uniform (Fig. 1). Such variability in farm management may partly explain why the farm contribution to coagulation properties appeared almost 3–4 times higher in EN cows compared with ER cows. The finding is consistent with the random forest analysis, which showed stronger associations between coagulation properties and several milk production and quality indicators in EN cows compared to ER cows. The effect was particularly evident for milk urea content, as dietary crude protein concentration and protein balance in the rumen are considered the main nutritional factors influencing this trait (Nousiainen et al., Reference Nousiainen, Shinfield and Huhtanen2004; Zhao et al., Reference Zhao, Zang, Zhao, Zheng, Zhang and Wang2025). Therefore, more variable feeding and management conditions of EN cows likely contribute to the variability in many milk indicators, including milk coagulation. The effect of milk urea content on MCP has been little studied to date, but some authors (Bland et al., Reference Bland, Grandison and Fagan2015; Benedet et al., Reference Benedet, Manuelian, Penasa, Cassandro, Righi, Sternieri, Galimberti, Zambrini and De Marchi2018) have shown mostly weak or moderate correlations between milk urea content and RCT, curd firmness rate or curd firmness. The greater impact of the farm on the MCP of EN cows is also indicated by the stronger correlation found between MCP and SCS in the EN breed compared to the ER breed. Thus, greater variability in feeding and housing conditions on EN farms affects the relative proportions of cow-related factors and farm effects as determinants of MCP compared to ER farms.
Limitations of the study
Because cows of the two breeds were mainly kept on separate farms and farms’ characteristics and management practices and their variability were different for different breeds, there was no opportunity to uniquely distinguish breed and farm effects. Also, the age distribution of ER and EN cows was not identical – there were very few first-parity cows samples among ER. However, as the modelling did not show a clear age effect, and most of the analyses were made by breeds, farm or age effect should not have notably affected the results obtained.
Conclusion
The study revealed that, due to the high variability of farm-related factors typical of managing native endangered breeds, the farm had a stronger effect on MCP in the native EN breed than in the commercial ER breed. The genetic effect of the sire was greater in the ER breed. These findings suggest that strategies to improve milk coagulation should be tailored to the production context. Therefore, to improve MCP, the first step should be to ensure balanced feeding and optimal management; if there is little room for improvement in these areas, the focus should shift to breeding.
Acknowledgements
We thank the Animal Breeders’ Association of Estonia, the Estonian Native Cattle Breed Society, Estonian Livestock Performance Recording Ltd. and the staff of all participating farms for their contribution, and David Arney from the Chair of Animal Nutrition Sciences, Estonian University of Life Sciences, for the linguistic revision of the manuscript.
Funding statement
The study was supported by the Estonian Ministry of Rural Affairs (Estonian Rural Development Plan measure 16.2, reference no. 616118790020).
Competing interests
The authors declare that they have no known competing financial interests or personal relationships that could have influenced the work reported in this paper.
Data availability
The datasets generated and/or analysed in the current study are available from the corresponding author for scientific purposes upon written request.
CRediT authorship contribution statement
Conceptualization: M.H., I.J., H.V.; Methodology: M.H., A.S., T.K., I.J., H.V.; Investigation: M.H., H.V., A.S., I.J.; Data curation: A.S., T.K.; Formal analysis: T.K., A.S.; Visualisation: T.K.; Writing – original draft: M.H., T.K., K.L.; Writing – review and editing: A.S., I.J., H.V., P.K., A.T., M.O.; Resources: M.O.




 Open access

