I. INTRODUCTION
The miniaturization of new RF architectures leads to the integration of more and more RF-microsystems. In order to examine the performance of all those various instruments without electromagnetic interference, it is necessary to develop new shielding and absorbing materials. With the emergence of nanoparticles and nano-objects, a new class of tunable nanocomposites has entered the mainstream broadband market. The use of composite materials based on carbon nanotubes (CNT) appears to be very promising for nanotechnologies. CNT have shown exceptional stiffness [Reference Overney, Zhong and Tomanek1], remarkable thermal [Reference Che, Çagin and Goddard2], and electrical properties [Reference Yao, Postma, Balents and Dekker3]. These advantages make them ideal candidates for the development of multifunctional material systems.
Numerous applications are envisioned for CNT, notably as part of a new class of nanocomposite materials; these nano-objects may be blended into a metal [Reference Laha, Agarwal, McKechnie and Seal4], ceramic [Reference Flahaut, Peigney, Laurent, Marlière, Chastel and Rousset5] or, more commonly, polymer matrix [Reference Barrau, Demont, Perez, Peigney, Laurent and Lacabanne6]. The goal is to obtain a tunable material and to improve the physical properties of the composites. Depending on the application, the novel material could be configured for a low level of percolation threshold (pc) [Reference Rul, Lefevre-Schlick, Capria, Laurent and Peigney7], or to improve mechanical [Reference Laha, Agarwal, McKechnie and Seal4], thermal [Reference Cai and Song8], and electrical properties of the matrix [Reference Sandler, Kirk, Kinlocj, Shaffer and Windle9]. In microwave application, CNT can be utilized (or proposed) for the electrical discharge of bridges microelectromechanical systems (MEMS) where the CNT are added into the dielectric materials [Reference Bordas10] and improve the reliability of MEMS. Moreover, the addition of CNT in composites is purposed for broadband microwave absorbing materials [Reference Said, Bednarz, Daussin, Bailly and Xudonng11, Reference Park, Lee, Kim and Han12]. These composites facilitate the protection of the sensitive electrical devices from electromagnetic waves. Indeed, the electromagnetic radiations coming from different sources – electronic circuitry, radar, mobile phone, radios, power lines, etc. – are increasingly present in our environment and could affect the circuits' performances. In 1983, Air Canada did not allow the use of personal computers on its flights for fear that radiated electromagnetic waves will interfere with the onboard navigational computers. This action is still true nowadays, as air plane companies classically recommend switching off all electronics devices during take-off and landing for the purpose of security.
In this paper, the study consists of electromagnetic characterization and electromagnetic modeling of composites based on BenzoCycloButen® (BCB) [Reference Chemical® and Midland13] polymer dispersed with CNT at microwave frequencies (40 MHz to 20 GHz) using coplanar waveguides (CPWs) as test structures. This polymer was chosen because of its frequent use in microwave applications [Reference Grenier14], its remarkably low-dissipation factor (0.0008–0.002 at 1 MHz to 10 GHz, respectively), and low relative permittivity (~2.65).
According to our knowledge, and with the exception of our earlier work [Reference Pacchini, Idda, Dubuc, Flahaut and Grenier15], this paper is the first report on a concentration characterization by image processing of CNT in BCB. It is shown in Section II that the different concentrations were optically characterized and compared with targeted ones. The results show very low deviation (<1%) between measurements and targeted concentrations.
Moreover, this study presents a primary report on the microwaves electrical properties (σ, ɛ, tan δ) and the power absorption (PA) of CNT–BCB nanocomposite at microwave frequencies. The conduction properties, the percolation threshold (pc), and the PA of CNT nanocomposites are compared with other CNT-containing composites, which are described in the literature. A conductivity level of 0.5 S/m is obtained with only 0.37 wt% concentration of CNT. A good dispersion of CNT in the polymer is necessary and enables a low percolation threshold of “pc = 0.075 wt%”. As detailed in Section III, having a good conduction in the material will favor the absorption of power inside the material. The measurements results confirm PA (as defined in Section IV) for a shielding thickness of 16 µm. Such thickness corresponds indeed to a typical value for microelectronic systems in microwave applications. For higher concentrations (0.37 wt%), the absorption level of CNT nanocomposites may be multiplied by a factor 10.
II. SAMPLES PREPARATION
A) Fabrication and purification of CNT
As described previously [Reference Flahaut, Bacsa, Peigney and Laurent16], the CNT were prepared by catalytic chemical vapor deposition of a H2–CH4 mixture at 1000°C with a CoMo–MgO catalyst. CNT are free from amorphous carbon contamination and the use of an MgO support allows their easy removal [Reference Flahaut, Peigney, Laurent and Rousset17] without damaging the nanotubes. During the extraction step, the oxides and unprotected metal nanoparticles were dissolved by the addition of an aqueous solution of HCl. The acidic suspension was then filtered on 0.45 µm pore-sized polypropylene membranes (Whatman) and washed with demonized water. The wet nanotubes were then dispersed in T1100 (solvent of BCB) by solvent exchange. Finally, the suspensions were obtained by adding 15.8 g of T1100 to 300 mg of “wet” CNT. The double-walled carbon nanotubes (DWNT) have two concentric walls with an average outer diameter “d” of 2 nm and a length “l” between 1 and 10 µm [Reference Flahaut, Bacsa, Peigney and Laurent16]; 80% of them have metallic properties, which means that the remaining 20% have semiconducting properties.
B) CNT-polymer blend preparation
The dispersion of the CNT in the matrix system is an important challenge. These nanoparticles exhibit an important specific surface area (ca. 1000 mReference Che, Çagin and Goddard2/g) that plays a role in the strong tendency of CNT to form agglomerates. Exploiting the CNT properties in polymers is therefore related to their homogeneous dispersion in the matrix and the separation of the agglomerates, as well as good wetting by the polymer.
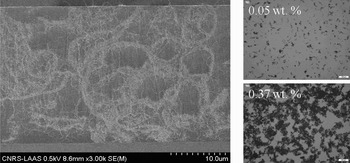
CNT were added to the BCB polymer by mechanical mixing (blender) in order to improve the homogeneity of the CNT in the BCB polymer. The morphology and microstructure of the CNT-containing composites was observed by scanning electron microscopy (FEG-SEM) as shown in Fig. 1, and in their “as-prepared” state.
SEM cross-sectional views of BCB/DWNT composites and optical microscope images of CNT–BCB composites at 0.05 and 0.37 wt%.

By mixing 22.58 g of BCB, 4.49 g of T1100, and 0.008 g of CNT with the blender, a CNT–BCB composite could be fabricated at a high nanotube concentration (0.37 wt%). Next, in order to obtain low concentrations of CNT, the solvent T1100 and BCB were added in proportion 5:1. Finally, five different concentrations of CNT in BCB polymer (0.05, 0.1, 0.2, 0.3, and 0.37 wt%) were investigated. Using equation (1), we calculated the weight concentration of CNT:

where mCNTs and mBCB are the CNT and the BCB masses, respectively.
Additionally, a composite without CNT (0 wt%) was fabricated and used as a reference sample. Composite solutions (in T1100) were spin coated on silicon wafers and polymerized at 250°C for 1 h in nitrogen flow. Optical microscope images of spin-coated deposits at two different concentrations are compared in Fig. 1.
Both at the lowest and highest CNT concentrations, SEM and optical microscope (Fig. 1) images show agglomerates of CNT. It was observed that the aggregate size increases with the CNT concentration. CNT networks were formed at all concentrations. At the highest CNT concentration (0.37 wt%), large black agglomerates are clearly visible on the surface and may change the surface roughness.
C) Planarization of BCB/DWNT composites
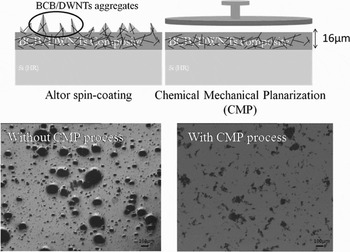
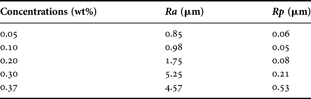
The presence of CNT agglomerates modified the surface roughness, leading to a bad interface for electrical characterization. In order to obtain a clean planar interface, a polishing step (chemical mechanical planarization – CMP) was performed for each sample. In all experiments presented in this paper, a CDP41 CMP tool from Logitech was used for polishing the wafers. By combining 1 psi pressure of mechanical friction (rotating plate) and a flow rate of 100 ml/min of a chemical agent, the surface roughness was decreased by a factor 10. The surface polishing step is illustrated in Fig. 2 where it can be observed that the surface roughness was clearly decreased after polishing. The results are listed in Table 1, before (noted Ra) and after (noted Rp) the polishing step.
Polishing process and optical microscope images of BCB/DWNT composite (0.127 wt%): (a) before CMP, and (b) after CMP.

Measured roughness before (Ra) and after polishing (Rp) for each CNT concentration
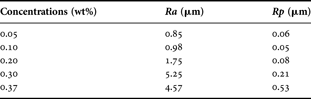
The data show a significant increase in the roughness with the CNT concentration. For the highest concentration of CNT (0.37 wt%), the surface roughness was significantly decreased after polishing (Ra = 4.57 µm, Rp = 0.53 µm). The planarization of the CNT–BCB composites decreased the global surface roughness to 0.5 µm in the worst case.
III. CHARACTERIZATIONS AND ELECTROMAGNETIC SIMULATION OF NANOCOMPOSITES
A) Concentration characterization
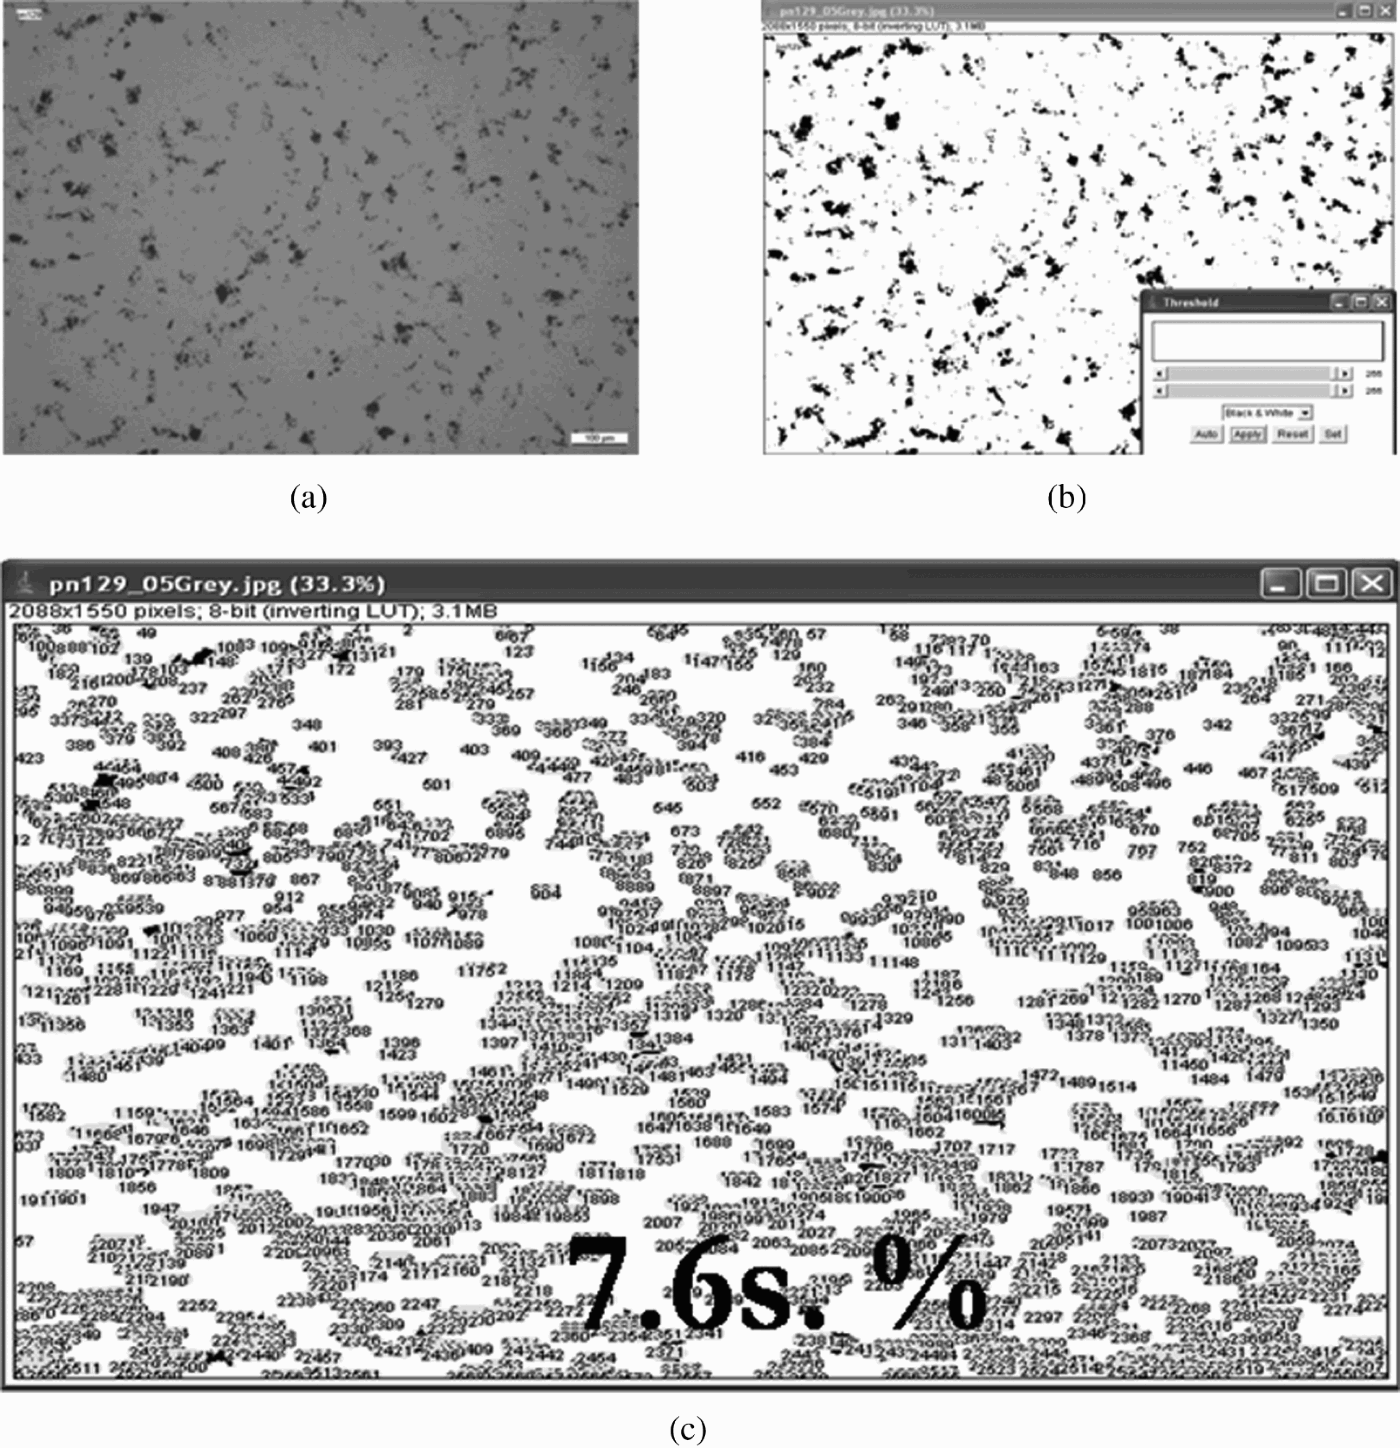
To quantify the CNT concentration in the composites, this paper presents a first concentration characterization using a standard image processing method. Concentrations of CNT are characterized by evaluating the black point quantity of the optical microscope images as shown in Fig. 1; these black points represent the CNT agglomerate on and into the BCB layer. At different concentrations (see Fig. 1), the presence of CNT can be more or less important. For high concentration (0.37 wt%), the quantity of black points or the CNTs agglomerate are more important than for low concentration such as 0.05 wt%. The concentrations may be evaluated as a function of quantity of agglomerates using the image processing program ImageJ. The ImageJ 1.38× software calculates the surface black point quantity in percentage (s. %). Figure 3 shows an example of the characterization steps for a CNT concentration of 0.05 wt%.
Concentration characterization of CNT–BCB composites of 0.05 wt%: (a) monochrome optical microscope image, (b) tuning of threshold contrast (black point), and (c) particle analysis results in surface concentration (% s).
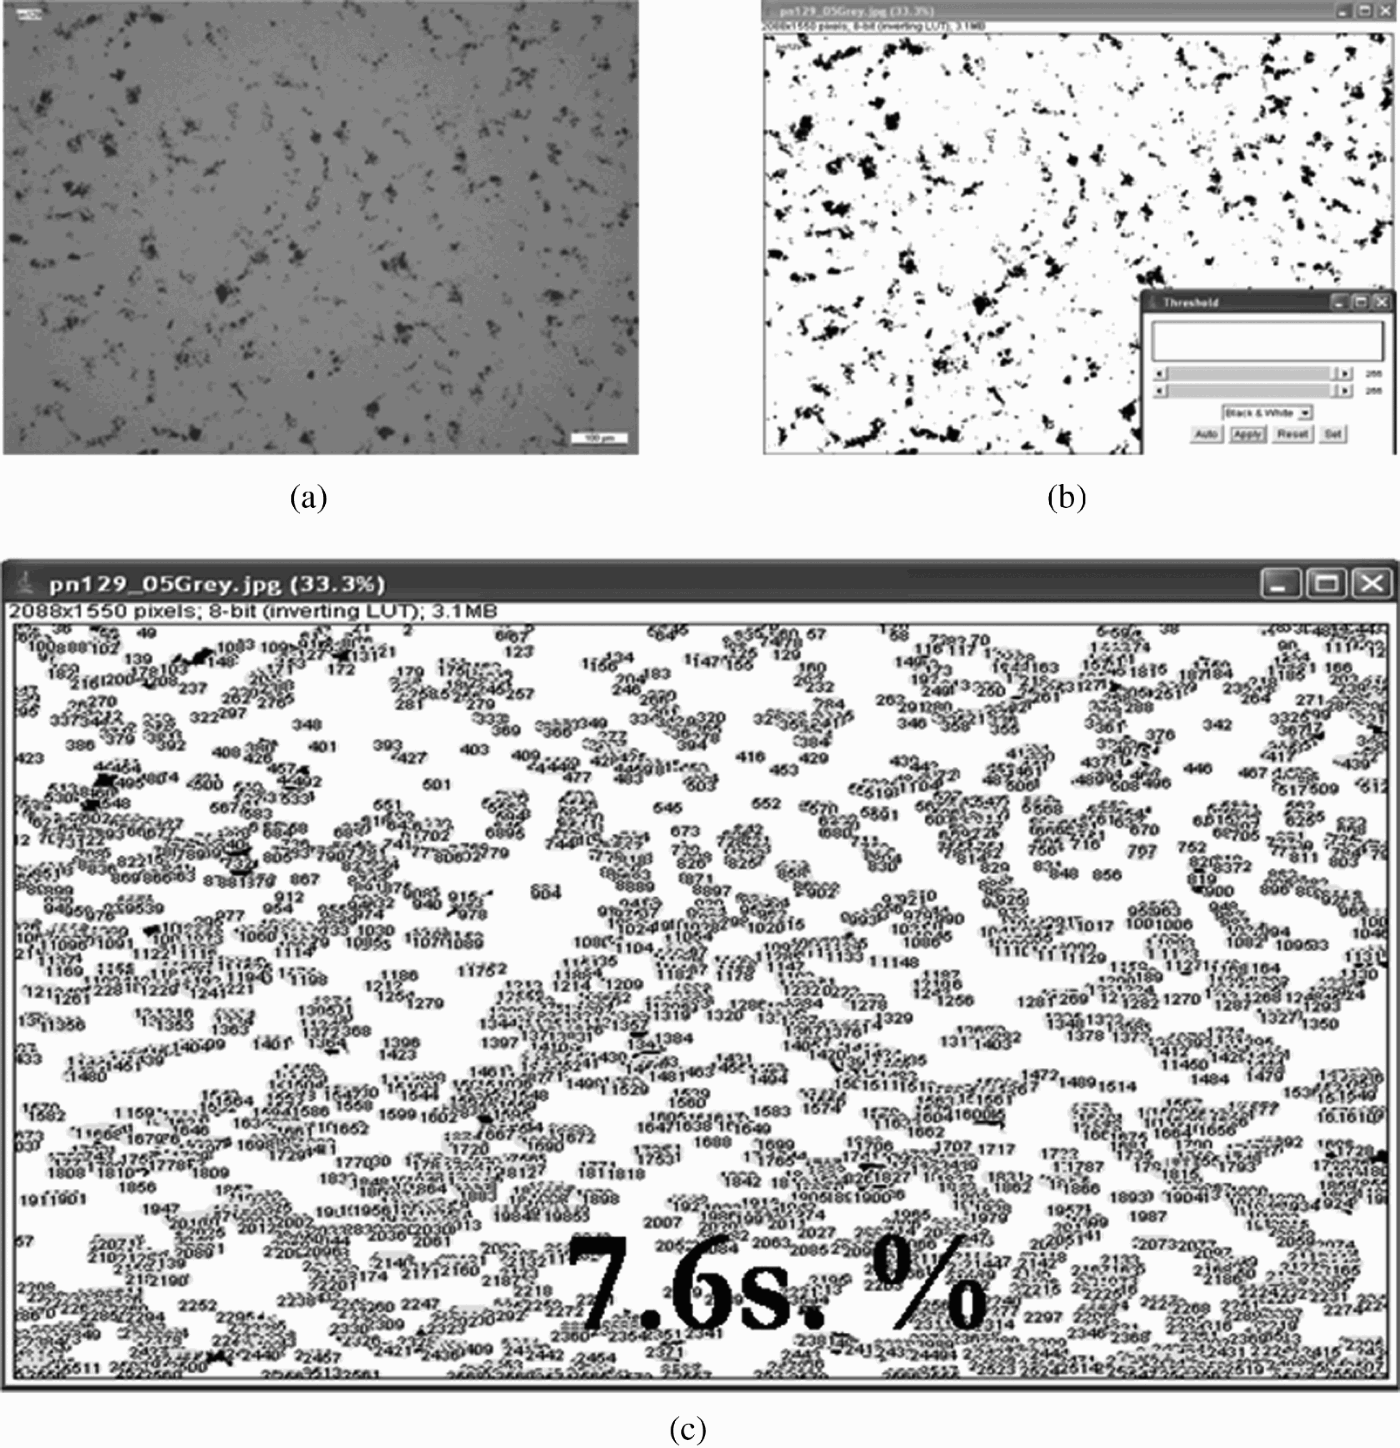
The process starts with an optical microscope image conversion from color to monochrome image, as shown in Fig. 3(a), as the particles analysis requires a “binary” image (i.e. black and white). The edges need to be exactly defined in order to allow morphological measurements by the software. A “threshold” range has to be set. Pixels, the value of which is included in this range are converted into black, whereas the other ones are converted into white, as shown in Fig. 3(b). Based on this analysis, the quantity of particles is determined in surface percent (s. %), as shown in Fig. 3(c).
The surface percentage is then calculated and integrated via equation (2) in order to extract the weight percentage (wt%) of CNTs [Reference Vergne18]:

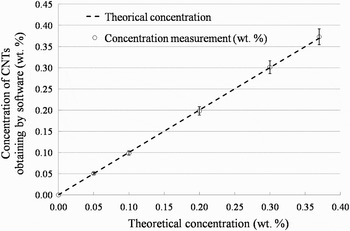
where ρm and ρp are the densities of BCB (0.97 g/cm3) and CNT (2.36 g/cm3 [Reference Peigney, Laurent, Flahaut, Bacsa and Rousset19]), respectively. Φpm is the weight concentration (wt%) and Φps is the surface concentration obtained with Image J software (s. %). The measurement values and the theoretical concentrations are reported and compared (see Fig. 4).
Theoretical concentrations versus measured concentrations with Image J software.

The excellent agreement between the image processing results and the calculated ones illustrates the accuracy of our calculation technique (deviation <5%). Hence, it can be concluded that the characterization method of CNT concentration with an image processing program is appropriate to characterize the composite after fabrication.
Therefore, the following section will concentrate on the electromagnetic characterization and electromagnetic simulations.
B) Electromagnetic characterization and electromagnetic simulations
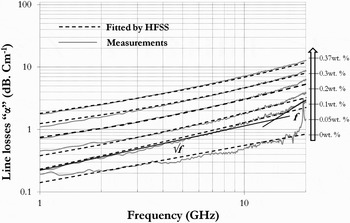
To characterize the nanocomposites in the microwave regime, CPW transmission lines were designed and realized on various 16 µm BCB-composite layers (over a silicon substrate) featuring the different concentrations presented in Table 1. Using a vector network analyzer coupled to an on-wafer probe station, measurements were completed in a range from 40 MHz up to 20 GHz. For each BCB-composite, a line–line method [Reference Bianco and Parodi20] using three lines with different lengths (600, 800, and 1000 µm) was developed in order to extract the dielectric constant and losses of the various BCB composites. S-parameters characterization was presented in a previous study [Reference Pacchini, Idda, Dubuc, Flahaut and Grenier15] and demonstrated a good repeatability between identical samples. The data of one of the samples are plotted in Fig. 5 (solid).
Line losses measurement (solid) and simulate (dotted line) for 0, 0.05, 0.1, 0.2, 0.3, and 0.37 wt% of CNT concentration.

This study presents the complex propagation constant “γ” and effective parameters that can be extracted from S-parameter measurement using (3). The relative parameters (ɛreff, σreff) include the different layers (silicon substrate, BCB or composite, metallic line, and air). In our case, CNTs are randomly aligned (as manifested in Fig. 1) and we will treat the nanocomposite as an isotropic effective medium.
From “γ” we can easily deduce the line losses “α” and the relative effective permittivity “ɛreff” of the CPWs using equation (4). To determine the effective parameters (ɛeff, σeff), the electromagnetic simulator (high frequency structure simulator – HFSS) was used to fit between measurements with simulations.
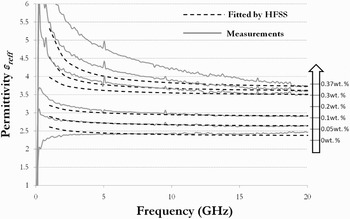
As a reference, the HFSS simulations show good agreement with measurements in the case of a BCB-polymer layer without CNT. The supplier's parameters were integrated (tan δ = 0.0008 and ɛeff = 2.65) in HFSS simulator, and the excellent agreement between simulation and characterization illustrates the accuracy of the electrical parameter extraction, as shown in Figs 5 and 6. By tuning the effective parameters (ɛeff, tan δ) of BCB polymer within the HFSS software, the simulations were fitted with measurements for each CNT's concentration. For an improved correlation between simulations and measurements, an iterative method is finally performed.
Permittivity measurement (down stroke) and simulate (dotted line) for 0, 0.05, 0.1, 0.2, 0.3, and 0.37 wt% of CNT concentration.

We then monitor the impact of the CNTs concentration on the electromagnetic properties of the resulting composite [Reference Pacchini, Idda, Dubuc, Flahaut and Grenier15].
Data from Figs 5 and 6 show the results of electromagnetic simulations of the line losses and relative effective permittivity, respectively:

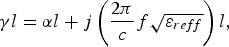
where l is the line length of the CPW, f is the frequency, and c is the velocity of light in free space.
For 0 wt%, Fig. 5 shows that the line losses vary as a function of √f in the range from 1 to 10 GHz and as a function of f in the range of 10–20 GHz. This corresponds to the resistive (αc) and dielectric (αd) losses, respectively. When we doped the BCB polymer with the CNT in BCB polymer, the metallic losses increase. Consequently, α varies as a √f in the range 1–10 GHz. At 0.37 wt%, for example, the lineic losses are multiplied by a factor of 17 (11.9 dB/cm) compared to pure BCB (0.7 dB/cm) over the whole frequency range. This demonstrates the impact of metallic CNT in BCB polymer. Indeed, 80% of CNT are metallic and 20% are semiconductors.
The measurement results and electromagnetic simulations from HFSS of the RF permittivity (ɛreff) are given in Fig. 6 for every CNT–BCB composite. The increase of CNT concentration affects the permittivity parameter. At 20 GHz, the real part of ɛreff ranges from 2.1 (pure BCB) to 3.8 (0.37 wt%).
By definition, ɛreff is composed of a real and an imaginary parts (5). The imaginary part of permittivity is proportional to effective conductivity, to refer to equation (6):
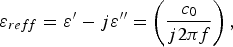

where c 0 and ɛ 0 are, the speed of light and the dielectric permittivity in vacuum, respectively.
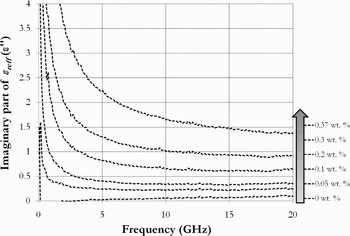
For the BCB polymer without CNT, the imaginary part (ɛ″) is presented in Fig. 7, it is approximately zero (0.03 at 5 GHz and 0.11 at 20 GHz), in all the frequency ranges. This means that BCB polymer is a good dielectric material for microwave applications. By addition of CNT, the ɛ" parameter increases by factor 12 (1.39 at 20 GHz) with 0.37 wt% of CNT. This variation of ɛ″ confirms the conductive behavior of the polymer.
The imaginary part of ɛreff measurement for 0, 0.05, 0.1, 0.2, 0.3, and 0.37 wt% of CNT concentration.

Deduced from S-parameter characterizations, the relative parameters (ɛreff, ɛ″) were extracted and demonstrated modification depending on the CNT doping of the BCB polymer. It is observed that the concentrations in CNT change the electrical properties of BCB.
C) Electrical parameters extraction of nanocomposites
The electric parameters of nanocomposites are studied using the HFSS simulation software. After modeling and fitting between measurements and simulations, conductivity (σeff), permittivity (ɛeff), and loss tangent (tan δ) values are extracted from the HFSS library. The effective parameters indicate the real value of nanocomposites for each concentration.
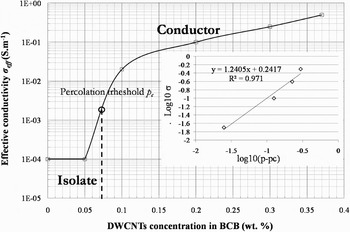
Primary, the effective conductivity variances “σeff” according to the weight percent of CNT is reported in Fig. 8. The results demonstrate a low percolation of nanocomposites doping in CNT (8) [Reference Stauffer and Aharony21]:

where p is the weight fraction of CNTs, pc corresponds to percolation threshold, and t to the critical exponent [Reference Stauffer and Aharony21].
Effective conductivity dependence on the CNT (in linear scale and log10–log10 scale).

A conductivity of three orders of a magnitude higher than the pure BCB is extracted for the 0.37 wt% sample (0.0001 up to 0.5 S/m).
An abrupt percolation threshold “pc” of the conductivity was observed at 0.075 wt% CNT, indicating the existence of percolating paths via connecting CNT. At this stage, the conductivity of the nanocomposite is controlled by the conducting CNT. The conductivity is due to the formation of a network of CNT within the BCB matrix. Barrau et al. [Reference Barrau, Demont, Perez, Peigney, Laurent and Lacabanne6] have presented an optimum percolation threshold of 0.08 wt% obtained with suspensions of CNTs. Our results contribute and confirm the quality of nanocomposite BCB/CNT that we can fabricate.
The inset Fig. 8 shows the percolation scaling law between log σ and log(p − pc) where the solid line corresponds to the best-fitted line.
This law leads to a low percolation threshold (0.075 wt%) and critical value of t = 1.24 less than the classical used one (t = 2). The exponent t reflects the dimensionality of the systems, the values 1.3 and 1.93 corresponding to two and three dimensions, respectively. As reported by Barrau et al. [Reference Barrau, Demont, Peigney, Laurent and Lacabanne22], a value of t around 1.44 has been observed in Polyepoxy. The low value of t would not be the sign of a two-dimensional network but rather a consequence of weakly connected parts in the networks.
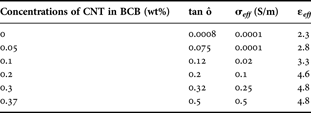
To define the electrical behavior of the composite, the loss tangent (tan δ), effective permittivity (ɛeff), and the effective conductivity (σeff) are defined for each concentration, as shown in Table 2.
Electrical parameters for each concentration by extraction of HFSS simulator
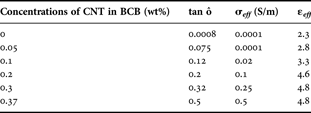
For a doping of 0.2 wt%, the ɛeff increases two times compared to the one without CNT. For a higher concentration (>0.3 wt%), the effective permittivity saturates and reaches a maximum value of 4.8. This behavior will be explained below.
Loss tangents are increased by a factor of 100 under the percolation threshold “pc”. Above pc, tan δ behavior is linear.
The explanation of this is based on the following equation:

The imaginary part of the permittivity (ɛ″) is related to the energy dissipation (or loss) within the medium and the real part (ɛ′) is related to the stored energy within the medium. At the percolation threshold, the loss tangent is dominated by the imaginary part, composed of conductor losses (αc) and dielectric ones (αd) in the composite. At this point, the nanocomposite becomes a conductor composite. After the stationary regime (p > pc ~ 0.2 wt%), the loss tangent is stabilized by increasing the real part of permittivity. Once this point is reached, the composite begins to store energy in the matrix. In microwave applications, the storage of energy is critical for shielding. Therefore, the following section will concentrate on the electromagnetic protection parameter, keeping in mind the conductivity 0.5 s/m and loss tangent of 0.5 for 0.37 wt% in CNT.
IV. NANOCOMPOSITE BCB/CNT FOR MICROWAVE APPLICATIONS
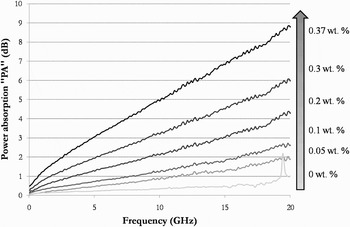
In the previous section, we observed that the addition of CNT within a BCB polymer changes the electrical behavior and increases the linear losses. For microwave applications, losses are generally avoided in the systems so as not to lose the transmission signal. However, these drawbacks can be an advantage for some other applications such as electromagnetic shielding. Our nanocomposite may be a new material for absorbing electromagnetic waves for the microelectronic components. PA that is related to the parameters of the material is defined by

The PA presented in Fig. 9 varies over the frequency range and also for different concentrations of CNT. For the low concentration (0.05 wt%), the low conductivity does not result in significant absorption of the electromagnetic wave through the composite. This is confirmed by the low value of 1 dB at 12 GHz of the PA in the composite. When the concentration increases (0.1–0.37 wt%), the PA in the composite increases. For the 0.37 wt%, the PA reaches 9 dB at 20 GHz instead of 1 dB without CNT. Compared with other studies on composites, one advantage of the proposed composite is the very low-percolation threshold “pc” with the low polymer thickness (16 µm) while keeping a good PA of 9 dB. In addition, we obtain a good conductivity and further improvements could be made by increasing the concentration of CNTs within the polymer or/and by increasing the composite layer thickness. Our study, however, is focalized on the microelectronic scale and for microwave application (Table 3).
PA for BCB/CNT containing 0, 0.05, 0.2, 0.3, and 0.37 wt% of inclusion.

Summary of reported properties of carbon nanotubes composite

At a fixed frequency, the contribution of CNTs is very significant in terms of electromagnetic absorption. For expected PA at a fixed frequency, the concentration of nanocomposites can be consequently predicted and fabricated. For example, for 5 dB of PA at 15 GHz, a 0.3 wt% concentration is necessary to fulfill the specifications. We have thus obtained an engineerable configurability of nanocomposites for RF applications.
V. CONCLUSIONS
This paper presents a study of CNT–BCB-based composites for microwave applications. Our research started from experimental results to equivalent modeling. For good dispersion of CNT into the BCB polymer matrix, we used purified and filtered double-walled CNTs obtained from the CIRIMAT laboratory to obtain a high quality of CNT. Their suspension in the BCB solvent (T1100), combined to a mechanical dispersion method (mixer) improved the uniformity mixing of the nanocomposites. These techniques allowed the production of composite materials from 0 to 0.37 wt%. For high concentrations, however, CMP was used to reduce the surface roughness caused by the agglomerates of CNT. CPWs on different composites were then fabricated; this permitted us to characterize losses induced by CNTs. The majority presence of metallic CNTs increased the linear losses, which implied an increase in conductivity of the material. An iterative simulation allowed the extraction of electrical parameters (σeff, ɛeff, and tan δ) of each composite. The change of effective conductivity identified a percolation threshold of 0.075 wt%. This very low value was obtained by using a liquid suspension of DNTCs. These nanocomposites could be implemented for electromagnetic shielding of electronic systems at the micrometer scale. The small thickness and compatibility with integrated circuits' technologies correspond to strong advantages for their use as new absorbent materials in microelectronics.
ACKNOWLEDGEMENT
The authors wish to acknowledge the French National Space Studies Center, CNES, for their financial support through the convention project n° 60358/00.
 Sebastien Pacchini was born in Bastia in 1979. He received his Ph.D. degree from the CNRS/ LAAS Laboratory (Laboratoire d'Analyse et d'Architecture des Systèmes du Centre National de Recherche Scientifique), University of Paul Sabatier, Toulouse, France, in 2008. His studies have demonstrated the potentialities of carbon nanotubes into microwaves applications. The work has been carried out in collaboration with the LPICM laboratory (Laboratory of the Polytechnic in Paris), CIRIMAT laboratory, and the French Space Agency (CNES) in Toulouse. He has authored or coauthored over 13 papers in refereed journals and conference proceeding. From January 2009, he has joined the Microsystems and Nanosystems for Wireless Communication research group in LAAS-CNRS and he is very implicate in the study of novel nano-material for microwave application. He works in collaboration with university, industry, and research partners in national and international projects of CNT and ferroelectric material (BST).
 David Dubuc received the Agregation degree from the Ecole Normale Supérieure de Cachan, Paris, France, in 1996, and M.S. and Ph.D. degrees in electrical engineering from the University of Toulouse, Toulouse, France, in 1997 and 2001, respectively. Since 2002, he has been an Associate Professor with the University of Toulouse, and a Researcher with the Laboratory of Analysis and Architecture of System part of National Scientific Research Center (LAAS-CNRS), Toulouse, France. From 2007 to 2009, he was a Visiting Senior Researcher with the Laboratory of Integrated Micromechatronic Systems (LIMMS-CNRS)/Institute of Industrial Science (IIS), University of Tokyo, Tokyo, Japan. His research interests include the development of microwave circuits integrated due to microtechnologies and their application to wireless telecommunication and biology.
 Emmanuel Flahaut works as a CNRS researcher at the CIRIMAT (Inter-University Centre for Research and Engineering of Materials) at the University Paul Sabatier in Toulouse, France. He received his P.D. in 1999 from the University of Toulouse, in the field of the catalytic chemical vapor deposition (CCVD) synthesis of carbon nanotubes (CNT) and the investigation of CNT-containing nanocomposite ceramics. He has developed a synthesis route allowing the gram-scale synthesis of double-walled CNT (DWNT) with ca. 80% selectivity associated to a good purity. He was a post-doctoral research assistant at Oxford University in the group of Pr Malcolm Green where he worked on the filling of CNT with 1D-crystals. His main research fields are the CCVD synthesis and functionalization of CNT (double-walled CNT in particular), for various applications (interconnections in nanoelectronics, composite materials, sensors). In collaboration with biologists (toxicologists, ecotoxicologists), Dr. E. Flahaut is working on the human health issues related to CNT as well as the study of their environmental impact (he is leading a French program on this topic).
 Katia Grenier (M'03) received her M.S. and Ph.D. degrees in electrical engineering from the University of Toulouse, Toulouse, France, in 1997 and 2000, respectively. She was engaged in microelectromechanical systems (MEMS) circuits on silicon. She was a Postdoctoral Fellow at Agere Systems (Bell Labs). In 2001, she joined the Laboratory of Analysis and Architecture of System part of National Scientific Research Center (LAAS-CNRS), Toulouse, France. From 2007 to 2009, she was with the Laboratory for Integrated Micromechatronic Systems CNRS (LIMMS-CNRS)/Institute of Industrial Science (IIS), University of Tokyo, Tokyo, Japan, where she was engaged in launching research activities on microwave-based biosensors. Her research interests in LAAS-CNRS are now focused on the development of fluidic-based micro/nanosystems for reconfigurable wireless applications as well as biological and medical ones.