

1. Introduction
The Himalayan orogen is the result of the ongoing collision between the Indian and Asian continental plates, which initiated at c. 55 Ma (e.g. Klootwijk et al. Reference Klootwijk, Gee, Peirce, Smith and McFadden1992; Hu et al. Reference Hu, Garzanti, Wang, Huang, An and Webb2016). The processes that have governed the evolution of this collisional system have been studied intensively for the past four decades, resulting in a myriad of different tectonic models (e.g. Jamieson et al. Reference Jamieson, Beaumont, Medvedev and Nguyen2004, Reference Jamieson, Beaumont, Nguyen and Grujic2006; Kohn, Reference Kohn2008; Larson et al. Reference Larson, Godin and Price2010b , Reference Larson, Ambrose, Webb, Cottle and Shrestha2015; Cottle et al. Reference Cottle, Larson and Kellett2015; He et al. Reference He, Webb, Larson, Martin and Schmitt2015 and references therein). The vast majority of Indian-affinity rocks exposed in the southern portion of the Himalaya, even those from the highest summits (e.g. Corthouts et al. Reference Corthouts, Lageson and Shaw2016), have been extensively investigated (e.g. Kohn, Reference Kohn2014; Martin, Reference Martin2017; Kellett et al. Reference Kellett, Cottle and Larson2018). Previous work has resulted in an improved understanding of the processes responsible for the assembly of the Himalaya and the evolution of large, hot orogens in general (e.g. Law et al. Reference Law, Searle and Godin2006). Yet, despite the effort made to examine the Himalaya, some parts of the mountain belt remain understudied as a result of inaccessibility or past political obstacles. These under-explored regions represent knowledge gaps that hinder the evolving knowledgebase of the Himalaya and potentially hold new discoveries to be made.
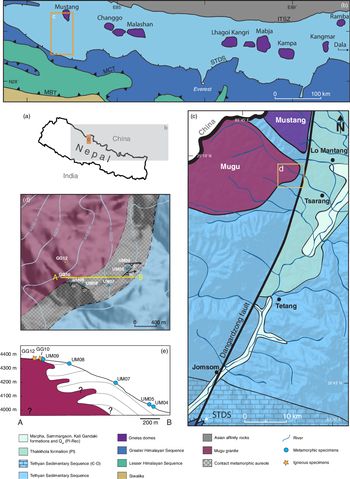
One such area is the Upper Mustang region, situated in west-central Nepal (Fig. 1a, b). Access to this border area has long been restricted to foreigners, making it one of the most scientifically isolated regions of Nepal. One of the few studies to have been completed in the Upper Mustang outlined the ‘Upper Mustang massif’ (UMM; Hurtado, 2002), an inferred domal culmination comprising two plutonic bodies locally flanked by amphibolite-facies metamorphic rocks (Fig. 1c), and interpreted to reflect regional metamorphism correlative to exhumed, former mid-crustal rocks exposed in structural windows in southern Tibet and along the Himalayan front. A second study that examined the same rocks yielded a contrasting interpretation. Based largely on thermobarometry, Guillot et al. (Reference Guillot, Pêcher and Le Fort1995b) argued that metamorphism of rocks surrounding the Mugu leucogranite resulted from contact metamorphism.
(a) Location of the study area on the map of Nepal. (b) Simplified geological map with the locations of the North Himalayan domes and leucogranites (modified from Larson et al. Reference Larson, Kellet, Cottle, Camacho and Brubacher2019 after Burchfiel et al. Reference Burchfiel, Chen, Hodges, Liu, Royden, Deng and Xu1992; Lee et al. Reference Lee, Hacker and Wang2004, Reference Lee, Hager, Wallis, Stockli, Whitehouse, Aoya and Wang2011; Guo et al. Reference Guo, Zhang and Zhang2008; Quigley et al. Reference Quigley, Liangjun, Gregory, Corvino, Sandiford, Wilson and Xiaohan2008; Reference Larson, Godin, Davis and DavisLarson et al. 2010a; Carosi et al. Reference Carosi, Montomoli, Rubatto and Visonà2013). (c) Simplified geological map of study area (modified after Hurtado et al. Reference Hurtado, Hodges and Whipple2001; digital elevation model AW3D30 was provided by Japan Aerospace Exploration Agency (JAXA)). STDS – South Tibetan Detachment System. (d) Sampling locations of igneous and metamorphic rocks. (e) Cross-section of the study area.

Erroneous association of metamorphic conditions to inferred processes may impact not only basic interpretations, such as the structural position of the rocks within the crust, but also models that describe the geological evolution of an area or the broader orogen. Fortunately, the Upper Mustang area has recently become more accessible, enabling a targeted investigation of the igneous and metamorphic rocks in this area. In this study, we examine the crystallization of the Mugu pluton and employ classical thermobarometry, trace-element analysis and monazite petrochronology on the surrounding metamorphic rocks to assess the conditions and timing of metamorphism, to test whether these rocks formed under contact or regional metamorphic conditions, and to provide meaningful comparisons with potentially similar features elsewhere within the orogen.
2. Local geological setting
The Upper Mustang region is situated in the northern part of west-central Nepal (Fig. 1a–c). The area is primarily underlain by the Tethyan Sedimentary Sequence (TSS), which comprises Permo-Carboniferous (meta)shale, limestones and quartzites along with leucogranite plutons and local exposures of amphibolites-facies metamorphic rocks (e.g. Fort et al. Reference Fort, Freytet and Colchen1982; Reference Guillot, Pêcher and Le FortGuillot et al. 1995b; Le Fort & France-Lanord, Reference Le Fort and France-Lanord1995; Colchen, Reference Colchen1999; Hurtado, 2002). The TSS is separated from the structurally lower, medium- to high-grade metamorphic rocks of the Greater Himalayan Sequence by the South Tibetan detachment system (STDS), a system of top-to-the-north-sense, N-dipping faults (Kellett et al. Reference Kellett, Cottle and Larson2018). The Annapurna detachment, the local ductile manifestation of the STDS, has been mapped along the southern boundary of the region (Fig. 1c, Godin et al. Reference Godin, Parrish, Brown and Hodges2001). The Upper Mustang region is host to a series of N–S- striking, high-angle normal faults including the Dangardzong fault (Fig. 1c), which is the master fault to the Thakkhola graben. The graben extends from the STDS in the south almost to the Indus Tsangpo suture zone in the north (e.g. Hurtado et al. Reference Hurtado, Hodges and Whipple2001; Searle, Reference Searle2010) and has accommodated E–W extension since at least middle Miocene time (Coleman & Hodges, Reference Coleman and Hodges1995; Hurtado, 2002; Larson et al. Reference Larson, Kellet, Cottle, Camacho and Brubacher2019).
The Upper Mustang region hosts two adjacent plutonic bodies, the Mugu and the Mustang granites (Le Fort & France-Lanord, Reference Le Fort and France-Lanord1995). While the Mustang pluton is located entirely within the Upper Mustang, the Mugu pluton extends laterally over 150 km to the NW, into the adjacent Dolpo region. In previous studies, Mugu intrusive rocks have been described as K-feldspar + plagioclase + muscovite + tourmaline ± garnet ± biotite ± sillimanite leucogranite with local diopside xenocrysts (Le Fort & France-Lanord, Reference Le Fort and France-Lanord1995; Hurtado, 2002). Reported crystallization ages of the Mugu pluton range from 20.8 ± 0.7 Ma to 17.6 ± 0.3 Ma (Harrison et al. Reference Harrison, Grove, Mckeegan, Coath, Lovera and Fort1999; Hurtado, 2002).
Reference Guillot, Pêcher and Le FortGuillot et al. (1995b) reported thermobarometric constraints from garnet + staurolite + sillimanite schists in the vicinity of the Mugu pluton yielding garnet–biotite thermometry temperatures of 440 ± 30°C to 575 ± 20°C and pressures of 3.1 ± 0.8 kbar based on garnet–biotite–muscovite–plagioclase and garnet–plagioclase–aluminium silicate–quartz barometry. These conditions were interpreted to reflect contact metamorphism at a depth of 12 ± 2 km.
In the present work, the timing and conditions of metamorphism of metasedimentary rocks in the vicinity of the Mugu pluton were examined to test previous interpretations about their affinity. Five specimens of garnet ± sillimanite ± staurolite mica schists, UM04, UM05, UM07, UM08 and UM09 were sampled at distances of 476, 445, 361, 296 and 22 m, respectively, from the contact of the Mugu pluton (Fig. 1d, e). The geometry of the Mugu pluton beneath the surface is unknown and therefore aerial distances to the nearest observed contact were used for data interpretation. At the contact, the Mugu pluton intrudes and crosscuts the schists with no evidence of a shear zone in the vicinity (Larson et al. Reference Larson, Kellet, Cottle, Camacho and Brubacher2019). Foliation in the schist dips moderately to steeply to the SE or SW, while lineations plunge shallowly to moderately to the east (Fig. 1d), defined by macroscopic quartz tails around porphyroblasts. Further away from the pluton, the exposed country rock is phyllitic; however, the lithologic transition is obscured by ground cover. In addition to the metamorphic specimens, two leucogranite specimens – GG10 and GG12 – collected from the Mugu pluton were also analysed. Petrography, major- and trace-element geochemistry, classical thermobarometry and monazite petrochronology were performed on metamorphic specimens, while basic petrography and monazite geochronology are reported for the igneous specimens.
3. Analytical techniques
3.a. Petrography and mineral geochemistry
All specimens were examined optically using a polarizing microscope in thin-sections cut parallel to the lineation and perpendicular to the foliation.
High-resolution X-ray thin-section maps (Si, Al, Fe, Mg, Ca, Na, K, Mn, Ce, P, Y) were acquired using a Cameca SXFiveFE electron microprobe housed in the Fipke Laboratory for Trace Element Research (FiLTER) facility at the University of British Columbia Okanagan (UBCO) using an accelerating voltage of 15 kV, a beam current of 200 nA, a beam size of 20 µm and a step size of 20 µm with a dwell time of 15 ms.
Quantitative major-element geochemistry was measured using the same instrument, with an accelerating voltage of 15 kV, a beam current of 20 nA, a beam size of 5 µm and a dwell time of 30 ms on the peak and 15 ms on background. Spot data were collected for garnet, biotite, muscovite and plagioclase (online Supplementary Table S1, available at http://journals.cambridge.org/geo). In addition, qualitative elemental distribution maps of Fe, Ca, Mg and Mn were also generated for selected garnet porphyroblasts with an acceleration voltage of 15 kV, a beam current of 200 nA, a beam size of 5 µm and a step size of 5 µm with a dwell time of 15 ms.
Elemental concentrations were converted from oxide weight percent (wt%) to atom per formula unit (apfu) based on the stoichiometric atoms of oxygen in each mineral: garnet, 12O; biotite and muscovite, 22O; and feldspar, 8O. Garnet and feldspar end-members were calculated as almandine (Alm) = Fe2+/(Fe2+ + Ca + Mg + Mn), grossular (Grs) = Ca/(Fe2+ + Ca + Mg + Mn), pyrope (Prp) = Mg/(Fe2+ + Ca + Mg + Mn), spessartine (Sps) = Mn/(Fe2+ + Ca + Mg + Mn), anorthite (An) = Ca/(Ca + Na + K), albite (Ab) = Na/(Ca + Na + K) and orthoclase (Or) = K/(Ca + Na + K). The Mg content (XMg) in biotite and muscovite was calculated as XMg = Mg/(Mg + Fe2+).
Garnet trace-element data for two specimens, UM07 and UM09, were obtained in situ using a Photon Machines Analyte 193 Excimer laser paired with a ThermoScientific Element XR inductively coupled plasma – mass spectrometer (ICP-MS), while garnet trace-element data for three specimens, UM04, UM05 and UM08, were obtained using the same laser, but a Thermo X-series2 quadrupole ICP-MS. The analytes included rare earth elements (REEs; La, Ce, Pr, Nd, Sm, Eu, Gd, Tb, Dy, Ho, Er, Tm, Yb, Lu) and Y. Si29 was used as an internal standard. NIST SRM 612 was used as a primary reference material, while NIST SRM 610 was used as a secondary control. Spot analysis was performed with a spot size of 29.6 µm, a repetition rate of 8 Hz, and laser fluence of 6.78 J cm–2. Background analysis was set to 60 s, in addition to ablation of 50 s and a 10 s washout. Data reduction for specimens UM07 and UM09 was carried out using Glitter (v.4.4.2, Macquarie University), while Iolite (v.2.5, Patton et al. Reference Patton, Hellstrom, Paul, Woodhead and Hergt2011) was used for specimens UM04, UM05 and UM08. Uncertainties are reported at 1 standard error (SE) (online Supplementary Table S2, available at http://journals.cambridge.org/geo).
3.b. Monazite geochronology and petrochronology
Monazite grains from igneous specimens were separated using standard crushing, hydrodynamic, magnetic and density techniques, then mounted in epoxy and polished to expose grain centres at the University of California Santa Barbara (UCSB), while monazite grains from metamorphic specimens were analysed directly in polished thin-sections. X-ray monazite maps (Y, Ca, La, Th, U) from metamorphic specimens were acquired using a Cameca SX-100 electron microprobe housed at UCSB using an accelerating voltage of 20 kV, a beam current of 200 nA and a dwell time of 100 ms. Monazite grains were analysed with a spot size of 8 µm, a repetition rate of 4 Hz and a laser fluence of 1.7 J cm–2 for 25 s using the Laser Ablation Split Stream (LASS) system at UCSB. The detailed methodology is described in Cottle et al. (Reference Cottle, Kylander-Clark and Vrijmoed2012, Reference Cottle, Burrows, Kylander-Clark, Freedman and Cohen2013) and Kylander-Clark et al. (Reference Kylander-Clark, Hacker and Cottle2013) with modifications as outlined in McKinney et al. (Reference McKinney, Cottle and Lederer2015).
The igneous and metamorphic monazite were analysed in two separate sessions. Isotopic data of monazite in igneous rocks were normalized to ‘44069’ (424.9 ± 0.4 Ma 206Pb/238U isotope dilution – thermal ionization mass spectrometer (ID-TIMS) age; Aleinikoff et al. Reference Aleinikoff, Schenck, Plank, Srogi, Fanning, Kamo and Bosbyshell2006), while ‘Bananeira’ and ‘Trebilcock’ were used as secondary reference materials. A total of 26 repeat analyses of ‘Bananeira’ yielded a weighted mean 206Pb/238U date of 507.3 ± 1.3 Ma, mean square weighted deviation (MSWD) = 0.7 (511.7 ± 1.2 Ma ID-TIMS age; Horstwood et al. Reference Horstwood, Košler, Gehrels, Jackson, McLean, Paton, Pearson, Sircombe, Sylvester, Vermeesch and Bowring2016) and a weighted mean 208Pb/232Th date of 508.2 ± 1.4 Ma, MSWD = 2.3 (497.6 ± 1.6 Ma LA-ICP-MS age; Kylander-Clark et al. Reference Kylander-Clark, Hacker and Cottle2013). Seven repeat analyses of ‘Trebilcock’ yielded a weighted mean 206Pb/238U date of 278.4 ± 1.2 Ma (c. 279–285 Ma; Tomascak et al. Reference Tomascak, Krogstad and Walker1996) and a weighted mean 208Pb/232Th date of 263.3 ± 1.3 Ma, MSWD = 7.6 (263.7 ± 1.0 Ma LA-ICP-MS age; Kylander-Clark et al. Reference Kylander-Clark, Hacker and Cottle2013).
Isotopic data of monazite in metamorphic rocks were also normalized to ‘44069’, while ‘Bananeira’ and ‘FC-1’ were used as secondary reference materials. A total of 27 repeat analyses of ‘Bananeira’ yielded a weighted mean 206Pb/238U date of 506.2 ± 1.3 Ma, MSWD = 2.6 and a weighted mean 208Pb/232Th date of 490.9 ± 1.5 Ma, MSWD = 1.9. A total of 15 repeat analyses of ‘FC1’ yielded a weighted mean 206Pb/238U date of 56.4 ± 0.2 Ma, MSWD = 9.8 (55.7 ± 0.7 Ma ID-TIMS age; Horstwood et al. Reference Horstwood, Foster, Parrish, Noble and Nowell2003) and a weighted mean 208Pb/232Th date of 52.7 ± 0.2 Ma, MSWD = 1.3 (54.5 ± 0.2 Ma LA-ICP-MS age; Kylander-Clark et al. Reference Kylander-Clark, Hacker and Cottle2013). Trace elements were normalized to ‘Bananeira’ and, based on repeat analyses of multiple secondary reference materials, are accurate to within 5% (2SE) (Cottle et al. Reference Cottle, Larson and Yakymchuk2018) (online Supplementary Table S3, available at http://journals.cambridge.org/geo).
4. Petrography
Optical characterization and high-resolution X-ray elemental maps of thin-sections from metamorphic specimens were used for textural analysis, to estimate modal mineral proportions and to identify prospective mineral targets (e.g. monazite) for further analysis. Modal proportions of minerals in each metamorphic specimen are provided in online Supplementary Table S4 (available at http://journals.cambridge.org/geo). All mineral abbreviations used below follow those of Whitney & Evans (Reference Whitney and Evans2010).
4.a. Igneous specimens
Specimens GG10 and GG12 (Fig. 1d) are undeformed leucogranites. Both contain the mineral assemblage Qtz + Pl + Kfs + Ms + Tur + Mnz ± Grt ± Ap ± Rt with only minor differences in mineral size (fine and fine to medium, respectively). GG10 was collected at the contact with the metamorphic assemblage while GG12 was collected c. 350–400 m further into the pluton (Fig. 1d).
4.b. Metamorphic specimens
4.b.1. Specimen UM04
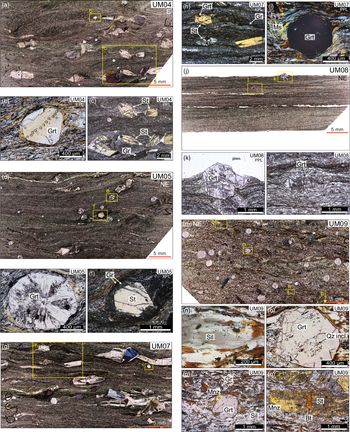
This specimen is a staurolite-bearing garnet–mica schist (Fig. 2a) with an observed assemblage of Qz + Pl + Bt + Ms + Grt + St + Gr with trace Ilm, Ap, Aln, Tur, Xtm, Zr and Chl. Fine-grained muscovite, graphite and biotite define the main foliation and, together with quartz and plagioclase, form the matrix mineralogy. Garnet porphyroblasts, up to 0.70 mm in diameter, are characterized by euhedral to subhedral forms, with rare inclusions of quartz (Fig. 2b). Staurolite occurs as large porphyroblasts up to 4.8 mm in size across the long axis and contain quartz and graphite inclusions in the outer rim. Most occurrences of staurolite are flanked by quartz-filled strain shadows and are partially fragmented and rotated (Fig. 2c). Recrystallized quartz and biotite fill the space between broken fragments of staurolite, with no evidence of staurolite overgrowth.
Thin-section photomicrographs of metamorphic specimens. Specimen orientation is indicated in the top corner. (a) Full thin-section photomicrograph of specimen UM04. (b) Subhedral garnet porphyroblast with few quartz inclusions. Laser ablation spots used for trace-element geochemistry are visible throughout the garnet. (c) Partially fragmented staurolite porphyroblasts. (d) Full thin-section photomicrograph of specimen UM05. (e) Garnet porphyroblast with sector zoning. (f) Staurolite porphyroblast with graphite inclusions in its rim. (g) Full thin-section photomicrograph of specimen UM07. (h) Main foliation defined mainly by graphite, biotite and quartz. Larger, staurolite porphyroblasts are aligned parallel to the foliation. (i) Garnet porphyroblast with muscovite in strain caps. (j) Full thin-section photomicrograph of specimen UM08. (k) Garnet porphyroblast showing weak sector zoning. (l) Garnet fragmented perpendicular to the main foliation. (m) Full thin-section photomicrograph of specimen UM09. (n) Clustered needles of sillimanite formed on top of quartz grains. (o) Garnet porphyroblast with quartz inclusions. (p) Garnet porphryoblast with monazite inclusion in its rim (yellow circle). (q) Biotite formed within the gaps of broken staurolite. Monazite is included in the rim of the staurolite (yellow circle). PPL – plane polarized light; XPL – crossed polarized light.

4.b.2. Specimen UM05
UM05 is a staurolite-bearing garnet–mica schist (Fig. 2d) with an observed assemblage of Qz + Pl + Bt + Ms + Grt + St + Gr with trace Ilm, Aln, Ap, Zr, Tur and Chl. Fine-grained muscovite, graphite and biotite define the main foliation and, in combination with quartz and plagioclase, are the major constituents of the matrix. Muscovite is most abundant in the pressure shadows of staurolite and garnet porphyroblasts. Garnet, up to c. 1.2 mm diameter, are subhedral to anhedral, commonly show sector zoning (Fig. 2e) and are locally intergrown with staurolite rims. Staurolite porphyroblasts occur as occasionally fragmented, euhedral crystals, with outer portions that contain inclusions of quartz and graphite (Fig. 2f).
4.b.3. Specimen UM07
UM07 is a staurolite-bearing garnet–mica schist (Fig. 2g) with an observed assemblage of Qz + Pl + Bt + Ms + Grt + St + Gr with trace Ilm, Ap, Tur and Chl. The main foliation is defined by aligned graphite, muscovite and biotite grains, which, along with quartz and plagioclase, comprise the matrix mineralogy (Fig. 2h). In addition to the matrix, muscovite is concentrated in strain caps around staurolite and garnet porphyroblasts (Fig. 2i). Garnet occurs as euhedral to subhedral crystals that vary in size with a maximum diameter of c. 1.6 mm. Larger garnet grains are commonly fractured and contain rare inclusions of quartz, whereas smaller grains are well preserved and mostly inclusion free (Fig. 2i). Staurolite porphyroblasts are euhedral with either blocky or elongate habit parallel to the foliation. Staurolite is locally fractured with no staurolite overgrowth present between fragments. Both quartz and graphite occur as inclusions in staurolite, as does garnet in the outer parts of some grains. In addition, quartz fringes form in the pressure shadows adjacent to the porphyroblasts.
4.b.4. Specimen UM08
UM08 is a garnet–mica schist (Fig. 2j) with an observed assemblage of Qz + Pl + Bt + Ms + Grt + Gr with trace Aln, Ilm, Ap, Tur, Xtm, Zr and Chl. As in the other specimens, aligned graphite, biotite and muscovite define the matrix foliation, which also includes quartz and plagioclase. Euhedral to subhedral garnet porphyroblasts, up to c. 1.6 mm in diameter, have weak sector zoning (Fig. 2k) with larger grains containing fractures at a high angle to the foliation (Fig. 2l).
4.b.5. Specimen UM09
UM09 is a staurolite- and sillimanite-bearing garnet–mica schist (Fig. 2m), with an observed assemblage of Qz + Pl + Bt + Ms + Grt + St + Sil + Gr and trace Ilm, Tur and Chl. Laths of biotite, graphite grains and rare muscovite define the main foliation and, together with quartz and plagioclase, comprise the matrix. The few muscovite grains that are present in the specimen occur as very small grains (< 100 μm on the longest axis). Sillimanite (fibrolite) occurs as clustered needles associated with quartz and biotite (Fig. 2n), and may reflect the metamorphic reaction Ms = Sil + Bt + Qtz (Foster, Reference Foster1991), consistent with the apparent disappearance of muscovite in the specimen.
As in the other specimens, garnet and staurolite in UM09 occur as porphyroblasts. Garnet porphyroblasts, up to c. 2.1 mm in diameter, are anhedral, commonly fractured and generally characterized by inclusion-rich mantles. Mantle inclusions consist of quartz and graphite (Fig. 2o), while rare monazite grains occur locally in rims (Fig. 2p). Staurolite porphyroblasts occur mainly as broken and fragmented grains, with biotite occasionally occurring between broken pieces (Fig. 2q).
5. Mineral geochemistry
Major- and trace-element geochemistry was obtained from various mineral phases in collected metamorphic specimens. The results presented below were used to investigate the variation both within grains and in different textural positions within the specimens.
5.a. Major-element geochemistry
Garnets in this study are dominantly almandine with end-member profiles for all five specimens recording the highest content of Sps and Grs in their cores, which gradually decreases outwards towards the rims (Fig. 3a–e). In contrast, Alm and Prp record the opposite trend with the lowest content in the cores that increases at the rims. Garnet compositional maps of Mn for all specimens outline this gradational zonation from core to rim (Fig. 3a–e).
Element distribution maps of Mn and garnet end-member profiles for five metamorphic specimens. Arrow indicates direction and profile of major- and/or trace-element analysis. Slight colour change along the profile line (e) is due to laser drilling prior to mapping. Alm – almandine; Grs – grossular; Prp – pyrope; Sps – spessartine.

Chemical composition of biotite is in the range: 0.12–0.23 apfu in Ti and 0.44–0.54 in XMg for UM04; 0.12–0.20 apfu in Ti and 0.44–0.47 in XMg for UM05; 0.14–0.25 apfu in Ti and 0.42–0.47 in XMg for UM07; 0.15–0.27 apfu in Ti and 0.40–0.43 in XMg for UM08; and 0.19–0.32 apfu in Ti and 0.32–0.38 in XMg for UM09.
All measured muscovite grains are from the matrix. Muscovite composition is in the range: 6.23–6.34 apfu in Si and 0.48–0.59 in XMg in UM04; 5.97–6.05 apfu in Si and 0.50–0.56 in XMg in UM05; 6.16–6.25 apfu in Si and 0.44–0.58 in XMg in UM07; 6.27–6.45 apfu in Si and 0.50–0.59 in XMg in UM08; and 5.93–5.95 apfu in Si and 0.36–0.41 in XMg in UM09.
Anorthite content in feldspars is in the range 0.26–0.37 in UM04, 0.25–0.35 in UM05, 0.29–0.32 in UM07, 0.30–0.33 in UM08 and 0.15–0.28 in UM09.
5.b. Garnet trace-element geochemistry
5.b.1. Specimen UM04
The highest Y concentration in UM04 is recorded in the garnet core, which decreases towards the rim (Fig. 4a). Gd/Yb records the opposite pattern, with the lowest ratio in the core reflecting the highest concentration of heavy REEs (HREEs) relative to middle REEs (MREEs) (Fig. 4a).
Compositional diagram of Y and Gd/Yb for garnet in metamorphic specimens. Vertical line represents 1 standard error.

A spider plot of REE normalized to chondrite values (from McDonough & Sun, Reference McDonough and Sun1995) shows the highest content of HREE in garnet cores, followed by mantle and rims with the lowest content (Fig. 5a). A negative Eu anomaly is recorded in all three garnet domains.
(a–e) Chondrite-normalized garnet trace-element data. (f–h) Chondrite-normalized monazite trace-element data. Chondrite values used are from McDonough & Sun (Reference McDonough and Sun1995).

5.b.2. Specimen UM05
Garnet in UM05 records a maximum Y concentration in the core, which decreases towards the mantle and increases slightly at the rim (Fig. 4b). Gd/Yb ratios record an inverse trend across the grain, increasing sharply away from the core before a slight decrease at the rim (Fig. 4b).
A spider plot of REE normalized to chondrite values shows that garnet cores have the highest HREE contents, followed by lower values from rim material and mantle analyses with the lowest HREE concentrations (Fig. 5b). Trace-element data from the core and mantle outline positive Eu anomalies, while rim data are associated with a negative anomaly.
5.b.3. Specimen UM07
The highest Y concentration measured in garnet in UM07 is recorded in the core and decreases sharply towards the mantle (Fig. 4c). A minor increase in Y is recorded only on one side of the garnet rim. The lowest Gd/Yb ratio is recorded in the core of the garnet, which increases sharply throughout the mantle and rim (Fig. 4c) with one side recording a decrease at the rim.
A spider diagram of chondrite-normalized REEs (Fig. 5c) shows the highest relative values of HREE in the core, while the mantle and rims show the lowest. A negative Eu anomaly is consistent throughout the garnet profile.
5.b.4. Specimen UM08
Garnet in UM08 records the lowest Y concentrations in its core, which increase outwards through the mantle to maximal concentrations in the rim regions (Fig. 4d). Gd/Yb ratios show the opposite pattern, with the highest ratios in garnet cores and lowest ratios at the rims (Fig. 4d).
Chondrite-normalized plots of garnet REE shows the highest content of HREE recorded in the rims, followed by mantle and rims that recorded lower content (Fig. 5d). All garnet domains show no distinctive Eu anomaly, except one mantle profile with a strong positive anomaly.
5.b.5. Specimen UM09
Garnet from specimen UM09 has the highest concentration of Y in its core, which decreases towards the mantle (Fig. 4e). On each side of the garnet in the mantle, there is a slight increase of Y, after which concentrations decrease again at the rim. Garnet core material has the lowest Gd/Yb ratios, which increase towards the mantle and then fluctuate with alternate increases and decreases across the mantle (Fig. 4e). Garnet rim material on one side shows the highest ratio of Gd/Yb recorded; however, the opposite side of the rim shows an asymmetric decrease in the ratio.
Similar to UM04 and UM07, chondrite-normalized REE plots show the highest relative values in HREE in the core, followed by mantle and rim material with the lowest values (Fig. 5e). A negative Eu anomaly is present across the whole garnet, but is less prominent at the rim.
6. Thermobarometry
Classical thermobarometry was used to obtain information on the pressure–temperature (P-T) conditions under which the metasedimentary rocks were formed. Two thermometers, Ti-in-biotite (calibration of Henry et al. Reference Henry, Guidotti and Thomson2005) and the garnet–biotite Fe-Mg exchange (calibration of Holdaway, Reference Holdaway2000), were used to estimate metamorphic temperature, while the garnet–biotite–muscovite–plagioclase (GBMP) barometer of Wu (Reference Wu2015) was used to estimate pressure.
6.a. Ti-in-biotite thermometry
All specimens examined are peraluminous graphitic metapelites that contain ilmenite or rutile, thereby satisfying the mineral assemblage requirements of the Ti-in-biotite thermometer (Henry et al. Reference Henry, Guidotti and Thomson2005). Biotite grains used for this thermometer were analysed from two different locations including the matrix and near garnet. Uncertainties associated with the resulting temperatures using this thermometer are estimated to be ± 24°C (Henry et al. Reference Henry, Guidotti and Thomson2005). Full results are presented in Figure 6a, b and online Supplementary Table S5 (available at http://journals.cambridge.org/geo).
(a) Ti-in-biotite (Henry et al. Reference Henry, Guidotti and Thomson2005) and garnet–biotite (Holdaway, Reference Holdaway2000) temperature estimates for biotite from matrix and near garnet. Vertical line represents the uncertainty. (b) Summary diagram of recorded peak temperatures. Specimens are positioned relative to their distance from the pluton.

The majority of Ti-in-biotite temperatures from specimen UM04 range from 567 to 608°C, with the highest temperatures recorded from the biotite positioned next to garnet rims. The maximum temperature from grains in the matrix is 599°C, within uncertainty of those near garnet (Fig. 6a). Temperatures obtained from both matrix and near-garnet biotite in UM05 cluster in the range of 540–578°C (Fig. 6a). In specimen UM07, most temperatures fall into the range of 515–587°C, with no consistent spatial association (Fig. 6a). Matrix and near-garnet biotite grains in specimen UM08 yield Ti-in-biotite temperatures in the range 540–592°C, with one matrix analysis yielding the highest temperature of 625°C (Fig. 6a). Finally, a majority of Ti-in-biotite temperatures for UM09 extend from 610 to 648°C for matrix and near-garnet grains; temperature maximums from grains near garnet and in the matrix are within uncertainty (Fig. 6a).
6.b. Garnet–biotite and garnet–biotite–muscovite–plagioclase thermobarometry
The garnet–biotite–muscovite–plagioclase (GBMP) barometer of Wu (Reference Wu2015) was used to obtain pressures for each specimen together with the garnet–biotite thermometry calibration of Holdaway (Reference Holdaway2000), model 6AV. Ferric iron content of biotite and garnet were assumed to be 11.6 mol% for biotite and 3 mol% for garnet, as recommended in Wu (Reference Wu2015). Absolute uncertainties for the garnet–biotite thermometer are estimated at ± 25°C (Holdaway, Reference Holdaway2000), while those for the GBMP barometer are ± 1.2 kbar (Wu, Reference Wu2015).
Grains were carefully selected, based on their textural relationship and location of data points within that grain, to obtain texturally constrained temperature and pressure estimates. For example, inner rim data from garnet grains were used for calculations, to avoid data points potentially affected by retrograde reactions with surrounding minerals (e.g. biotite reacting with garnet rims). Furthermore, biotite, muscovite and plagioclase grains near garnet were selected to satisfy the requirements of local equilibrium for this thermobarometer (Holdaway, Reference Holdaway2000; Wu, Reference Wu2015). As per Wu (Reference Wu2015), only plagioclase with XAn > 0.17 were used. Results for temperatures and pressures calculated using the garnet–biotite thermometer and GBMP barometer are presented in Figures 6a, b and 7 and online Supplementary Table S5, respectively.
Garnet–biotite–muscovite–plagioclase pressure estimates (Wu, Reference Wu2015). Specimens are positioned relative to their distance from the pluton. Vertical line represents the uncertainty. Dashed horizontal line represents the average pressure, while grey shaded area represents the uncertainty.

The thermobarometer yielded temperature and pressure estimates of 569°C and 4.4 kbar for UM04, 563°C and 5.2 kbar for UM05, 579°C and 5.2 kbar for UM07, 562°C and 5.0 kbar for UM08, and 615°C and 5.3 kbar for UM09.
7. Monazite geochronology and petrochronology
Monazite U–Th–Pb dates (geochronology) were obtained from two igneous specimens GG10 and GG12, while U–Th–Pb dates and trace-element data (petrochronology) were obtained from three metamorphic specimens: UM05, UM07 and UM09. Specimens UM04 and UM08 did not contain monazites that were large enough to target. Monazite grains selected for dating had sizes (long axis) in the range 17–50 µm, 17–80 µm and 15–80 µm for UM05, UM07 and UM09, respectively. Grains from all three specimens are elongate or lobate in shape and are often associated with quartz, mica or allanite locally (online Supplementary Figure S1, available at http://journals.cambridge.org/geo). All reported monazite dates are based on the 208Pb/232Th isotopic system, the preferred system for Cenozoic monazite, as it avoids potential problems associated with unsupported 206Pb from 230Th decay (Schärer, Reference Schärer1984).
All geochronological and petrochronological data for igneous and metamorphic specimens are presented in online Supplementary Table S3 and Figures 8 and 9. For igneous specimens, a weighted mean age was calculated when the data defined a single dominant age population. For more normally distributed data, the median provides a more meaningful estimate for the actual timing of pluton crystallization (Fig. 8a, b). For metamorphic specimens, all monazite dates, including those discarded from the final age interpretation, are presented on a U–Pb versus Th–Pb concordia diagram (Fig. 8c–e). Only monazite isotopic data from ablation spots completely within monazite grains (i.e. spots that did not ablate the matrix, as determined through post-laser analysis scanning electron microscopy) were used for interpretation of metamorphic ages (Fig. 8f–h). The age peaks for each metamorphic specimen were determined through Gaussian deconvolution as implemented in Isoplot v.4.15 (Ludwig, Reference Ludwig2012; Vermeesch, Reference Vermeesch2018).
(a, b) Monazite median and weighted mean age for two igneous specimens. (c–e) Monazite 208Pb/232Th v. 206Pb/238U concordia diagram for all monazite analysis in metamorphic rocks. (f–h) Gaussian deconvolution diagrams (Isoplot v.4.1; Ludwig, Reference Ludwig2012; Vermeesch, Reference Vermeesch2018) for analysis that ablated monazite exclusively.

(a) Gd/Yb v. age diagram for monazite. (b) Y v. age diagram for monazite. Horizontal lines represent 2 standard errors of each 208Pb/232Th date, while vertical lines represent 2 standard errors of each Y concentration.

7.a. Igneous specimens
A total of 40 spot analyses on monazite from specimen GG10 yield a weighted mean age of 21.3 Ma, with excess scatter (MSWD = 5.7). We therefore take a conservative approach and interpret the median age of 21.3 ± 0.5 Ma (Fig. 8a) to reflect the main crystallization of the pluton. Of the 40 spot analyses of monazite from specimen GG12, 31 combine to yield a coherent population at 21.3 ± 0.1 Ma (MSWD = 1.5) (Fig. 8b), which is taken to be representative of the main crystallization phase of this specimen.
7.b. Metamorphic specimens
7.b.1. Specimen UM05
A total of 11 spot analyses were carried out across six monazite grains in specimen UM05 (Fig. 8c), of which five spots in three grains ablated monazite exclusively. All monazite grains in this specimen were located in the matrix. Monazite dates from UM05 range from 22.2 ± 0.8 Ma to 19.2 ± 0.6 Ma, with a main peak at c. 19.4 Ma and secondary peak at c. 21.8 Ma (Fig. 8f). Neither Gd/Yb ratios (Fig. 9a) nor Y concentrations (Fig. 9b) show a significant correlation with date. Moreover, chondrite-normalized REE values of monazite show a relatively invariant pattern of enriched LREE and less enrichment towards HREE, regardless of date (Fig. 5f).
7.b.2. Specimen UM07
In specimen UM07, 105 spot analyses were performed on 15 monazite grains (Fig. 8d), of which 88 spot analyses from 13 grains ablated monazite exclusively. All monazite grains in this specimen occurred in the matrix. Monazite dates range from 21.4 ± 0.6 Ma to 17.7 ± 0.9 Ma. The dates form a unimodal distribution with an age peak at c. 19.8 Ma (Fig. 8g). Monazite Gd/Yb ratios (Fig. 9a) and Y concentrations (Fig. 9b) do not appear to systematically change with date. As in UM05, chondrite-normalized REE show little variation across the data. All analyses record significant enrichment in LREE with decreasing enrichment in MREE and HREE, with no correlation to date (Fig. 5g).
7.b.3. Specimen UM09
In specimen UM09, 58 monazite analyses were performed on 13 monazite grains (Fig. 8e), with one monazite grain located in the rim of garnet porphyroblast and one monazite grain in the rim of staurolite. Out of 58 analyses, only 38 spots from 11 monazite grains ablated monazite exclusively. Dates from monazites located in matrix range from 24.0 ± 1.0 Ma to 19.6 ± 0.8 Ma. Six monazite analyses from within garnet (Fig. 2p) range from 22.0 ± 0.8 Ma to 20.6 ± 0.7 Ma, while a single monazite analysis from within staurolite (Fig. 2q) yielded a 22.6 ± 0.7 Ma date. The age peak defined by the monazite dates is c. 21.7 Ma (Fig. 8h). As for the other specimens described, the Gd/Yb ratios (Fig. 9a) and Y concentrations (Fig. 9b) recorded in monazite from UM09 do not vary with date and do not show significant variation on chondrite-normalized REE plots (Fig. 5h).
8. Interpretation
8.a. Textural relationships and mineral chemistry
All metamorphic specimens examined in this study have a similar mineral assemblage, but record key differences in chemical compositions that help distinguish the metamorphic conditions at which they formed. With the exception of UM08, all metamorphic specimens contain staurolite. The absence of staurolite in UM08 may be linked to its bulk composition, which has lower Al compared to the other samples (online Supplementary Table S6, available at http://journals.cambridge.org/geo). Specimen UM09, collected closest to the contact with the Mugu granite, is the only specimen that contains sillimanite and has the highest percentage of staurolite (16%). Moreover, while the rest of the specimens contain 14–26% muscovite, UM09 contains < 1% muscovite, interpreted to be relics largely consumed during the production of sillimanite (Foster, Reference Foster1991). All these observations are consistent with UM09 recording higher-grade metamorphic conditions than the other specimens in the area located further away from the pluton.
Garnet porphyroblasts in UM05 and UM08 contain quartz and graphite inclusions that define sector zoning. Textural sector zoning typically occurs in pelitic rocks abundant with graphite (Andersen, Reference Andersen1984; Burton, Reference Burton1986; Rice, Reference Rice1987, Reference Rice1993; Rice & Mitchell, Reference Rice and Mitchell1991), and is often interpreted to reflect rapid growth (Andersen, Reference Andersen1984).
Garnet major-element profiles show bell-shaped patterns indicative of prograde growth zonation in all five specimens, with Sps and Grs enrichment in the cores while Alm and Prp show the opposite pattern (Hollister, Reference Hollister1966). None of the garnets analysed contain evidence of retrograde diffusion at the rims, such as a marked increase in Grs and Sps or a decrease in Alm and Prp (Tracy et al. Reference Tracy, Robinson and Thompson1976; Kohn & Spear, Reference Kohn and Spear2000).
Peak temperatures are estimated from the highest-obtained temperatures calculated in each specimen. Temperatures estimated from Ti-in-biotite and garnet–biotite thermometers are highest in the specimen closest to the pluton (Fig. 6b).
Pressures obtained from the garnet–biotite–muscovite–plagioclase barometer are within uncertainty across all specimens (Fig. 7). When averaged, they define a pressure of 5.0 ± 0.5 kbar (Fig. 7) which corresponds to a depth of 18 ± 2 km, assuming an average crustal density of 2.83 g cm–3.
8.b. Trace-element partitioning
Trace-element profiles of garnet from four specimens (UM04, UM05, UM07 and UM09) show high Y concentrations in the cores (Fig. 4a–c, e), which generally decrease towards the mantle and rim. This observation is consistent with Rayleigh fractionation of garnet during prograde growth (Otamendi et al. Reference Otamendi, de La Rosa, Douce and Castro2002). The increase in Y concentration in the rim of UM05 and, to a lesser degree in the rim of UM07 and the mantle of UM09, may represent breakdown of another Y-bearing mineral, such xenotime or allanite during rim growth (Pyle & Spear, Reference Pyle and Spear1999).
Completely different trace-element behaviour is recorded in garnet from specimen UM08 (Fig. 4d). An increase in Y concentration towards the garnet rims may indicate breakdown of a Y + HREE-bearing mineral such as xenotime. If xenotime provided the Y + HREE that was incorporated into the garnet, it would have released P into the system. This P was likely partitioned into apatite and allanite, rather than monazite (Spear & Pyle, Reference Spear and Pyle2002, Reference Spear and Pyle2010; Wing et al. Reference Wing, Ferry and Harrison2003; Shrestha et al. Reference Shrestha, Larson, Duesterhoeft, Soret and Cottle2019), favoured by the high CaO content of the specimen. This inference is consistent with the lack of xenotime and sparse, small monazite grains observed in UM08 (online Supplementary Figure S2, available at http://journals.cambridge.org/geo).
Specimen UM05 is the only specimen to record a distinctive positive Eu anomaly in the cores and mantles of garnet, while specimen UM08 yielded a single spot with a positive anomaly (Fig. 5b, d). Such a positive anomaly may indicate growth of garnet during the breakdown of the Eu-bearing phase (e.g. plagioclase, apatite), most probably by the substitution of Eu2+ for Ca2+ (Taylor & McLennan, Reference Taylor, McLennan, Gschneider and Eyring1988).
8.c. Timing of metamorphism
The specimens of the Mugu pluton, UM10 and UM12, yield indistinguishable crystallization ages of 21.3 ± 0.5 Ma and 21.3 ± 0.1 Ma, respectively. Monazite from the metamorphic specimen closest to the exposure of the pluton UM09 define an age peak at c. 21.7 Ma, while specimens further away returned peaks at c. 19.8 Ma (UM07) and c. 19.4 Ma (UM05). As these rocks do not show evidence of partial melting, the rims of garnet and/or staurolite should record peak/near-peak temperature metamorphic conditions. Dates from monazite included in garnet and staurolite rims in UM09 range from 22.6 ± 0.7 Ma to 20.6 ± 0.7 Ma, which overlap with the majority of monazite analyses from the matrix, consistent with coeval growth of matrix monazite and porphyroblasts. For that reason, we interpret the age peak at c. 21.7 Ma as the age of peak metamorphism in specimen UM09. Specimens UM07 and UM05 do not contain any monazite inclusions in garnet and/or staurolite. However, in the absence of any evidence of partial melting, we interpret that the monazite grains in these specimens grew across prograde and peak metamorphic (temperature) conditions (Pyle & Spear, Reference Pyle and Spear2003; Kohn & Malloy, Reference Kohn and Malloy2004; Buick et al. Reference Buick, Hermann, Williams, Gibson and Rubatto2006) and that the age peaks in each represent the timing of peak metamorphism in the specimens.
9. Discussion
Metamorphism in different parts of the Himalaya has been linked to various heat sources. In addition to primary crustal geothermal heat controlled by radioactive decay (e.g. Jamieson et al. Reference Jamieson, Beaumont, Medvedev and Nguyen2004), other potential heat sources include heating associated with shear zones (e.g. Hubbard, Reference Hubbard1996), the post-thrusting relaxation of disturbed geotherms (e.g. Groppo et al. Reference Groppo, Rolfo and Mosca2013) and contact/conductive heating linked primarily to the intrusion of igneous bodies (e.g. Kawakami et al. Reference Kawakami, Aoya, Wallis, Lee, Terada, Wang and Heizler2007, Mahéo et al. Reference Mahéo, Leloup, Valli, Lacassin, Arnaud, Paquette, Fernandez, Haibing, Farley and Tapponnier2007, Aikman et al. Reference Aikman, Harrison and Lin2008).
Metamorphism of the rocks examined in this study, enhanced through conductive heat transfer away from the Mugu pluton, is broadly consistent with: (1) the interpreted decrease in metamorphic grade away from the pluton observed in the field, from medium- to fine-grained schist with garnet and staurolite porphyroblasts to fine-grained phyllite; (2) differences in mineral assemblages across the specimens with proximity to the pluton (e.g. appearance of sillimanite, disappearance of muscovite); (3) invariant pressure estimates; and (4) the results of Ti-in-biotite and garnet–biotite thermometry, in which the specimen closest to the exposure of the pluton records the highest temperature. In addition, monazite dates from metamorphic specimens examined in this study overlap with both those from the Mugu pluton presented here (Fig. 10) and those previously reported (c. 26.2–17.6 Ma; Harrison et al. Reference Harrison, Grove, Mckeegan, Coath, Lovera and Fort1999; Hurtado, 2002).
Age probability plot for igneous and metamorphic specimens.

The main age peaks from the metamorphic specimens are younger with increased distance from the pluton (Fig. 10), which we interpret to reflect monazite growth associated with time-integrated heat transfer away from the pluton. The general lack of monazite in specimen UM04 and the few, small grains present in UM05, the two specimens interpreted to be furthest from the pluton, may also reflect differential heating away from the Mugu pluton in which the thermal pulse experienced may not have provided enough time to nucleate and grow much monazite.
A simple thermal diffusion model for sheet-like intrusions (Jaeger, Reference Jaeger1964, Reference Jaeger, Hess and Poldervaart1968) was constructed to compare predicted temperatures in specimens with respect to time and position relative to the pluton (see online Supplementary Table S7 and Dataset S1, available at http://journals.cambridge.org/geo, for additional parameters). The Mugu pluton is elongate in shape and covers 1600 km2 in the Mustang–Dolpo area (Le Fort & France-Lanord, Reference Le Fort and France-Lanord1995); the present model uses a radius of 10 km to approximate the local width of the pluton in the study area (Fig. 1c; Le Fort & France-Lanord, Reference Le Fort and France-Lanord1995). While the three-dimensional shape of the pluton is not known, the modeling results for long cylindrical plutons are similar to those for sheet-like intrusions (Jaeger, Reference Jaeger1964).
In order to reproduce the temperature estimates recorded by classical thermometry in specimens UM05 and UM07, this model requires that the Mustang region had a geothermal gradient of c. 25°C km–1 (background heat of c. 450°C) at the time of intrusion of the Mugu pluton (Fig. 11, see Jaeger, Reference Jaeger1964, Reference Jaeger, Hess and Poldervaart1968). While the model matches well with the temperatures recorded by UM05 and UM07 (Fig. 11, online Supplementary Table S7), it underestimates the temperature recorded in UM09, the specimen closest to the pluton. Problems with temperatures estimated at the contact are a known issue for this type of modelling (Jaeger, Reference Jaeger1964; Yardley, Reference Yardley1989); as such, this underestimation in temperature is not considered significant.
Thermal diffusion model of a sheet-like intrusion based on Jaeger (Reference Jaeger1964, Reference Jaeger, Hess and Poldervaart1968). Temperature estimates are provided in online Supplementary Table S7.

If the time when pluton intrudes is set to 0, conductive modelling predicts that specimen UM09 would reach peak temperature (peak metamorphism) after c. 100–500 ka. Specimens further away, UM07 and UM05, would reach peak temperature after c. 1 Ma, while rocks at 1500 m from the pluton would reach peak temperature at c. 1–2 Ma (Fig. 11; online Supplementary Table S7). The spatially distinct timing of peak temperature with distance from the contact in the model is consistent with younger monazite age peaks further away from the Mugu pluton. These results further confirm that conductive heating from the pluton provided the additional heat required to metamorphose the studied rocks to their peak temperature conditions. Moreover, the results outline the potentially important contribution that pluton emplacement can have in developing the metamorphic assemblages found nearby, which should be acknowledged.
Microtextural observations within the metapelites, such as the rotation and fragmentation of porphyroblasts, indicate that deformation in these rocks occurred after peak metamorphism, c. 19.4 Ma, for the youngest specimen. This deformation is interpreted to be related to the E–W extension across the adjacent Thakkhola graben (see Larson et al. Reference Larson, Kellet, Cottle, Camacho and Brubacher2019), which initiated as early as c. 17 Ma (Guillot et al. Reference Guillot, Cosca, Allemand and Le Fort1999; Hurtado, 2002; Larson et al. Reference Larson, Kellet, Cottle, Camacho and Brubacher2019). However, the igneous specimens do not record extension-related deformation, which may reflect the strong rheological contrast between the graphite-rich pelitic schists and the leucogranite (e.g. Treagus & Treagus, Reference Treagus and Treagus2002).
Deformations recorded in the metamorphic rocks are unlikely to be related to movement on the STDS as there is no such fault documented in the area (Reference Guillot, Pêcher and Le FortGuillot et al. 1995b; Hurtado, 2002; Larson et al. Reference Larson, Kellet, Cottle, Camacho and Brubacher2019) and the closest documented exposure is nearly 50 km south of the present study area in the Annapurna region. There, Godin et al. (Reference Godin, Parrish, Brown and Hodges2001) argue that final movement on the STDS occurred at c. 22.5 Ma based on the ages of weakly deformed dykes that intrude across the shear zone.
Pressure estimates from the contact metamorphic assemblages that formed around leucogranite bodies can be used to gain a rough estimate of the depth of emplacement. In combination with the age of the intrusion, this can be used to outline the thickness of the TSS during that time. The results of the present study indicate that the TSS was at least 18 ± 2 km thick at the time of emplacement of the Mugu granite. This is consistent with a previous estimate of c. 17 km based on restored sections in the hanging wall of the Annapurna detachment immediately south of the Upper Mustang region (Kellett & Godin, Reference Kellett and Godin2009).
9.a. Regional comparisons
The P-T estimates from this study are similar to those previously reported by Reference Guillot, Pêcher and Le FortGuillot et al. (1995b), who also interpreted the metamorphic rocks in the vicinity of the Mugu pluton as reflecting contact metamorphism. While rocks in the Mugu aureole have characteristics consistent with contact metamorphism, they also require a minor component of regional background heating as discussed above. These findings contrast with the interpretations of Hurtado (2002), who suggested that the same rocks reflect entirely regional metamorphism structurally below the STDS. It is possible, however, that high-grade regional metamorphism is exposed further north in the vicinity of Mustang pluton where Le Fort & France-Lanord (Reference Le Fort and France-Lanord1995) reported orthogneiss and local anatexis.
Metamorphic rocks around the Manaslu granite, c. 90 km SE of the current study area, that have a similar assemblage to those studied here also have different interpretations. Based on the pressure–temperature conditions of c. 550°C and c. 5.5 kbar near the base of the pluton, Guillot et al. (Reference Guillot, Hodges, Fort and Pêcher1994, Reference Guillot, Le Fort, Pêcher, Barman and Aprahamian1995a, b) interpreted those rocks as contact metamorphic rocks, while Searle & Godin (Reference Searle and Godin2003) interpreted metamorphic rocks in the vicinity of the pluton as a part of the exhumed mid-crust in the footwall of the STDS and the product of regional metamorphism, much like the pluton itself (Cottle et al. Reference Cottle, Lederer and Larson2019).
Contact metamorphic rocks surrounding granitic intrusions have also been reported from several locations in southern Tibet, both within the TSS and in exhumed former mid-crustal rocks exposed in structural windows, commonly referred to as the North Himalayan domes. Some of these domes and/or plutonic bodies include, from east to west, the c. 44 Ma Dala granitoid (Aikman et al. Reference Aikman, Harrison and Lin2008), the c. 44 Ma and c. 28 Ma Ramba leucogranite in the Ramba dome (Guo et al. Reference Guo, Zhang and Zhang2008, Liu et al. Reference Liu, Wu, Ji, Wang and Liu2014), the c. 14.5–14 Ma Kouwu leucogranite in the Mabja dome (Lee et al. Reference Lee, Hacker and Wang2004), the c. 22 Ma Kung Co granite of the Kung Co half-graben (Mahéo et al. Reference Mahéo, Leloup, Valli, Lacassin, Arnaud, Paquette, Fernandez, Haibing, Farley and Tapponnier2007), the c. 22–16 Ma Paiku and c. 18–15.5 Ma Cuobu leucogranites in the Malashan dome (Aoya et al. Reference Aoya, Wallis, Terada, Lee, Kawakami, Wang and Heizler2005, Kawakami et al. Reference Kawakami, Aoya, Wallis, Lee, Terada, Wang and Heizler2007), and the High Himalayan c. 25–23 Ma Bura Buri leucogranite (Carosi et al. Reference Carosi, Montomoli, Rubatto and Visonà2013) (Fig. 1d). Contact metamorphism reported in the studies referenced above occurs either structurally above STDS-related faults and/or shear zones, or post-dates movement on such structures.
The contact metamorphic rocks associated with igneous intrusions typically consist of metasedimentary schist with similar garnet ± staurolite ± andalusite assemblages to those investigated here, with overlapping temperatures of c. 520–575°C and slightly lower pressures of c. 3.0–4.1 kbar (e.g. Kawakami et al. Reference Kawakami, Aoya, Wallis, Lee, Terada, Wang and Heizler2007; Mahéo et al. Reference Mahéo, Leloup, Valli, Lacassin, Arnaud, Paquette, Fernandez, Haibing, Farley and Tapponnier2007; Aikman et al. Reference Aikman, Harrison and Lin2008). The higher pressure in the present study area, compared with the previously mentioned studies, probably favoured sillimanite over andalusite in Upper Mustang. Similar mineral textures, such as garnet sector zonation, have also been reported in contact metamorphic rocks in the Malashan dome (Kawakami et al. Reference Kawakami, Aoya, Wallis, Lee, Terada, Wang and Heizler2007) and the Kung Co granite (Mahéo et al. Reference Mahéo, Leloup, Valli, Lacassin, Arnaud, Paquette, Fernandez, Haibing, Farley and Tapponnier2007).
The identification and investigation of contact metamorphic rocks in the TSS can help to improve our understanding of the internal structure of the Himalaya through time. The present geometry of orogen-scale structures such as the STDS at depth is largely based on geophysical data (e.g. Nelson et al. Reference Nelson, Zhao, Brown, Kuo, Che, Liu, Klemperer, Makovsky, Meissner, Mechie, Kind, Wenzel, Ni, Nábělek, Leshou, Tan, Wei, Jones, Brooker, Kidd, Hauck, Alsdorf, Cogan, Wu, Sandvol and Edwards1996). However, there is little information about how that geometry may have changed through time. Moreover, the past orientation of the STDS is a first-order difference between various orogenic models (see summary in Webb et al. Reference Webb, Schmitt, He and Weigand2011).
Study of contact metamorphism within the TSS structurally above the STDS may allow for quantification of minimum upper crustal thicknesses through time across the orogen. As an example, if we take the presently available crustal thickness data as translated from calculated pressures, the minimum thickness of the TSS above the STDS is generally greater in the south than it is further north. While it is acknowledged that the thicknesses are minimums, these type of data, paired with further information about proximity to the STDS, may provide critical insights into the geometry of the structures and help inform orogen-scale kinematic reconstructions.
10. Conclusions
The results obtained from this study provide new, robust information on the timing of the crystallization of the Mugu pluton and the timing of contact metamorphism in the surrounding metasedimentary rocks. The monazite crystallization age of the Mugu granite exposed in the study area is c. 21.3 Ma, while the dominant monazite age peaks obtained from metamorphic rocks in the area are c. 21.7, 19.8 and 19.4 Ma, decreasing with increasing distance from the pluton. Field observations of apparent decreasing metamorphic grade away from the pluton, changes in mineral assemblage, a noted decrease in metamorphic temperatures further away from the pluton, and constant pressure estimates are all consistent with the interpretation of heat diffusion into surrounding rocks during emplacement of the Mugu pluton driving metamorphism. Simple thermal modelling confirms that the Mugu pluton provided the additional heat required (above background) for time-integrated contact metamorphism and monazite growth away from the leucogranite.
Supplementary material
To view supplementary material for this article, please visit https://doi.org/10.1017/S0016756820000229
Acknowledgments
This research was funded by an NSERC Discovery Grant (RGPIN-2016-06736) and Accelerator Supplement (RGPAS 492956-2016), and a Canadian Foundation for Innovation John Evans Leadership Award (31301) to K Larson. Further financial support was provided by a Charles Fipke Scholar Award and Geological Society of America Research Grant to I Lihter. D Arkinstall and M Button are thanked for analytical support in the Fipke Laboratory for Trace Element Research at the University of British Columbia; R Graziani is thanked for his suggestions on the figures and interpretation. P Tamang and T Tamang provided logistical expertise during the fieldwork. Finally, the Department of Geology at Tri-Chandra College, Tribhuvan University and the Department of Mines and Geology of Nepal enabled and supported our fieldwork in Nepal. This manuscript was significantly improved by the careful, constructive reviews of C Warren, Z Braden two anonymous reviewers, and suggestions from the editor K Goodenough.
Conflict of Interest
None.