I. INTRODUCTION
Recently, sulfate radical (SO4−•)-based advanced oxidation processes (SR-AOPs) have attracted more and more attention because SO4−• has a higher redox potential (E 0(SO4−•/SO42−) = 2.5–3.1 V NHE) than hydroxyl radicals (•OH, E 0(•OH/H2O) = 2.2–2.7 V NHE) and can react with most organic contaminants.Reference Feng, Wu, Deng, Zhang and Shih1 Moreover, SO4−• can sustain high activity in a neutral or basic aqueous medium and shows better adjustability to a broad pH range, compared with •OH.Reference Yang, Choi, Chen and Dionysiou2
Most commonly, SO4−• can be generated from persulfate (PS, S2O82−) activation. PS is relatively cheap, highly soluble in water, and stable at ambient temperatures.Reference Avetta, Pensato, Minella, Malandrino, Maurino, Minero, Hanna and Vione3 Production uses of SO4−• in the current literature include transition metals,Reference Rastogi, Al-Abed and Dionysiou4 photolysis,Reference Malato, Blanco, Richter, Braun and Maldonado5 pyrolysis,Reference Liang, Bruell, Marley and Sperry6 and microwave-assisted processes.Reference Lee, Lo, Chiueh, Liou and Chen7 Among those, the transition metals that have been a research hotspot, such as Fe2+, Co2+, Mn2+, Ru3+, and Ag+,Reference Anipsitakis, Dionysiou and Gonzalez8 can induce PS to produce SO4−• in homogeneous and heterogeneous systems. Of these transition metals for the activation of PS, iron (often as dissolved Fe2+) is the most commonly used metallic element because of its nontoxicity, abundance, and effectiveness.Reference Rodriguez, Vasquez, Costa, Romero and Santos9 However, in a homogeneous process, poor reusability and the precipitation of ferric iron easily lead to secondary pollution.Reference Gao, Zhang, Li, Liu, Yao, Li and Zhang10 Consequently, it is desirable to develop a heterogeneous catalyst with good separation, to produce SO4−• over a broader pH range.
Recent studies have reported iron-based catalyst heterogeneous Fenton-like systems, for instance, AgBr/Ag3PO4,Reference Song, Li and Zhang11 ZnFe2O4,Reference Cai, Liu, Zhang, Zheng and Zhang12 Bi2WO6/Fe3O4,Reference Liu, Guo, Zhang and Tang13 MIL-53(Fe),Reference Gao, Li, Li, Yao and Zhang14 clay/iron-based catalyst,Reference Gao, Zhang, Li, Liu, Yao, Li and Zhang10 and monoclinic BiVO4,Reference Liu, Zhang, Guo, Cheng, Liu and Tang15 which exhibit a high photo-Fenton activity when used separately in heterogeneous Fenton catalytic systems. One reason is that the addition of an oxidant such as PS can act as an electron acceptor in the photocatalytic reaction and reduce charge carrier recombination.Reference Gao, Li, Li, Yao and Zhang14 The surface of a photocatalyst can trap photogenerated electrons to convert Fe(III) into Fe(II), which accelerates the reusability of Fe(III)/Fe(II) and the production of SO4−•.Reference Hu, Tian and Jiang16
In recent years, FeOCl, as an emerging Fenton-like catalyst, has been studied in detail.Reference Yang, Xu, Xu and Han17,Reference Zhang, Jiao, Xia, Liu, Pang, Zhao and Chen18 The generation rate of •OH over FeOCl was higher by about 3–4 orders of magnitude than other Fenton-like systems.Reference Yang, Xu, Xu and Han17 An explanation could be the linear configuration of Fe species ([Fe–O–Fe]) in FeOCl.Reference Yang, Xu, Xu and Han17 Compared with H2O2, PS possesses a peroxy-group, which is similar to that in hydrogen peroxide, but higher in activity and stability. Therefore, FeOCl can react in a similar way with PS to generate SO4−• radicals. There is no relevant research about the photocatalytic activity of FeOCl. Because of its short band gap,Reference Zhang, Jiao, Xia, Liu, Pang, Zhao and Chen18 it is expected that the combination of PS with the FeOCl catalyst under visible light irradiation could enhance the degradation of contaminants.
Based on the literature mentioned above, the catalytic activation of iron oxychloride (FeOCl) with PS under visible light in the degradation of rhodamine B (RhB) was investigated. A series of methods were used to characterize the structure and properties of FeOCl. The reusability and stability of the photocatalyst were verified, for the requirement of reusability. In addition, quenching experiments and electron paramagnetic resonance (EPR) were used to investigate the reactive radicals involved in the photocatalytic process. Finally, the effects of initial pH, concentration of PS, and catalyst dosage on the photocatalytic degradation of RhB were investigated.
II. EXPERIMENTAL
A. Chemicals
Sodium PS, anhydrous ferric chloride (FeCl3, >97%), acetone, RhB, sodium hydroxide, hydrochloric acid, ethyl alcohol absolute, ethylene diamine tetraacetic acid disodium, para-benzoquinone, and tert-butyl alcohol were obtained from Sinopharm Chemical Reagent Co. (Shanghai, China). The spin trapping agent, 5,5-dimethyl-1-pyrroline N-oxide (DMPO), was purchased from Aladdin, Chemistry Co., Ltd. (Shanghai, China). All chemicals were of analytical grade and used as received without further purification. Aqueous solutions were prepared with ultrapure water (18.26 MΩ/cm).
B. Preparation of FeOCl
FeOCl was synthesized via a partial pyrolysis method. In this paper, FeCl3 was chosen as precursors to prepare FeOCl. It is generally accepted that FeOCl can be finally formed by hydrogen chloride elimination and structural rearrangement during the reaction between anhydrous ferric chloride and ferric chloride. Typically anhydrous ferric chloride was placed in an agate mortar and ground into powder (about 30 mesh) in air (the humidity was less than 40%) about 30 min. Then, the powder was spread on the bottom of porcelain crucibles (maintained the thickness no more than 0.3 cm), and calcined at a certain temperature in a muffle furnace. After the heat treatment, the products were collected to be washed with acetone several times, and then dried in a vacuum drying oven (60 °C) overnight.
C. Characterization of FeOCl
The crystalline phase of the prepared catalyst was analyzed by the X-ray diffraction (XRD) pattern (Bruker D8 ADVANCE, Bruker Beijing Scientific Technology Co., Ltd., Beijing, China) with the assistance of MDI Jade software (6.0 version; Materials Data, Inc., Livermore, California). The morphology of samples was observed with a QUANTA250 scanning electron microscope (SEM). The field-emission transmission electron microscope images were acquired using a Tecnai G2 F20 instrument (FEI, Hillsboro, Oregon). Diffuse reflectance UV-vis spectra were collected using a Hitachi U4100 UV spectrometer (Hitachi, Ltd., Tokyo, Japan), the powdery sample was loaded into a quartz cell, and all tests were carried out in ambient conditions with referring to the BaSO4 crystal. Surface electronic states were analyzed via X-ray photoelectron spectroscopy (XPS; Thermo ESCALAB 250XI; Thermo Fisher Scientific Inc., Waltham, Massachusetts). The photoluminescence spectra were obtained on a FLS980 Series of Fluorescence spectrometers (Acculogic Inc., Lake Forest, California) at an excitation wave length of 467 nm N2 adsorption and desorption isotherms were obtained on a surface area & pore size analyzer (Micromeritics ASAP 2460, Micromeritics Instrument Corp., Norcross, Georgia), and the pore size was determined by the Barret–Joyner–Hallender (BJH) method. EPR spectra of active radicals trapped by DMPO were recorded on a BRUKER EPRA300 spectrometer (Bruker Beijing Scientific Technology Co., Ltd., Beijing, China) at room temperature.
D. Photocatalytic activity evaluation and analyses
The photocatalytic activities of FeOCl were estimated by the degradation rate of RhB under a Vis-LED photoreactor consisting of quartz glass beaker, LED light source, low temperature cooling circulating pump, and magnetic stirrer. The irradiation intensity as measured by using a digital lux meter was 140 mW/cm2. In addition, the photoreactor was covered by aluminized paper to minimize the penetration of ambient light and the evaporation of water. In the typical photocatalytic experiment, a 100 mL intermixture containing RhB and a certain amount of FeOCl were placed into the quartz glass beaker and then magnetically stirred at a speed of 300 rpm. Before irradiation, the suspension was continuously stirred for 30 min in the dark to make sure that the absorption–desorption equilibrium had been achieved. After that a desired amount of PS was placed into the suspension with the LED lamps being switched on simultaneously. At designed time intervals, aliquots of solution were centrifuged at 12,000 rpm for 5 min and analyzed with a UV-Vis spectrophotometer at 554 nm.
III. RESULTS AND DISCUSSION
A. Characterization
The XRD pattern of the FeOCl catalyst, calcined at various temperatures, is shown in Fig. S1, referring to JCPDS cards (No. 24-1005 and 33-0664). As shown in Fig. S1, the only crystal product of FeCl3 decomposition at temperatures of 200 and 250 °C is FeOCl, and the degree of crystallinity at 250 °C is significantly higher than that at 200 °C. The lattice constants are a = 3.77596 Å, b = 7.90991 Å, and c = 3.30133 Å, which agree with a previous report.Reference Wu, DeGroot, Marcy, Schindler, Kannewurf, Bakas, Papaefthymiou, Hirpo, Yesinowski, Liu and Kanatzidis19 It can be seen from the appearance of appreciable sharp diffraction peaks that as-prepared FeOCl has good crystallinity. No other characteristic peaks are found, implying the high purity of the sample. However, as the calcined temperature continued to rise, crystalline α-Fe2O3 is detectable. Especially when the calcined temperature increases to 350 °C, α-Fe2O3 is the only component of the as-prepared sample.
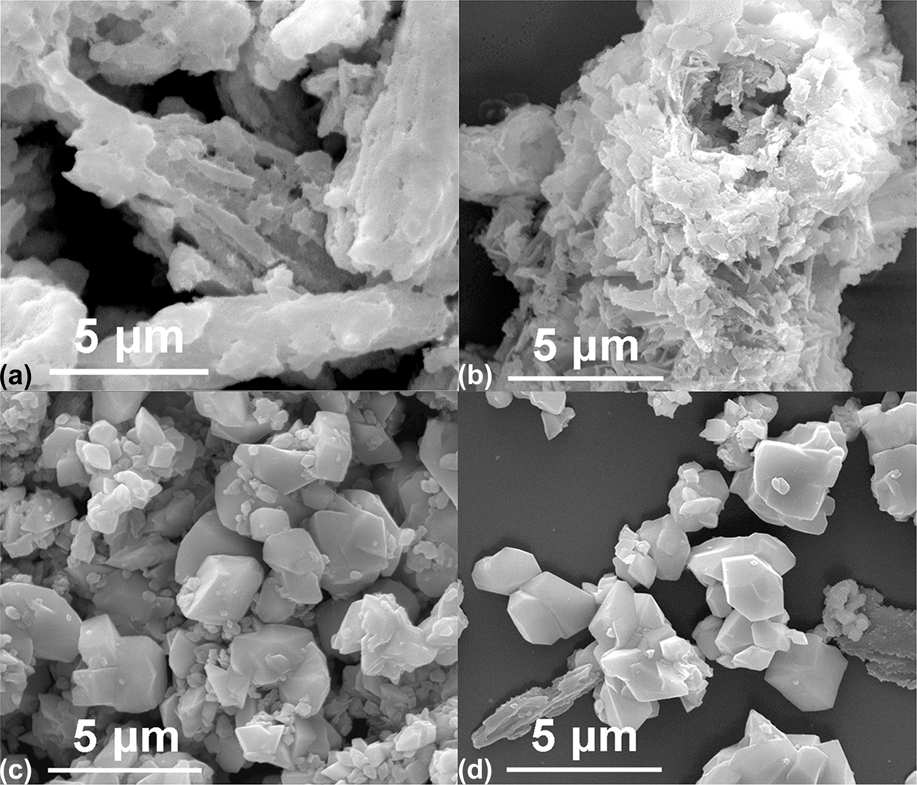
The morphology of FeOCl was visualized by SEM. As shown in Fig. 1(a), when the preparation temperature is 200 °C, the FeOCl crystal has an amorphous bulk with a rough surface. FeOCl prepared at 250 °C [Fig. 1(b)] is composed of a large number of 2D nanosheets, some of which can self-assemble to form a three-dimensional flower-like structure. Compared to the simply stacked nanosheets, the as-prepared FeOCl has a larger specific surface area, which can improve its photocatalytic activity.Reference Vu and Marbán20 When the calcined temperature increases to 300 °C [Fig. 1(c)], the thickness and packing density of nanosheets increase. As the calcined temperature continues to rise [Fig. 1(d)], the nanoflake structure of the FeOCl crystal is destroyed to form micron size cubics, which are assigned to be α-Fe2O3. This observation is confirmed by the XRD results.
SEM patterns of FeOCl catalysts calcined at various temperatures by partial pyrolysis method: (a) 200 °C; (b) 250 °C; (c) 300 °C; (d) 350 °C.

Considering the purity and stability of the FeOCl catalyst, the synthesis temperature for further study was set to 250 °C.
The structure of FeOCl was further examined using FE-TEM. A flat-like morphology can be observed in the TEM image [Fig. S2(a)] for all particles, which agrees with the SEM patterns. A typical high-resolution TEM image [Fig. S2(b)] of the edges in the nanosheet shows clear 2D ordered lattice fringes, in which the d-spacing is 0.2532 nm for adjacent planes, corresponding to the (021) facets of FeOCl (JCPDS No. 24-1005).
To specify the chemical states of surface elements and the chemical composition of FeOCl, XPS analysis was carried out. The XPS survey spectrum [Fig. S3(a)] shows Fe 2p, O 1s, and Cl 2p peaks for FeOCl. To determine the valence states for various elements of FeOCl, high-resolution XPS analysis was conducted. Fig. S3(b) reveals peaks with binding energies of 711.8 and 725.4 eV, corresponding to Fe3+ 2p 3/2 and Fe3+ 2p 1/2, respectively.Reference Fei, Peng, Li, Yang, Lu, Samuel, Fan and Tour21 These peaks are characteristic of Fe(III) in FeOCl, with γ-FeOOH as Ref. Reference Zhang, He and Gu22. The Fe 2p photoelectron peaks are in good agreement with the XPS characteristics of a valence-mixed iron oxide or chloride.Reference Grosvenor, Kobe, Biesinger and McIntyre23 For Fig. S3(c), there may be more than one chemical state with a similar binding energy due to the wide and asymmetric peak of the O 1s spectrum.Reference Zhang, Park, Kim and Park24 The two peaks at binding energies of 530.8 and 532.8 eV can be, respectively, attributed to the Fe–O bonds of FeOCl and enrichment of the H2O molecules absorbed on the surface.Reference Wang, Zhang, Zhu, Dai, Bao, Wei and Cai25 Figure S3(d) shows peaks with binding energies of around 199.2 and 200.7 eV that can be ascribed to Cl 2p, consistent with the values for Cl−.Reference Huang, Hu, Cong, Zhao and Qiu26
The specific surface area is an important feature of materials for photocatalytic applications.Reference Zhang, Park, Kim and Park24 The BET surface areas of as-prepared FeOCl were investigated by the nitrogen adsorption/desorption method. As shown in Fig. S4, typical isotherms with a hysteresis loop were obtained, which were referred to the type of H3 (IUPAC Classification). The results indicate that the pores of FeOCl are mainly slit-shaped and piled up with plate-like particles, which agree with the result of SEM. The specific surface area of as-prepared FeOCl was 14.4 m2/g.
In addition to the specific surface area, the optical absorption property is another factor affecting the photocatalytic activity of catalysts.Reference Wu, Li and Zhang27 The light-absorption property of FeOCl, prepared at 250 °C, was explored through UV-Vis diffuse reflectance spectroscopy (DRS). As shown in Fig. 6, it can be clearly observed that the DRS of the FeOCl samples displays a strong and consecutive visible light absorption region, ranging from 329 to 750 nm, indicating that FeOCl absorbs visible light. The absorption at 229 nm is attributed to the existence of isolated FeIII at tetrahedral coordination sites.Reference Kumar, Schwidder, Grünert and Brückner28 Referring to the electronic structure of γ-FeOOH, the broad band above 600 nm of all spectra in Fig. S5 is the transition of 6A1 → 4T2 of layer-structured Fe–O compounds. The maximum absorption wave length of FeOCl is 697 nm, and the band gap of the sample is estimated by the formula, bandgap (eV) = 1240/λ (nm). The band gap is 1.78 eV, which is close to the literature value (1.90 eV).Reference Jarrige, Cai, Shieh, Ishii, Hiraoka, Karna and Li29 Compared with other iron oxides (Fe2O3 or FeOOH), the smaller band gap of FeOCl can effectively increase sunlight utilization.Reference Tiya-Djowe, Laminsi, Noupeyi and Gaigneaux30
Together with the characterization results above, it can be inferred that the FeOCl catalyst has been synthesized successfully, with a cascaded and staggered sheet structure.
B. Photocatalytic activity of FeOCl
As mentioned before, the photocatalytic activity of the samples was evaluated based on the degradation of 20 mg/L aqueous RhB solution. In the organic degradation reaction on an Fe-based catalyst, it is challenging to achieve good catalysis in a neutral solution because the iron compounds easily react with an acid, causing iron leaching.Reference Yang, Xu, Xu and Han17b Therefore, to avoid iron leaching, the activity measurement was carried out at pH = 5 and 298 K. The reaction volume was 100 mL with concentrations of FeOCl and PS as 500 mg/L and 100 mg/L, respectively, unless otherwise specified.
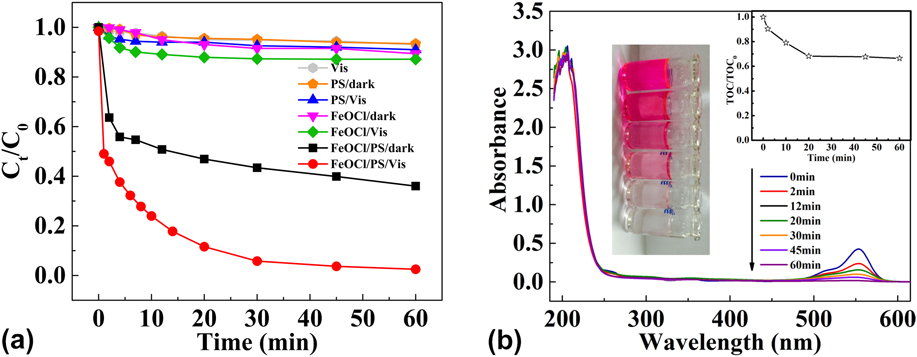
Figure 2(a) represents the variation of RhB concentration (C t/C 0) as a function of reaction time in various catalytic processes. There is no significant decolorization of RhB under simulated sunlight illumination in the absence of the photocatalyst and oxidant, indicating that RhB is stable under visible light. In the process of PS/dark and PS/Vis, RhB is only slightly degraded, reflecting that PS cannot degrade RhB directly even though it has been activated by visible light. With the FeOCl catalyst, present alone in the reaction system, about 10% of RhB is removed in 60 min. This shows that the absorption capacity of FeOCl with the addition of PS into this system results in the rate of RhB degradation increasing to 64%, revealing that FeOCl can activate PS directly. Without PS, there is only 13% removal of RhB under visible light irradiation, which is largely due to adsorption rather than degradation. The low removal efficiency of RhB can be attributed to the fast recombination of photogenerated electrons and holes. The process of FeOCl/PS/Vis shows remarkable degradation of RhB, which can be completely decolorized within 30 min. In addition, the degradation of RhB approximately follows pseudo-first-order kinetics, as evidenced by the linear plot of −ln(C t/C 0) versus reaction time t. As shown in Fig. S6, the kinetic enhancement of the catalyzed degradation of RhB over FeOCl is significant in the presence of both PS and visible light (FeOCl/PS/Vis system, k = 7.197 × 10⁻² min−1), compared to other systems (7.4 × 10⁻⁴ min−1 for FeOCl/dark; 2.44 × 10⁻³ min−1 for FeOCl/Vis; 8.4 × 10⁻³ min−1 for FeOCl/PS).
(a) Comparative study of RhB decolorization. Reaction conditions: RhB (20 mg/L); FeOCl (0.5 g/L); PS (0.1 g/L); initial pH 5.0. (b) Time-dependent UV-Vis absorption spectra. Inset: the decrease of TOC in solution as a function of irradiation time.

To investigate the changes of RhB absorption spectra during the photodegradation, the time-dependent UV-Vis absorption spectra are shown in Fig. 2(b). There is a main band in the visible band (located at 554 nm) before reaction, which accounts for the pink color of RhB. As the reaction proceeds, the visible band of the dye decreases gradually and finally disappears. At the same time, the maximum absorption wave length moves from 554 to 545 nm after 60 min. This can be attributed to the removal of ethyl groups and the mineralization of RhB.Reference Zhuang, Dai, Tian, Li, Xie, Wang, Liu, Shi and Wang31 Meanwhile, no significant decline of the band at 310 nm is detected, indicating that the structure of the naphthalene ring has not been destroyed. The inset of Fig. 2(b) shows that in the initial time-period of 60 min, approximately 34% TOC removal is observed. This can be attributed to the adsorption of the catalyst and the positive influence of the presence of PS.Reference Vinu, Polisetti and Madras32
C. Reusability and stability of FeOCl
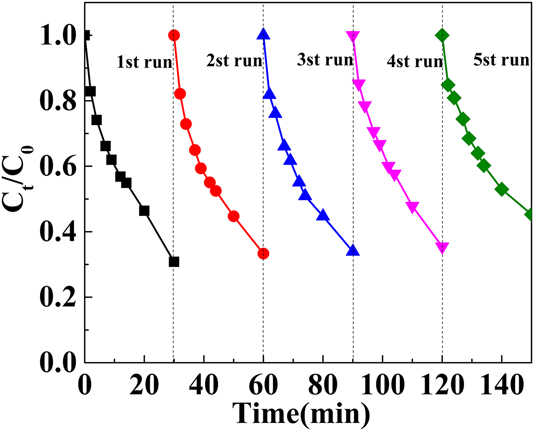
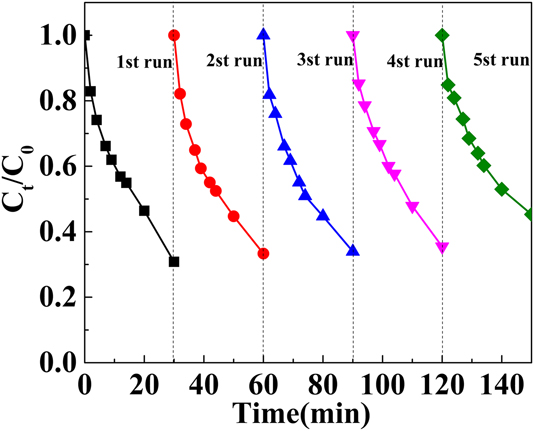
Apart from the photocatalytic activity, the recyclability and stability are important indicators for a catalyst to be used in practical applications.Reference Yao, Cai, Lu, Qin, Wei, Xu and Wang33 To confirm the stability of FeOCl, the catalyst was used in repetitive photodegradation cycles of RhB. Each experiment was carried out under identical conditions. As shown in Fig. 3, the reaction rate for RhB degradation slightly decreases after five cycles, revealing that the FeOCl is stable. Figure S7 shows the XRD patterns of FeOCl, before and after the photocatalytic reaction, for five cycles. It is clearly seen that the structure of FeOCl has not significantly changed. Organic compounds, which are absorbed on the surface of the photocatalyst, can be ascribed to the reducing photocatalytic activity of FeOCl.Reference Wu, Li and Zhang27 In addition, iron hydroxide is gradually precipitated on the surface of FeOCl and tends to reduce the contact area between the active site and PS, and this may be another reason that affects cycle performance.Reference Jia, Kang, Zhang, Wang, Yang, Sun, Habibi and Zhang34
Cycling curve for photocatalytic degradation of RhB. Reaction conditions: RhB (20 mg/L); FeOCl (0.5 g/L); PS (0.1 g/L); initial pH 5.0.
D. Mechanism discussion
To investigate the roles of reactive species during the photocatalytic degradation reaction, tert-butyl alcohol (TBA), ethanol (Et), 1,4-benzoquinone (BQ), and ethylenediamine tetraacetic acid disodium (EDTA-2Na) were used as a hydroxyl radical (•OH) scavenger, sulfate radical (SO4−•) scavenger, superoxide radical (•O2−), and photo-generated hole (h+) scavenger, respectively. As shown in Figs. S8(a)–S8(c), compared with the photocatalytic degradation without adding any active species scavenger, the degradation rate of RhB is inhibited after the addition of the four scavengers TBA (3.5 mL), Et (2 mL), BQ (4 mg), and EDTA-2Na (40 mg) in the reaction system. This shows that •OH, SO4−•, •O2−, and h+ are generated during the photocatalytic reaction. It is worth noting that the inhibition degrees are roughly the same under different values of pH, following the order of EDTA-2Na > Et > BQ > TBA. This demonstrates that h+ plays an important role in the photocatalytic degradation while SO4−• and •O2− are the other main reactive species during the reaction. Figure S8(d) shows the effect of initial pH on the degradation of RhB in the FeOCl/PS/Vis process. Clearly, insignificant degradation of RhB occurs within 60 min at pH 3.0–10.1, which may be relevant, as the main reactive species during the reaction remain constant at different pH values. It was reported that SO4−• can be scavenged by •OH at high pHReference Lau, Chu and Graham35 [Eq. (1)]. Also SO4−• is converted to •OH under alkaline conditions,Reference Hou, Zhang and Xue36 as shown in Eq. (2). Carboxyl acids, such as sulfuric acid and acetic acid, are produced during the reaction. Therefore, the pH values drop during the reaction, which may be another reason for the similar degradation efficiency at the end of the reaction with a different initial pH value.
 $${\rm{SO}}_4^{ \bullet - } + {\,^ {\bullet }{\rm{OH}} \to {\rm{HSO}}_4^ - + 0.5{{\rm{O}}_2}\quad ,$$
 $${\rm{SO}}_4^{ \bullet - } + {{\rm{H}}_2}{\rm{O}} \to {\rm{SO}}_4^{2 - } + {^ {\,\bullet }{\rm{OH}} + {{\rm{H}}^ + }\quad .$$
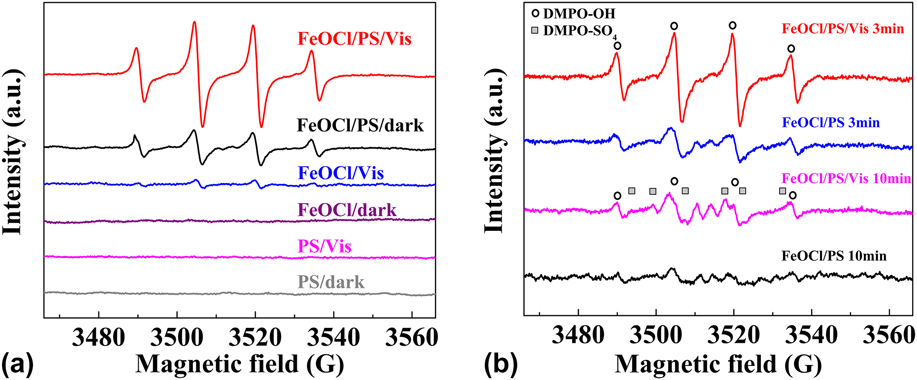
Furthermore, EPR tests with DMPO as a radical spin trapping agent were performed to verify the above speculation. As presented in Fig. 4(a), only very weak signals of DMPO-OH are detected in the FeOCl/Vis process, as shown by the four characteristic peaks with standard ratios of intensities 1:2:2:1 (a N = a H = 14.9 GReference Buettner37). No peaks are observed in the EPR spectra of the FeOCl/dark, PS/Vis, and PS/dark processes, confirming that the following: (i) FeOCl is capable of oxidizing hydroxyl ion to generate •OH radicals but has a low quantum yield in the FeOCl/Vis process, (ii) PS cannot react with DMPO to form radical species, and (iii) visible light cannot activate PS.Reference Gao, Li, Li, Yao and Zhang14 By contrast, it is clearly observed that the FeOCl/PS/Vis process exhibits the typical signal of the DMPO-OH spin adduct [see Fig. 4(b) for a closer look] at a reaction time of 3 min, but exhibits no detectable signals of the DMPO-SO4 adduct. When the reaction time is prolonged to 10 min, a set of characteristic signals of DMPO-SO4 (a N = 13.8 G, a H = 10.1 G, a H = 1.42 G, and a H = 0.83 G)Reference Buettner37 appear, showing the formation of SO4−• in the FeOCl/PS/Vis process. Meanwhile, the typical signal of DMPO-OH is attenuated. The above results prove (i) the formation of •OH in the initial phase of the FeOCl/PS/Vis process and (ii) with an extension of the reaction time, the production of SO4−• increases and becomes the major active species. This may be the reason that •OH is not detected by the free radical inhibition test. Compared with the EPR spectrum of the FeOCl/PS/Vis process, the signal intensities of DMPO-OH and DMPO-SO4 adducts decrease markedly in the FeOCl/PS process, indicating that low amounts of SO4−• and •OH are produced during the reaction.
(a) EPR spectra measured at room temperature for the different processes involved in this study. (b) EPR spectra measured at room temperature for closer look of FeOCl/PS/Vis and FeOCl/PS processes at different reaction times.
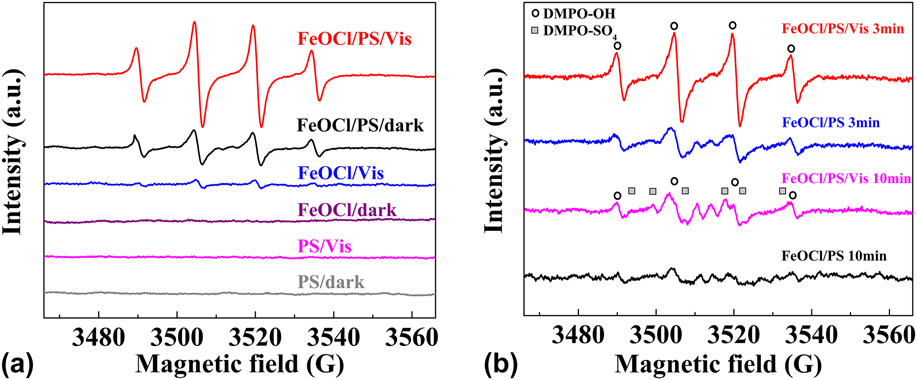
Based on the results of EPR analysis, it can be deduced that (i) SO4−• and •OH are produced during the FeOCl/PS/Vis and FeOCl/PS processes, and both contribute to the oxidative degradation of RhB, (ii) the FeOCl/PS/Vis process is superior to the FeOCl/PS process for PS activation due to the higher peak intensities of the former, relative to those of the latter, and (iii) FeOCl can activate PS directly.
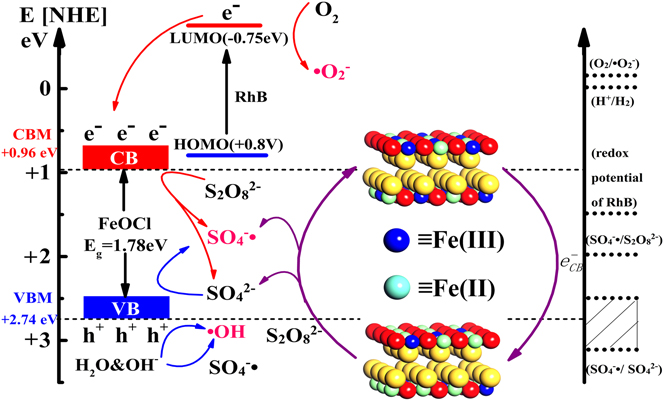
Based on the result of DRS (Fig. 6), FeOCl is excited to produce electron–hole pairs under the irradiation of visible light [Eq. (3)] because of the narrow band gap (1.78 eV). To investigate the electronic structures and oxidation ability of the holes, VB XPS of FeOCl catalysts, calcined at various temperatures, have been measured. As shown in Fig. S9, the valence band maximum (VBM) of all the samples is 2.74 eV. Furthermore, the conduction band minimum (CBM) of FeOCl is calculated to be 0.96 eV, according to the empirical equation E CB = E VB − E g.
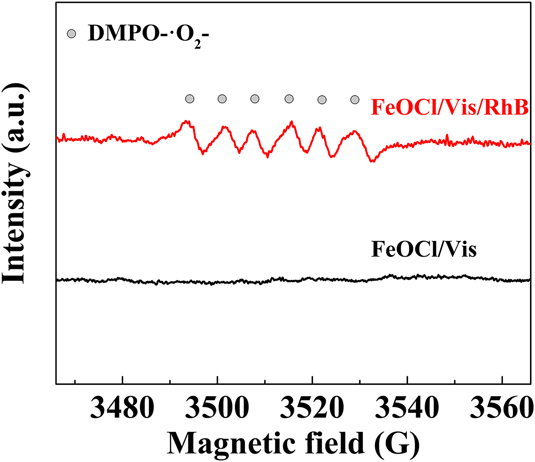
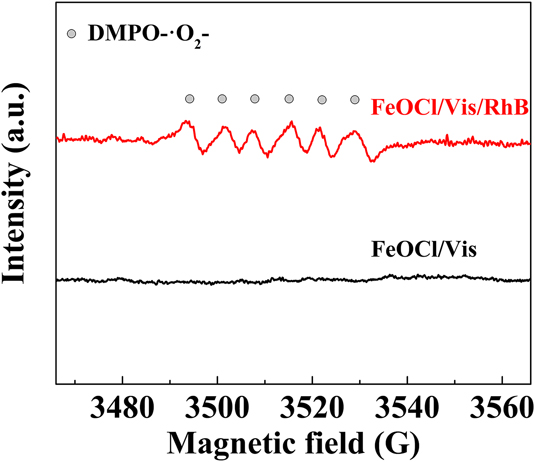
FeOCl cannot easily reduce O2 to •O2− radicals because its CBM value is more positive than the redox potential of O2/•O2− (−0.16 eV). More significantly, however, the absorbed RhB molecules on the surface of FeOCl can be excited by visible light to form the excited state RhB*.Reference Chang, Xie, Zhang, Chen, Li, Wang, Luo, Deng and Hu38 Meanwhile, a thermodynamically favorable transfer of electrons from LUMO of RhB (−0.75 eV) to the CB of FeOCl (+0.98 eV) can take place. This excludes the possibility that the electrons are able to react with dissolved oxygen to produce •O2− [Eq. (4)], which agrees with active species trapping experiments.Reference Fu, Tian, Chang, Xi and Dong39 EPR was used in methanolic media to verify the accuracy of the conclusion. From Fig. 5, six characteristic peaks of •O2− are observed in the FeOCl/Vis/RhB system. By contrast, no •O2− signals emerge for the system of FeOCl/Vis. This reveals that •O2− radicals are generated through the activation of molecular oxygen in the process of dye photosensitization.
EPR spectra of superoxide radical species over FeOCl/Vis/RhB and FeOCl/Vis processes.
Notably, the redox potential of RhB is about 1.43 eV,Reference Yan, Li and Zou40 which is significantly lower than the VBM level of FeOCl, indicating that the direct hole oxidation process is also energetically favorable. RhB can serve as a photogenerated hole scavenger and can be oxidized. This is confirmed by the results of the free radical inhibition test. In addition, the CBM of FeOCl is much more negative than the redox potential of SO4−•/S2O82− (2 eV),Reference Fernandez, Maruthamuthu, Renken and Kiwi41 satisfying the thermodynamic requirements for the production of SO4−• radicals. The SO4−• radicals are influenced by the photogenerated charges [Eqs. (5) and (6)],Reference Zhou, Sun, Wang, Ming Ang and Tadé42 but the lower CB edge and higher VB edge of the catalyst favor the improvement of RhB via PS activation. By comparing the VBM potential of FeOCl (2.74 eV) and the redox potential of •OH/OH− (2.38 eV),Reference Zhang, Ai and Jiang43 FeOCl is capable of generating •OH radicals by hole oxidation of hydroxyl ions or water molecules, consistent with the EPR test [Fig. 4(a), FeOCl/Vis].
The lifetime of carriers in FeOCl was obtained by fluorescence spectroscopy. As shown in Fig. S10, the fluorescence decay curve is fitted by the single exponential model [Eq. (7)], showing the short lifetime of carriers (0.3676 ns). The result indicates the fast recombination of photogenerated electrons and holes, which is consistent with the experimental conclusions [Fig. 4(a), FeOCl/Vis system]. However, the electrons can be captured by S2O82− and dissolved oxygen for the generation of SO4−• [Eq. (8)]. This process can effectively restrain the recombination of electrons and holes.
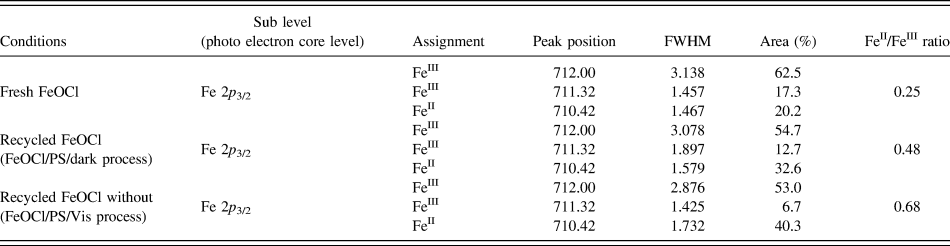
FeOCl and other metal oxychlorides easily lose Cl atoms from the surface. This leads to the formation of more unsaturated Fe atoms, to become highly reactive sites. To verify the regeneration of Fe(II) in the FeOCl/PS/Vis process, XPS analysis was performed to characterize the FeOCl catalyst, before and after the reusability experiment. As shown in Fig. S11, Fe 2p spectra are fitted to three components, and the peak parameters used are presented in Table I. As can be seen, the relative content ratios of FeII/FeIII increase from 0.25 to 0.68 under visible-light, and to 0.48 without visible-light. The results reveal that more Fe(II) is regenerated during the FeOCl/PS/Vis process, compared to the FeOCl/PS/dark process. This provides further evidence that visible-light can accelerate the reduction of Fe species in the FeOCl/PS/Vis process. SO4−• can be generated by the one-electron reductive reaction between ≡Fe(II) (the symbol ≡ means the iron species on the catalyst) and S2O82− [Eq. (9)]. At the same time, ≡Fe(II) can be regenerated from ≡Fe(III) via the electronic reduction reactionReference Cai, Liu, Zhang, Zheng and Zhang12,Reference Liu, Guo, Zhang and Tang13 [Eq. (10)] and the decomposition of PS to generate oxidative PS radical [Eq. (11)]. Therefore, more SO4−• can be generated for the decolorization of RhB, which may explain the high degradation rate of the FeOCl/PS/Vis process [Eq. (12)].
 $${\rm{FeOCl}} + hv \to h_{{\rm{VB}}}^ + + {\rm{e}}_{{\rm{CB}}}^ - \quad ,$$
 $${{\rm{O}}_2} + {\rm{e}}_{{\rm{CB}}}^ - \to {\,^ {\bullet }{\rm{O}}_2^ - \quad ,$$
 $${\rm{SO}}_4^{ \bullet - } + {\rm{e}}_{{\rm{CB}}}^ - \to {\rm{SO}}_4^{2 - }\quad ,$$
 $${\rm{SO}}_4^{ \bullet - } + {{\rm{h}}^ + } \to {\rm{SO}}_4^{ \bullet - }\quad ,$$
 $$y = {y_0} + {A_1}{{\rm{e}}^{\left( {{{ - x} / {{\tau _1}}}} \right)}}\quad ,$$
 $${{\rm{S}}_2}{\rm{O}}_8^{2 - } + {\rm{e}}_{{\rm{CB}}}^ - \to {\rm{SO}}_4^{ \bullet - } + {\rm{SO}}_4^{2 - }\quad ,$$
 $$\equiv {\rm{Fe}}\left( {{\rm{II}}} \right) + {{\rm{S}}_2}{\rm{O}}_8^{2 - } \to \; \equiv {\rm{Fe}}\left( {{\rm{III}}} \right) + {\rm{SO}}_4^{{\rm{ \bullet }} - } + {\rm{SO}}_4^{2 - }\quad ,$$
 $$\equiv {\rm{Fe}}\left( {{\rm{III}}} \right) + {\rm{e}}_{{\rm{CB}}}^ - \to \; \equiv {\rm{Fe}}\left( {{\rm{II}}} \right)\quad ,$$
 $$\equiv {\rm{Fe}}\left( {{\rm{III}}} \right) + {{\rm{S}}_2}{\rm{O}}_8^{2 - } \to \equiv {\rm{Fe}}\left( {{\rm{II}}} \right) + {{\rm{S}}_2}{\rm{O}}_8^{ \bullet - }\quad ,$$
 $${\rm{RhB}} + {\rm{h}}_{{\rm{VB}}}^ + {\rm{/SO}}_4^{ \bullet - }{\rm{/O}}_2^{ \bullet - }{{\rm{/}}^ \bullet }{\rm{OH}} \to {\rm{degradation}}\;{\rm{products}}\quad .$$
Chemical states of Fe elements and their corresponding parameters used.

Based on the above results, a plausible mechanism for the catalytic activation of FeOCl with PS under visible light in the degradation of RhB is illustrated in Fig. 6.
Plausible mechanism of photocatalytic degradation of RhB in the FeOCl/PS/Vis process.

IV. EFFECT OF SEVERAL PARAMETERS ON RHB DEGRADATION
As can be seen from Fig. S12(a), an increase in the PS concentration from 20 to 200 mg/L, resulted in a significant increase in the degradation rate (from 56 to 99.8%) and ratio (from 0.01656 to 0.18825), which could be attributed to the formation of more radicals, such as SO4−• and •O2−. However, the degradation rate and ratio were decreased with the concentration of PS increasing to 500 mg/L. There were two main reasons: (i) the self-quenching process of excessive of SO4−• radicals; (ii) SO4• consumed by the excess amount of S2O82−, as expressed by the following equations:
 $${\rm{SO}}_4^{ \bullet - } + {\rm{SO}}_4^{ \bullet - } \to {{\rm{S}}_2}{\rm{O}}_8^{2 - }\quad ,$$
 $${\rm{SO}}_4^{ \bullet - } + {{\rm{S}}_2}{\rm{O}}_{\rm{8}}^{{\rm{2}} - } \to {\rm{SO}}_{\rm{4}}^{2 - } + {{\rm{S}}_2}{{\rm{O}}_8}^{ \bullet - }\quad .$$
To check the heterogeneous catalytic activity of FeOCl, the degradation of RhB were determined at pH 5.0 in the presence of 100 mg/L PS and 20 mg/L RhB. As shown in Fig. S12(b), when the concentration of FeOCl was in the range of 100–500 mg/L, RhB was degraded completely within 60 min, and the degradation ratio efficiency increased from 0.040 to 0.083. This may have occurred because more electrons and holes would be generated as a result of a higher catalyst dosage and would provide additional active sites for SO4−• generation. However, an inhibition effect could be observed when the concentration of FeOCl was 1000 mg/L, which could be due to the excess amount of FeII resulting in competitive relation with the target contaminants and quickly leading to SO4−• depletion (the second-order kinetic is 1 × 10⁹ M−1/s). Accordingly, in proper range, increasing the concentration of FeOCl could promote the formation of SO4−•, but once the concentration continued to increase, FeOCl converted to the quenching additive for SO4−•:
 $${\rm{Fe}}\left( {{\rm{II}}} \right) + {\rm{SO}}_4^{ \bullet - } \to {\rm{Fe}}\left( {{\rm{III}}} \right) + {\rm{SO}}_4^{2 - }\quad .$$
V. CONCLUSION
In summary, FeOCl has been successfully synthesized via a partial pyrolysis method. FeOCl, prepared at 250 °C, exhibits the highest photocatalytic ability in the activation of PS to degrade RhB under visible light irradiation. The high recyclability and stability of FeOCl have been vindicated by a durability test and the characterization results of the fresh and spent catalysts. The relative content ratios of FeII/FeIII in the surface of FeOCl were increased from 0.25 to 0.68 in the process of FeOCl/PS/Vis, and to 0.48 in the process of FeOCl/PS/dark, demonstrating that visible light can promote electron transfer. Fe(III) on the surface of FeOCl can trap photogenerated electrons, to convert into Fe(II). This can accelerate the reuse of Fe(III)/Fe(II) and the production of SO4−•. PS acts as a capture trap of the photogenerated electrons in the process of FeOCl/PS/Vis, effectively restraining the recombination of photogenerated electron–hole pairs. Meanwhile, the generation of strong oxidizing free radicals (SO4−•, •O2−, and •OH) has further advanced the photocatalytic degradation of RhB. Moreover, the process of FeOCl/PS/Vis shows a high degradation rate under different pH values from 3.0 to 10.1, which demonstrates good prospects for applications in water treatment.
Supplementary Material
To view supplementary material for this article, please visit https://doi.org/10.1557/jmr.2018.246.
ACKNOWLEDGMENTS
This work was financially supported by the state supported project funds for research and demonstration on the Key Technology for Clean Production in Textile Printing and Dyeing (2014BAC13B02).