Introduction
An understanding of interfacial water remains a topic of great scientific and practical interest, as demonstrated in this issue of MRS Bulletin. Advancements in simulation algorithms force fields and the availability of massive computational capabilities allow the research community to improve this understanding. However, despite fast progress, many open questions remain regarding interfacial water. Cross-comparison and validation between molecular simulation results and advanced experiments remain crucial, as does the enrichment of classic theoretical frameworks by the inclusion of new experimental and simulation results. This review provides a succinct summary of recent simulation results regarding interfacial water, along with a personal opinion regarding three directions along which future research could yield important societal benefits. Rather than discussing technical details, which can be found in authoritative references, some of which are cited herein, this article provides a general overview with the goal of generating interest in the subject.
Methods
Simulation results can provide a bridge between theoretical and experimental approaches. The accuracy of molecular simulations relies on the availability of accurate force fields describing the interactions among the various constituents of a system of interest. Much progress has been made in developing accurate force fields for water,Reference Vega and Abascal1 although a single model able to describe all properties of bulk and interfacial water remains elusive. Many of the recent contributions on interfacial water have been obtained by conducting molecular dynamics (MD) simulations. In MD, molecules are allowed to move within a carefully prepared simulation box, with their motion governed by Newton’s laws of dynamics.Reference Allen and Tildesley2–Reference Gray, Gubbins and Joslin4
Background
Attempts to relate the structure of interfacial water to macroscopic observables have a long and rich history.Reference Ben-Naim and Marcus5 In 1959, for example, Kauzmann proposed to understand protein folding in water, driven by hydrophobic interactions, using the transfer of a nonpolar molecule from water to a nonpolar solvent as an analogy.Reference Kauzmann6 This was among the first discussions concerning the wide implications of hydrophobic interactions. Hydrophobic forces are due, at least in part, to the reorganization of water molecules within the hydration shell of a solute, which leads to a decrease in the system entropy.Reference Israelachvili7–Reference Wu and Prausnitz9 These phenomena are important in a variety of applications (protein folding and hydrocarbon solubility in water being just two well-known examples) in which water comes into contact with various solutes and surfaces. To benefit these applications, scientists have addressed questions such as the following: (1) How does the size of a hydrophobic solute contribute to the perturbation of water at interfaces, often referred to as hydration water? (2) How do ions perturb hydration water? (3) How do surface features (e.g., distribution of surface partial charges) affect hydration water? (4) How far from the solute does the perturbation persist?
Ashbaugh and Pratt made important theoretical contributions by quantifying the effect of solute size on the structure of interfacial water and using this perturbation to describe solute–solute interactions.Reference Ashbaugh and Pratt10,Reference Ashbaugh and Pratt11 They recently also considered the effect of temperature.Reference Chaudhari, Holleran, Ashbaugh and Pratt12 Because the reorganization of hydration water is more pronounced at low rather than at high temperatures (T), it would be expected that effective attractions between hydrophobic solutesReference Roberts, Keeling, Tracka, van der Walle, Uddin, Warwicker and Curtis13 would be stronger at low T. Note that effective interactions between solutes can be assessed experimentally by measuring the second osmotic virial coefficient, B 22, either using osmotic pressure or static light scattering. (For a recent publication in which B 22 measurements are used to sample effective protein–protein interactions of interest to drug formulation, see Roberts et al.13) Instead, the simulation results of Ashbaugh and Pratt showed that for molecular-size hydrophobic compounds, B 22 becomes more negative (more attractive) as T increases from 300 to 360 K. This suggests that to positively affect practical applications, it is not sufficient to only analyze the molecular-scale properties of interfacial water.
Simulations of the hydration of simple ions were already being conducted two decades ago. Lee and Rasaiah considered a series of alkali metal ions and their halides in water at 298 K and showed that ion mobility in water is influenced not only by the structure of the hydration layer, but also by the dynamics of water within the hydration shell.Reference Lee and Rasaiah14 Smith and Dang considered the association of NaCl ion pairs in water and highlighted the importance of water polarizability.Reference Smith and Dang15
More recently, the focus has moved toward multivalent ions. For example, Dang and co-workers simulated CaCl2, SrCl2, SrBr2, and SrI2.Reference Dang, Truong and Ginovska-Pangovska16,Reference Dang, Sun, Ginovska-Pangovska, Annapureddy and Truong17 They found that small changes in the parameterization of the ion–ion interaction potential strongly affect both ion association and ion accumulation at water–vacuum interfaces. Unfortunately, limited experimental data are available to refine the interatomic potentials. Clearly, much needs to be done to achieve a molecular-level interpretation of spectroscopic data, some of which suggest that ions are excluded from hydrophobic hydration shellsReference Rankin and Ben-Amotz18 and that ion-specific effects become manifest for the hydration of amphiphiles at interfaces.Reference Scheu, Chen, de Aguiar, Rankin, Ben-Amotz and Roke19 Regarding ion-specific effects, Lo Nostro et al. reviewed evidence of such effects as observed in biology,Reference Lo Nostro and Ninham20 and Jungwirth and Cremer reviewed the hydration structures of ions.Reference Jungwirth, Cremer and Hofmeister21 Although it is accepted that the structure of hydration water is related to macroscopic observables, the short-range nature of changes in the structure of hydration water compared to bulk water suggests that other factors might also be important for achieving a comprehensive understanding of macroscopic phenomena.
To quantify how a solid substrate perturbs the structure and dynamics of interfacial water, it has become routine to simulate a thin water film supported on a solid.Reference Striolo22 The data generally show that when the solid substrate is atomically smooth, a dense first hydration layer forms, in some cases along with a second hydration layer, and that bulk water density is recovered at distances larger than ∼1.2 nm. It might be surprising to note that similar features are also observed on graphitic substrates.Reference Striolo, Chialvo, Cummings and Gubbins23–Reference Gordillo and Marti25 When possible, water molecules interact with surface chemical groups, for example, through hydrogen bonds. These water molecules can act as “anchors” for molecules in the second hydration layer, which are less strongly adsorbed than those in the first layer.
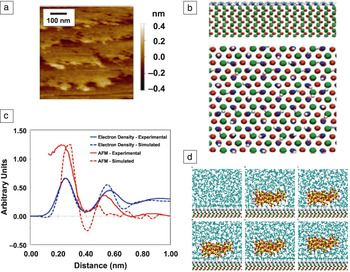
Figure 1 shows a comparison between simulations and experiments for water on crystalline alumina.Reference Argyris, Phan, Ashby and Striolo26 The experimental data were obtained by x-ray reflectivityReference Catalano27,Reference Catalano28 and atomic force microscopy (AFM).Reference Argyris, Phan, Ashby and Striolo26 The density of the first hydration layer, as predicted by MD,Reference Phan, Ho, Cole and Striolo29 is in quantitative agreement with the experimental x-ray reflectivity data. Because of computing-power limitations, it is not possible to simulate, using atomistic resolution, an entire AFM tip. Instead, a small amorphous SiO2 disc was used to probe the force-distance profile using atomistic simulations. The results extracted from the atomistic simulations show good qualitative agreement with the experimental AFM data within the first repulsive peak. The comparison between simulated and experimental data in the second hydration layer suggests that improvements are needed. In general, simulations are conducted for rigid substrates, even though it is known that the atoms at the solid interface are rearranged compared to the bulk crystalline structure. It is likely that solid–water interaction potentials need to be improved, and perhaps even the water–water force fields need to be improved to properly describe the interfacial region. Despite these limitations, we conclude that simulations are likely to reproduce experimental observables when accurate force fields are available. (For example, the state of the art regarding clay–water force fields is described in this issue by Rotenberg.)
(a) Atomic force microscope (AFM) scan of the alumina crystal surface used for sampling the structure of interfacial water. (b) Simulation model of the alumina crystal, the solid substrate on which the water film is simulated. Top and side views of the substrate are provided. Green and red spheres are for Al and O atoms in the solid substrate, while blue and white spheres are O and H atoms in the surface hydroxyl groups. (c) Comparison between experimental (continuous lines) and simulated (broken lines) data for the density of interfacial water (blue) and the force–distance curve (red). (d) Simulation model of a small silica disk (amorphous) at various distances from the alumina substrate, used to extract the simulated force–distance curve by the umbrella sampling algorithm. Yellow, red, and white spheres in the silica disc represent Si, O, and H atoms, respectively. Reproduced with permission from Reference 25. © 2013 American Chemical Society.

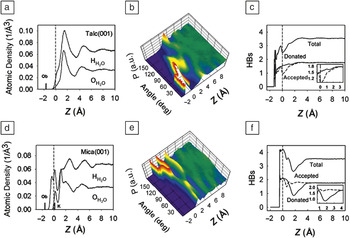
The previous discussion suggests that atomistic simulations can provide realistic descriptions of interfacial water on various substrates. The natural follow-up question is whether the structure and dynamics of hydration water depend substantially on the features of a solid substrate. Simulation results available in the literature suggest that although the qualitative features for interfacial water have been reported to be similar for interfacial water in contact with different substrates, details differ. In Figure 2, we reproduced rather old but still insightful simulation data for water on talc(001), a prototypical hydrophobic substrate, and mica(001), considered to be hydrophilic.Reference Wang, Kalinichev and Kirkatrick30 Despite the wide differences in terms of macroscopic properties between these two substrates, the atomic density profiles in the direction perpendicular to the substrate, the orientation of water molecules (quantified in terms of the distribution probability of the orientation of the dipole moment of water molecules), and the number of hydrogen bonds formed by each water molecule near the interface only show small changes as a function of the solid properties. It is also worth repeating that these structural perturbations with respect to bulk water only persist at short distances from the solid (note that on both surfaces, bulk-like properties are obtained at distances slightly larger than 1 nm from the substrate).
Simulation data for water on (a–c) talc(001) and (d–f) mica(001): (a,d) atomic density profiles as a function of the distance from the surface Z (for both O and H atoms of water), (b,e) probability distribution, P, of the angle formed by the dipole moment of water molecules with respect to the surface normal as a function of the distance from the substrate, and (c,f) number of hydrogen bonds (HBs) per water molecule (donated and accepted) as a function of the distance from the surface. Reproduced with permission from Reference 30. © 2009 American Chemical Society.

The perturbations of dynamical properties of interfacial water are consistent with structural perturbations and strongly depend on the substrate; water shows faster tangential diffusion near surfaces that do not attract water and slower tangential diffusion near attractive surfaces.Reference Jungwirth, Cremer and Hofmeister21 Regarding the relation between structure and dynamics, a recent investigation showed that water shear can lead to substantial changes in surface charges, and possibly to a reconstruction of the electric double layer, as a result of dissolution processes on surfaces of materials with low solubilities in water.Reference Waychunas31,Reference Lis, Backus, Hunger, Parekh and Bonn32
Atomistic simulations of interfacial water have shown that the distribution of preferential adsorption sites on the surface strongly affects the first hydration layer. In some cases, patterns of preferential adsorption sites can yield extended long-lasting hydrogen-bonded networks. These structures, which can yield strong repulsive forces against approaching molecules,Reference Argyris, Ashby and Striolo33 could help prevent surface fouling.Reference Elder and Jayaraman34 Studies have been reported on how the distribution of preferential interaction sites on a surface affects the water–solid interfacial tensionReference Wang, Bratko and Luzar35 and how interfacial water structure determines whether the application of a pressure gradient in the direction parallel to the solid surface water at contact with the solid can slip (a condition referred to as hydrodynamic slip, which has been associated with super-hydrophobic surfaces).Reference Ho, Papavassiliou, Lee and Striolo36
To relate short-range differences such as those shown in Figure 2 to markedly different macroscopic properties, Garde and co-workers proposed to quantify the water density fluctuations in the interfacial region.Reference Jamadagni, Godawat and Garde37–Reference Patel, Varilly, Chandler and Garde40 In short, this approach revealed that it is more likely for water molecules to yield instantaneous empty pockets near hydrophobic than hydrophilic substrates. Density fluctuations were found to be correlated to the ease of molecular adsorptionReference Jamadagni, Godawat and Garde41 and to the thermodynamics and kinetics of hydrophobic interactions at interfaces.Reference Vembanur, Patel, Sarupria and Garde42 This new technique is promising for enabling simulations to aid the classification and perhaps the development of new materials, such as “translucent molecular coatings” based on grapheneReference Rafiee, Mi, Gullapalli, Thomas, Yavari, Shi, Ajayan and Koratkar43,Reference Shih, Strano and Blankschtein44 and other practical applications.
Possible extensions to practical applications
We have thus far discussed recent progress in the quantification of the properties of interfacial water and the systematic classification of surfaces depending on their water affinity. In this section, three possible extensions of fundamental research toward practical applications are highlighted.
Self-assembly of nanostructures
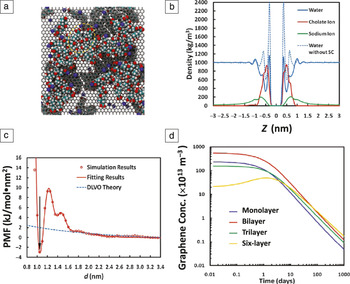
The structure of hydration water and the relation of this structure to hydrophobic effects are considered instrumental in the self-assembly of surfactants, proteins, and nanostructures. To secure progress in understanding this process, a quantifiable relationship is required between interfacial water properties and effective interactions in water. Debenedetti and co-workers investigated the mechanism of graphene aggregation in water and showed that it depends on the platelet size.Reference Sharma and Debenedetti45,Reference Ferguson, Giovambattista, Rossky, Panagiotopoulos and Debenedetti46 When two platelets are of ∼3 nm in size, an empty cylinder that spans the distance between the two platelets needs to form in water to promote aggregation. When the platelets are ∼1 nm, agglomeration occurs when all of the water molecules between the two platelets spontaneously evaporate.Reference Sharma and Debenedetti47 Accurate descriptions of the free energy landscapes corresponding to these mechanisms have been provided. Practical applications will benefit enormously when we learn to systematically translate such free-energy profiles into macroscopic models for the kinetics of agglomeration. For example, Blankschtein, Strano, and co-workers combined free-energy profiles from atomistic simulations with kinetic models of colloid agglomeration to describe the aggregation of graphene sheets stabilized by surfactants (Figure 3).Reference Lin, Shih, Strano and Blankschtein48,Reference Shih, Lin, Strano and Blankschtein49 The simulations were conducted for graphene sheets covered by sodium cholate surfactants, as shown in Figure 3a. The results were analyzed in terms of the density profiles in the direction perpendicular to the graphene sheet for surfactants, ions, and water (Figure 3b). Additional simulations were conducted to extract the force-distance curve for the graphene sheets, in some cases covered by surfactants. These simulation results, as shown in Figure 3c, were used to parameterize an effective interaction potential between the two graphene sheets, since the Derjaguin–Landau–Verwey–Overbeek (DLVO) formalism only provided partial agreement with the simulation results. The authors employed a kinetic model for colloids agglomeration to predict the agglomeration of the graphene sheets in water as a function of time. The model of agglomeration exploits the mathematical expression for the effective interaction between graphene sheets obtained as described in Figure 3c. As shown in Figure 3d, the comparison between the prediction of the graphene coalescence and experiments is acceptable, although the approach relies on one adjustable parameter. Future research could be aimed at determining the value of this parameter using simulations. This would allow researchers to design methods for the stabilization of particles in solution and perhaps control of their assembly under desired conditions.
(a) Simulation snapshot of sodium cholate (SC) surfactant adsorbed on one graphene sheet. (b) Density distribution in the direction perpendicular to the graphene sheet of water molecules, sodium cholate ions, and sodium ions. (c) Simulation results for the graphene–graphene free energy profile (potential of mean force) as a function of the distance between the graphene layers, fitting of the simulation data to a mathematical function, and fitting to Derjaguin–Landau–Verwey–Overbeek (DLVO) theory. (d) Prediction of the concentration as a function of time of single-, bi-, tri-, and multilayer graphene sheets in an aqueous dispersion. PMF, potential of mean force. Reproduced with permission from Reference 48. © 2011 American Chemical Society.

Membranes and separation processes
Membranes are used in many separation processes. Simulations could be used to better understand the mechanisms involved when various substances diffuse through membranes impregnated with water.Reference Phan, Cole and Striolo50 Water-impregnated porous systems, such as membranes, are important for many current and future applications, as illustrated by the following examples:
(1) In hydrogen fuel cells, protons diffuse through poly(persulfonic acid) membranes (e.g., Nafion) soaked in water. Simulations of these systems are difficult because the structure of such membranes is not clear at the molecular level.Reference Daly, Benziger, Debenedetti and Panagiotopoulos51
(2) Understanding how the diffusion of water is coupled to that of vitamins and perhaps drugs could be beneficial for designing soft contact lenses, for instance. Although experimental results are available,Reference Fornasiero, Krull, Prausnitz and Radke52 simulations for these systems are not common, as they would require large computation resources and advanced simulation algorithms.
(3) To extract shale gas, which is widely available worldwide, in environmentally friendly ways, it appears to be necessary to quantify the coupled transport of water, hydrocarbons, electrolytes, and environmental contaminants through the narrow pores present in shale formations.Reference Yethiraj and Striolo53 Because these formations are chemically heterogeneous and the pores are extremely narrow, detailed equilibrium and nonequilibrium simulations are required to elucidate the mechanism of transport, which is likely to differ compared to that observed through oil-bearing formations composed of highly porous rocks such as sandstones or carbonates.
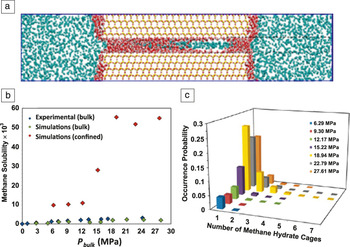
To bring such efforts to practical fruition, it is necessary to understand how the thermodynamic properties of confined waterReference Striolo, Gubbins, Burchell, Simonson, Cole, Gruszkiewicz, Chialvo and Cummings54,Reference Giovambattista, Rossky and Debenedetti55 are coupled with the transport of water and other compounds. It is also necessary to quantify how the thermodynamic properties of aqueous systems change upon confinement. For instance, in a recent contribution, Phan et al.Reference Phan, Cole and Striolo56 investigated, using atomistic simulations, the solubility of methane in water confined within a 1-nm-wide slit-shaped pore carved out of silica. Methane and water were chosen because high-pressure water is used to fracture shale rocks to produce natural gas, which is mostly composed of methane. The simulation results are summarized in Figure 4. The simulation setup is represented in Figure 4a. A slit-shaped pore carved out of silica is partially filled with water and exposed to methane. The pressure of bulk methane (outside of the pore) is increased, and the simulations are then conducted to estimate the amount of methane that enters the pore. The results are quantified in terms of the solubility of methane in the water that fills part of the pore, as shown in Figure 4b. These results suggest much higher methane solubility in water under confinement compared to experimental and simulation results for methane solubility in bulk water. Additional analysis of the simulation data, shown in Figure 4c, provides some evidence for the presence of short-lived methane hydrates within the pore under thermodynamic conditions that prevent hydrate formation in the bulk.Reference Chakraborty and Gelb57 Note that methane hydrates are both a possible source of natural gas and a sink for carbon dioxide, and they sometimes cause disruptions in the oil and gas supply chain. Careful experimental characterization of the membranes (and/or of the confining matrixes) is essential for simulations such as those of Figure 4 to bear the promised fruits.
(a) System used to simulate the solubility of methane in water confined within a 1-nm-wide slit-shaped pore carved out of silica. (b) Solubility of methane in confined water (red) compared to its solubility in bulk water as a function of pressure. (c) Probability of observing hydrate cages in the confined system as a function of pressure. Reproduced with permission from Reference 56. © 2014 American Chemical Society.

Water–energy nexus
Securing abundant fresh water and energy in an economical yet environmentally friendly manner is one of the current grand challenges for science.Reference Shannon, Bohn, Elimelech, Georgiadis, Marinas and Mayes58,Reference Tour, Kittrell and Colvin59 Capacitive water desalination could play a growing role in the future, and electric double-layer capacitors (EDLCs) could become relevant for deploying renewable energy sources. The performance of both these technologies depends on the structure and dynamics of hydrated electrolytes near carbon supports. Atomistic simulations have clarified some principles for designing graphene membranes suitable for water desalination.Reference Cohen-Tanugi and Grossman60,Reference Konatham, Yu, Ho and Striolo61 For example, using simulations, Merlet et al.Reference Merlet, Péan, Rotenberg, Madden, Daffos, Taberna, Simon and Salanne62 discovered that the unusually high capacitance observed in porous carbons with extremely narrow pores could be due to the distribution of the ions within edge, planar, hollow, and pocket sites. Combining experiments and simulations, Kalluri et al.Reference Kalluri, Biener, Suss, Merrill, Stadermann, Santiago, Baumann, Biener and Striolo63,Reference Ho, Kalluri, Biener, Biener and Striolo64 showed that it is necessary to apply an ion-dependent large voltage to force ions into narrow pores and consequently enhance the device performance.
The next challenge is to integrate the information obtained from equilibrium and nonequilibrium molecular simulations into continuum approaches that describe charge–discharge cycles in realistic models of electrodes. Bazant and co-workersReference Bazant, Storey and Kornyshev65 proposed that the modified Poisson–Nernst–Planck model be solved while accounting for ion–ion and ion–electrode correlations through appropriate parameters.Reference Alijó, Tavares, Biscaia and Secchi66 Future improvements should account for pore-entrance effects, ion diffusion within various pores, and the eventual presence of preferential adsorption sites within the porous carbons. Because complex electrolytes are often used in EDLCs and multivalent ions can be found in salty water, it will be critical to include in these approaches details regarding the hydration of both ions and hydrophobic compounds.
Conclusions
The enormous progress made in the development of computing power, algorithms, and force fields allows modern researchers to implement molecular simulations to investigate interfacial water. Although the results must be handled and interpreted with care, as pitfalls are often possible, the picture provided by simulation results seems, in most cases, to be consistent, sometimes even quantitatively, with experimental observations. More research needs to be conducted before simulation results can be trusted blindly, but the state of the art already suggests that in addition to providing valuable tools for interpreting experimental observations, simulations could be used to explore new phenomena and perhaps guide experiments toward the development of new materials and processes. Efforts devoted to relating the properties of interfacial water to the self-assembly of nanostructured materials, designing advanced separation strategies, and contributing to the solution of the water–energy nexus could bear fruit in the not-too-distant future.
Acknowledgments
The author is grateful to several agencies for generous financial support. In particular, the US Department of Energy, the US National Science Foundation, the Alfred P. Sloan Foundation (via the Deep Carbon Observatory), and the EU Marie Curie Career Integration Grant are thankfully acknowledged.