The αs1-casein gene is a highly polymorphic one, especially in goats (Boulanger et al. Reference Boulanger, Grosclaude and Mahé1984). This high degree of polymorphism has been identified both in Continental European breeds (Grosclaude et al. Reference Grosclaude, Mahé, Brigonon, Di Stasio and Jeunet1987) and in Spanish ones (Serradilla, Reference Serradilla2002). Seven allelic variants were initially detected, classified according to their contribution to lactic protein into four groups: alleles A, B and C with a high level of milk protein synthesis (3·6 g/l), allele E with an intermediate level (1·6 g/l), allele F with a low level (0·6 g/l), and the null allele (0·0 g/l) (Grosclaude et al. Reference Grosclaude, Mahé, Brigonon, Di Stasio and Jeunet1987). In more recent reviews examining the gene at the DNA level, up to 18 allelic variants have been described, classified into the same four expression groups (Sacchi et al. Reference Sacchi, Chessa, Budelli, Bolla, Ceriotti, Soglia, Rasero, Cauvin and Caroli2005).
In a previous study, De la Torre et al. (Reference De la Torre, Serradilla, Gil and Sanz2008) used goats belonging to genotypes of high and low capacity for milk αs1-casein synthesis, and sought to determine whether the production and composition of the milk, according to the genotype, was related to differences in the nutritional utilization of the diet. At the same time, since the opinion of the authors is that it is also necessary to clarify whether the protein requirements of the animals depend on the corresponding genotype, the study took into consideration two levels of protein. A greater voluntary feed intake, on a metabolic body weight basis, among the goats with a high capacity for αs1-casein synthesis, was identified as possibly the prime factor determining milk production. The study also revealed a higher level of feed utilization at the metabolic level for N and for energy intake, these effects being dependent on the level of protein in the diet, thus indicating interactive effects.
In this respect, although some information is available on the production of goat milk depending on the genotype associated with the synthesis of αs1-casein in milk and on the level of protein in the diet (Schmidely et al. Reference Schmidely, Meschy, Tessier and Sauvant2002; De la Torre et al. Reference De la Torre, Serradilla, Gil and Sanz2008), the possible interaction between the factors remains unknown. The aim of the present study was to examine this question. For this purpose, goats of the Malagueña breed were used, belonging to genotypes for either a low or a high capacity to synthesize αs1-casein in milk. The goats were fed two different diets varying in protein content, and the milk production and composition were analysed, together with the yields of the principal milk components.
Material and Methods
Experimental design and procedure
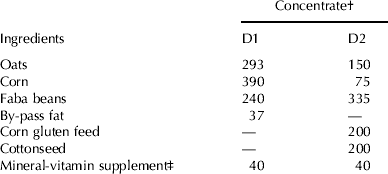
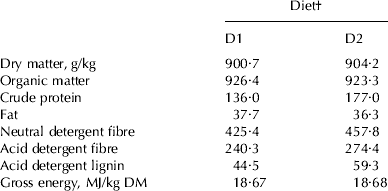
Twenty Malagueña goats, from four herds, midway through their second, third or fourth lactations, were used. Ten of these animals had genotypes (7 BB and 3 AB) associated with a high level of αs1-casein in milk (HG goats) and the other ten had genotypes (7 EF and 3 FF) associated with a low level of this casein in milk (LG goats). Each genotype group was made up of goats from all four herds in order to randomize the genetic backgrounds. The strong effect of this gene, which accounts for more than 40% of the genetic variation (Barbieri et al. Reference Barbieri, Manfredi, Elsen, Ricordeau, Bouillon and Grosclaude1995), together with the randomization of the genetic backgrounds of the goats in each of the two groups, precluded the assigning of observed differences to genetic causes other than the αs1-casein genotype. Blood samples were taken from 300 animals for genotypes, following the protocol developed by Amills (Reference Amills1996). The animals were fed two diets differing in their crude protein (CP) content, 136 g/kg (D1) and 177 g/kg (D2) of dry matter (DM). The proportion of rumen degradable protein in the diets was very similar (74·6±0·6%). The experimental design consisted of two trials. In trial 1, the HG goats were used, with the two different diets being provided in a two-period balanced change-over design; within each period, half of the animals were fed D1 and the other half, D2. In trial 2, the same procedure was implemented for the LG animals. Each goat received, at the same time and in separate containers, a daily ration consisting of 1·0 kg of forage and 1·0 kg of concentrate; the specific N, energy and mineral requirements of this species were considered in the dietary formulation (Aguilera et al. Reference Aguilera, Prieto and Fonollá1990; NRC, 2007). The forage fraction of the diets consisted of long alfalfa hay (700 and 800 g per animal per day for D1 and D2, respectively) and barley straw (300 g and 200 g per animal per day for D1 and D2, respectively). Table 1 shows the ingredient composition of the concentrates and Table 2 shows the chemical composition of the diets. Each period lasted 21 d; the first 14 d were for adaptation, while the final 7 d constituted the main trial period. The total duration of the experiment (42 d) was located in the middle of lactation, beginning at 84±1·9 days in milk. During the whole period, the animals were kept in individual boxes. The goats were hand milked daily at 9.00 after the orts from the previous day had been collected; daily rations were fed immediately thereafter. Water was available at all times.
Ingredient composition of the concentrates (g/kg)
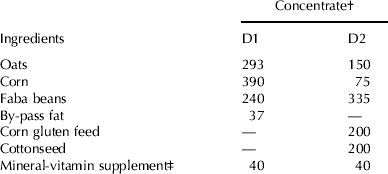
† Concentrate: D1=136 g/kg crude protein; D2=177 g/kg crude protein
‡ Mineral-vitamin supplement composition (g/kg): 58 Ca, 171 P, 250 NaCl, 23 Fe, 3 Cu, 15 Zn, 12 Mn, 30 Mg, 0·5 Co, 20 vitamin A, 1·3 vitamin D3, 13 vitamin E, 8 nicotinic acid, 2·5 vitamin B1, B2 and B12 (Musal Laboratory, Granada, Spain)
Chemical composition of the diets (g/kg dry matter, DM)
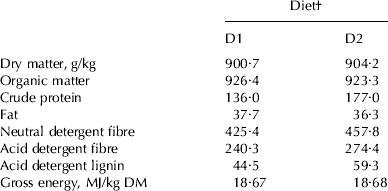
† Diet: D1 and D2 with 136 and 177 g/kg crude protein in DM
Measurements and analysis
Every day of the main trial period, samples of forage and concentrate were collected and stored at −20°C until analysis. Similarly, the milk produced by each animal was collected and quantified individually and samples with no added preservatives were stored at −30°C until analysis.
The DM content of the feedstuffs was determined (AOAC, 2005) and the N content assessed by the Kjeldhal method (AOAC, 2005). These latter values were converted to CP by multiplying by 6·25. Neutral detergent fibre, acid detergent fibre and acid detergent lignin contents of the feeds were determined (Van Soest et al. Reference Van Soest, Robertson and Lewis1991) and the fat content was evaluated, after hydrochloric hydrolysis, by extraction with petroleum ether (boiling point, 40–60°C; Sanderson, Reference Sanderson, Haresign and Cole1986). The ash content was determined by incineration at 550°C and the energy content by adiabatic bomb calorimetry. The total solids content of the milk was determined by lyophilization and the N content by the Kjeldahl method (AOAC, 2005). The protein-N content of the milk samples was calculated as the difference between total N and non-protein N. Total N was determined from whole milk samples and non-protein N from a filtrate of whole milk after precipitation with 12% (w/v) trichloroacetic acid. Casein N content was calculated as the difference between total N and non-casein N. Non-casein N was determined from a filtrate of whole milk after precipitation with 10% (w/v) acetic acid at a pH of 4·1 (Recio et al. Reference Recio, Pérez-Rodríguez, Amigo and Ramos1997). Whey protein-N content was calculated as the difference between total protein-N and casein-N. Protein-N, casein-N and whey protein-N values were converted to protein, casein and whey protein by multiplying by 6·38. The milk fat content was measured by the Gerber method (Pearson, Reference Pearson1976). Milk lactose was calculated as the difference between the amount of total solids and protein plus fat plus total ash. The ash content was determined by incineration in an electric muffle furnace at 550°C.
Milk protein contents of αs1-casein and αs2-casein were established by the NIRS methodology (Burns & Ciurczak, Reference Burns and Ciurczak1992, Reference Burns and Ciurczak2001; Gómez Ruiz et al. Reference Gómez Ruiz, Miralles, Agüera and Amigo2004). Milk fat fatty acid profile was determined using lyophilized milk samples, which were subjected to a process of extraction and esterification (Sukhija & Palmquist, Reference Sukhija and Palmquist1988). Fatty acid methyl esters were separated in an Autosystem GC (Perkin-Elmer, Norfolk CT, USA) (Sanz Sampelayo et al. Reference Sanz, Fernández, Ramos, Hermoso, Gil and Boza2006).
Statistical analysis
Data from both trials were analysed in common by the use of a 2×2 factorial arrangement. When the interaction term between factors was not statistically significant (P>0·05) least squares means were calculated from the model after this term was omitted (Steel & Torrie, Reference Steel and Torrie1980). The dependent variables in the model were milk production and milk composition. Duncan's multiple range test (P<0·05) was used to determine the differences between the means.
Results
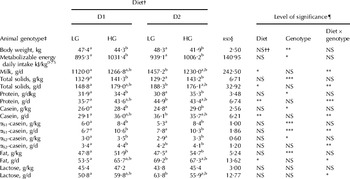
Table 3 shows the results obtained for body weight, metabolizable energy (ME) intake and milk production and composition, by diet consumed and animal genotype, as well as the results of the statistical analysis. Body weight was affected by the genotype (P<0·05), being greater for LG goats. Daily ME intake, expressed according to metabolic body weight (kg0·75) was affected by the genotype (P<0·05), being greater for HG goats. Diet affected (P<0·05) milk production and the yields of total solids, protein, casein and fat. Higher values were obtained for the goats in the D2 group. Genotype affected (P<0·05) total solids, protein, casein, αs1-casein, αs2-casein and fat concentration as well as the αs1-casein yield. All these values were higher for HG goats. The interaction between the factors for milk production and protein, casein, αs1-casein, αs2-casein and fat yield values was significant (P<0·05). For milk production, this interaction reveals that the values in the D2 group were higher than those in the D1 group, for LG goats. However, the interaction between the factors for total solids, protein, casein, αs1-casein, αs2-casein and fat yields indicates that the values for the HG goats were higher than those for the LG goats when D1 was consumed.
Effect of type of diet and animal genotype on body-weight, energy intake and on milk yield and composition

† Diet: D1=136 g/kg crude protein; D2=177 g/kg crude protein
‡ Animal genotype: LG=group of goats with low capability for synthesis of αS1-casein; HG=group of goats with high capability for synthesis of αs1-casein
§ rsd=residual standard deviation
¶ Diet=main effect of diet; Genotype=main effect of animal genotype; Diet×genotype=diet×animal genotype interaction
†† P>0·05; *P<0·05; **P<0·01; ***P<0·001
a,b values without a common letter are different
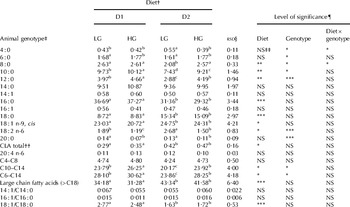
Milk fat fatty acid composition is given in Table 4. Diet affected (P<0·05) levels of 8:0, 10:0, 12:0, 16:0, 18:0, 18:1, 18:2, total conjugated linoleic acid (CLA), C10–C14, C6–C14, total long chain fatty acids (C>18) and the 18:1/18:0 ratio. Higher values were obtained for the goats in the D1 group for 8:0, 10:0, 12:0, 16:0, C10–C14, C6–C14 and the 18:1/18:0 ratio. However, higher values were obtained for the goats in the D2 group for 18:0, 18:1, 18:2, total CLA and total long-chain fatty acids. Genotype affected (P<0·05) levels of 4:0, 6:0, 8:0, 10:0, 12:0, 18:2, 20:0, C10–C14 and C6–C14. Higher values were obtained for the LG goats for 4:0, 12:0, 18:2 and 20:0. However, higher values were obtained for the HG goats for 6:0, 8:0, 10:0, C10–C14 and C6–C14. The interaction between factors for levels of 4:0 and 8:0 was significant (P<0·05). For the LG goats, higher values were obtained for 4:0 when D2 was consumed. However, for the HG goats, higher values were obtained for 8:0 when D2 was consumed.
Effect of type of diet and animal genotype on milk fatty acid concentrations (g/100 g total fatty acids)

† Diet: D1=136 g/kg crude protein; D2=177 g/kg crude protein
‡ Animal genotype: LG=group of goats with low capability for synthesis of αs1-casein; HG=group of goats with high capability for synthesis of αs1-casein
§ rsd=residual standard deviation
¶ Diet=main effect of diet; Genotype=main effect of animal genotype; Diet×genotype=diet animal genotype interaction
†† CLA total (cis-9, trans-11+trans-10, cis-12 isomers); cis-9, trans-11 CLA was the major isomer present. Because the trans-10, cis-12 isomers was not always detectable it was combined with the cis-9, trans-11 isomer for total CLA
‡‡ P>0·05; *P<0·05; **P<0·01; ***P<0·001
a,b,c,d values carrying different letters are different
Discussion
Despite the effect of the genotype on the body weight of the animals, changes within each group, between the start and end of the trial, were less than ±0·60 kg, which could simply be the result of differences in gut fill. In this respect, in a study of cows, McGilloway & Mayne (Reference McGilloway, Mayne, Wisseman and Garnsworthy2002) used animals of high genetic merit and reported that absorbed nutrients are apportioned more to milk production than to accretion of body weight, with these values tending to decrease, especially at the start of lactation. According to the results obtained in a earlier study part of the same experiment (De la Torre et al. Reference De la Torre, Serradilla, Gil and Sanz2008) there does not appear to be any special direction of absorbed nutrients towards milk production. What was concluded in this case was that the HG goats showed a clearly better utilization of both N and energy intake. The higher rate of energy intake measured for HG goats was highlighted by De la Torre et al. (Reference De la Torre, Serradilla, Gil and Sanz2008) as the prime cause of the differences in milk production between genetic groups. In accordance with the energy directed to milk (De la Torre et al. Reference De la Torre, Serradilla, Gil and Sanz2008) and the animals' energy intake, the requirements for maintenance and their respective efficiencies in utilizing the ME intake, both for milk production and for its retention within the body (Aguilera et al. Reference Aguilera, Prieto and Fonollá1990), it is deduced that independently of the consumed diet, the energy balance for both the LG and the HG goats was positive, with estimated mean values of 95·0 and 121·2 kJ/kg0·75 per day for LG and HG goats, respectively.
With respect to the effect of the level of dietary protein, Morand-Fehr et al. (Reference Morand-Fehr, Sanz, Fedele, Le Frileux, Eknaes, Schmidely, Giger-Reverdin, Bas, Rubino, Havrevall and Sauvant2000) reported that in goats, raising the level of protein in the diet usually leads to an increase in milk yield, while its protein level remains unchanged. Schmidely et al. (Reference Schmidely, Meschy, Tessier and Sauvant2002), using Alpina and Saanen-breed goats, with high and low capacities for αs1-casein synthesis, fed diets of diverse protein levels, found that when the protein level in the diet was increased, milk production rose with no effect on protein content. With regard to the effect of the genotype on milk production, available information is somewhat contradictory. Mahé et al. (Reference Mahé, Manfredi, Ricordeau, Piacere and Grosclaude1994) and Schmidely et al. (Reference Schmidely, Meschy, Tessier and Sauvant2002) found no significant differences but, on the contrary, Barbieri et al. (Reference Barbieri, Manfredi, Elsen, Ricordeau, Bouillon and Grosclaude1995) reported higher values in animals with a low capacity for αs1-casein synthesis. In accordance with this information, and taking into account the results presented in the present paper, it may be concluded that LG goats, when D1 is replaced by D2, present the response normally expected of goats, with higher levels of milk production and an unchanged protein level. HG goats, however, diverged from this pattern; when the D1 diet was provided, HG goats produced the same quantity of milk as did LG goats, but owing to the greater capacity of the former for milk protein synthesis, protein levels in their milk were higher. When the diet was changed to D2, protein levels remained unchanged as did the quantity of milk produced. This finding would suggest that when HG goats achieved their maximum capacity for milk protein production, an increased content of dietary protein would have had no effect on the quantity of milk produced or on its protein content.
The results here obtained for HG and LG goats, with respect to the concentration of the various components in the milk, are well known, and have been confirmed for different breeds of goats (Mahé et al. Reference Mahé, Manfredi, Ricordeau, Piacere and Grosclaude1994; Trujillo et al. Reference Trujillo, Jordana, Guamis, Serradilla and Amills1998; Angulo et al. Reference Angulo, Ares, Amills, Sánchez, Ilahi and Serradilla2002; Schmidely et al. Reference Schmidely, Meschy, Tessier and Sauvant2002; Serradilla, Reference Serradilla2002; Chilliard et al. Reference Chilliard, Rouel and Leroux2006). In the present case, and independently of the diet consumed, the average protein concentration was found to be 3·5 g/kg higher in the HG goats than in the LG goats. This value is somewhat lower that might have been expected from the results obtained for other breeds (Barbieri et al. Reference Barbieri, Manfredi, Elsen, Ricordeau, Bouillon and Grosclaude1995; Schmidely et al. Reference Schmidely, Meschy, Tessier and Sauvant2002), the differences possibly arising from the effect of the breed in question (Angulo et al. Reference Angulo, Ares, Amills, Sánchez, Ilahi and Serradilla2002) as well as from effects of the stage of lactation (Schmidely et al. Reference Schmidely, Meschy, Tessier and Sauvant2002). The effect of genotype associated with the level of αs1-casein in milk on the milk fat level is well established (Barbieri et al. Reference Barbieri, Manfredi, Elsen, Ricordeau, Bouillon and Grosclaude1995; Manfredi, Reference Manfredi2003; Chilliard et al. Reference Chilliard, Rouel and Leroux2006). With respect to this apparent relation between the gene for αs1-casein and the level of milk fat, Leroux et al. (Reference Leroux, Le Provost, Petit, Bernard, Chilliard and Martin2004) are of the opinion that this is not due to differences in the expression of the key enzymes involved in lipogenesis, but represents an effect linked to the expression of some genes that encode the proteins in the membrane of fat globules.
Beyond doubt, and reflecting interactions among the relevant factors, the information provided by the present study concerning the yields of the principal milk components (total solids, protein, casein, αs1-casein, αs2-casein and fat) is the most striking result concerning the productive behaviour of each group of animals in accordance with the diet consumed. Concerning the results obtained in other studies, those reported here cannot be compared with those obtained by Schmidely et al. (Reference Schmidely, Meschy, Tessier and Sauvant2002) who according to the experimental design only deduced the mean values corresponding to each genotype or to each diet. With respect to the underlying causes of these results, we must consider those obtained by De la Torre et al. (Reference De la Torre, Serradilla, Gil and Sanz2008) who concluded that HG goats, given D1, consumed more feed per unit of metabolic weight than LG goats whilst at the same time showing a greater utilization of N, digestible energy and ME available for milk production. These aspects disappeared almost completely when the diet was changed to D2. A notable result is the fact that the αs2-casein values were affected by the factors in question, like those of αs1-casein. This could reflect the fact that the different αs-casein fractions in goat milk bear a certain degree of similarity in their amino acid profile (Park, Reference Park, Park and Haenlein2006).
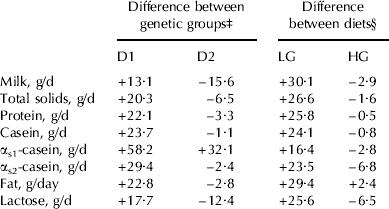
The present study confirms that, in the case of the HG animals, milk production and the yields of the milk components depend on the level of protein in the diet; this should be taken into consideration with a view to modulating genetic expression by means of nutrition. On the basis of the results obtained, we considered what would occur by promoting, within the same genetic group, a change of diet from D1 to D2; alternatively, within the same diet, by promoting a change from LG goats to HG goats. Table 5 (derived from the values shown in Table 3), shows what would occur in these situations. Of the four cases, the first one (in which, when the D1 diet is provided, we assume a change from LG to HG goats) is clearly positive. Together with an increase in milk production, the yields of the different components are distinctly higher, especially for the αS1-casein fraction – and this is achieved with the diet that is lowest in protein content, i.e. the most economical one. The second case that, in principle, could be considered positive, would be that involving the use of LG goats and with their diet being changed from D1 to D2. This would achieve an evident increase in milk production, together with equally marked rises in the values of the yields of different milk components, but with the lowest such rise being in the quantity of αs1-casein. These results would be achieved at the cost of employing a diet that is richer in protein and therefore more costly. On the other hand, providing D2 and replacing LG goats by HG ones would produce a fall in milk production, together with slight falls in the values of the different yields, except in the case of αs1-casein, which would increase by >30%. From this we deduce that, even when the production of milk protein is somewhat lower, changing from LG to HG goats would stimulate the production of a greater amount of αs1-casein, owing to the genetic capacity of the latter animals. The use of HG goats and changing the animals' diet from D1 to D2 would clearly be disadvantageous. With this diet, richer in protein and therefore more costly, except for fat yield, it would have somewhat negative effects on the production of the other milk components.
Changes in values for goats with low (LG) or high (HG) capability for synthesis of αs1-casein and fed D1 (13·6% crude protein in drymatter) or D2 (17·7% crude protein in the dry matter)Footnote †
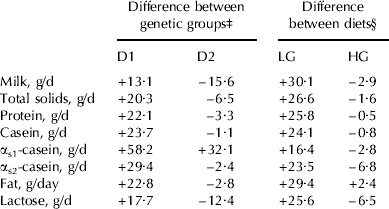
† Values are presented for interactions between factors (diet×genotype) at P<0·05
‡ Values are reported as mean differences between genetic groups expressed as percentage [(HG−LG)/LG]×100
§ Values are reported as mean differences between diets expressed as percentage [(D2−D1)/D1]×100
The effects reported concerning the fatty acid profile of the milk fat, which vary depending on the genotype of the animal, agree with those reported by others. Sauvant et al. (Reference Sauvant, Bas, Ternois and Ricordeau1993) commented that under a positive energy balance, the levels of short- and medium-chain fatty acids are higher in the milk fat from animals with a greater capacity for αs1-casein synthesis. Similarly, Lamberet et al. (Reference Lamberet, Degas, Delacroix-Buchet and Vassal1996) stated that the proportion of short-chain fatty acids is normally higher in the milk fat of animals with a high capacity for αs1-casein synthesis. Schmidely et al. (Reference Schmidely, Meschy, Tessier and Sauvant2002) also reported this effect of the genotype on the short- and medium-chain fatty acids in the milk fat. Chilliard et al. (Reference Chilliard, Rouel and Leroux2006) studied a large number of goats and concluded that the levels of at least 17 fatty acids in the milk fat differed, depending on the animals' capacity for the synthesis of αs1-casein. The results published by these authors suggest that the milk fat produced by animals with a high such capacity for synthesis contains higher levels of medium-chain fatty acids, and lower levels of palmitic, stearic, oleic, linoleic, linolenic and rumenic acid. Our own results coincide with these, as regards medium-chain fatty acids and linoleic acid, but we found no differences by genotype for the levels of palmitic, stearic and oleic acid and total CLA. Chilliard et al. (Reference Chilliard, Rouel and Leroux2006) also analysed the values of ▵9-desaturation rations corresponding to different fatty acids; these values were found to be higher in the case of the animals with a low capacity for αs1-casein synthesis. In the opinion of these authors, this suggested the existence of greater desaturase activity in the mammary gland, which might compensate for the lower secretion of medium-chain fatty acids by these animals. In our study, the ▵9-desaturation rations were calculated for 14:0, 16:0 and 18:0, and in no case did we observe any genotype effect, although when the D1 diet was provided, the values tended to be higher for the animals with low capacity for αs1-casein synthesis. The smaller number of animals utilized, together with the fact that two different diets were provided, could explain why the above-mentioned effect was not detected in our study. The fact that the fatty acid profile varies depending on the genotype is difficult to explain because, as remarked above, the association between the polymorphism of αs1-casein and the milk fat content does not seem to depend on differences in the expression of the key enzymes associated with lipogenesis (Leroux et al. Reference Leroux, Le Provost, Petit, Bernard, Chilliard and Martin2004). However, even if these key enzymes are not involved, others could be related to the expression of a given protein and could intervene in the regulation of lipogenesis (the synthesis de novo of fatty acids) which would make it logical that, as well as higher levels of fat production, there should be higher levels of short- and medium-chain fatty acids. The effects reported, with respect to the diet consumed, would thus reflect the particular composition of the ingredients of each one. Thus, the milk fat produced when the D1 diet was consumed contained higher levels of palmitic acid, according to the by-pass fat of this diet (a calcium soap of palm fatty acid distillate; Megalac, Norel SA, Madrid, Spain). On the contrary, the milk fat obtained when D2 was provided contained higher levels of stearic, oleic and linoleic acid, all of which are present in the cotton seed included in the D2 (De Blas et al. Reference De Blas, Mateos and Rebollar1994).
Conclusions
We conclude that there are interactions between the diet provided and the animals' genotype; with D1, the HG goats are more productive than the LG ones, but this is not the case with D2. On the contrary, the LG goats show a higher productive capacity when D1 is replaced by D2. Independently of the diet consumed, the milk produced by the HG goats always contained a higher level of αs1-casein.
The milk fat produced by the HG goats presented higher levels of medium-chain fatty acids.
We are very grateful to Dr M Amill (Department of Genetics and Animal Improvement. Autonomous University of Barcelona, Spain), for his advice concerning the genotype determination of the samples. This study was supported financially by the Spanish Ministry of Science and Technology. (Project: INIA: RTA02-020).