Implications
The genetic parameters of endocrine fertility traits (measured from milk progesterone) and hyperketonemia (measured from milk β-hydroxybutyrate (BHB)) in early lactation were evaluated and compared with traditional fertility traits and the milk yield in dairy cattle. Traditional fertility traits are commonly used in breeding schemes even though they are highly influenced by management decisions and have low heritabilities. Heritability estimates for endocrine fertility traits were higher than for traditional fertility traits, consequently data on fertility traits measured by automatic systems is a promising tool for improving fertility, specifically when more data are available. For hyperketonemia traits, heritability estimates were quite low.
Introduction
Good fertility is an important determinant of dairy production efficiency. Nordic total merit (NTM) aims for healthy, fertile, well-producing and long-lasting cows (NAV, 2018). For red dairy cattle (RDC), the relative weight for yield represents currently about 33% of the total merit. The correlation between yield index and NTM is 0.63, whereas the correlation between fertility index and NTM is 0.22. Hence considerably greater genetic response can be expected on production traits. Many previous studies have shown an unfavorable genetic correlation between milk production and fertility traits (e.g. Berry et al., Reference Berry, Wall and Pryce2014). Detecting the heats and inseminating the cows at the correct time is crucial for achieving high conception rates. In addition, high yielding cows are susceptible to ketosis, a metabolic disorder, which has been associated to descended health, fertility and milk production (e.g. Duffield, 2009). Insemination measurements, such as the interval from calving to the first insemination (CFI), are generally used to evaluate cow’s ability of returning to cyclicity after calving. However, insemination traits are highly influenced by management decisions and tend to have low heritabilities (e.g. Berry et al., Reference Berry, Wall and Pryce2014). Instead, endocrine fertility traits are more accurate and have been found to have higher heritabilities than traditional fertility traits (Royal et al., Reference Royal, Flint and Woolliams2002; Petersson et al., Reference Petersson, Berglund, Strandberg, Gustafsson, Flint, Woolliams and Royal2007).
DeLaval Herd Navigator™ (HN; DeLaval International, Tumba, Sweden) management program samples and analyses four biological parameters (progesterone, BHB, lactate dehydrogenase and urea) in milk automatically during milking. HN uses frequent progesterone (P4) measurements to determine the reproduction status of the cow and detect the heat. If frequent P4 measurements are used, heat can be identified accurately even if the cow is not showing any visible signs of heat. Progesterone is sampled at varying intervals depending on the cow’s estrus cycle (Friggens et al., Reference Friggens, Bjerring, Ridder, Højsgaard and Larsen2008).
Hyperketonemia or ketosis is primarily found in early lactation and is caused by a severe negative energy balance. In subclinical ketosis, no clinical signs can be seen but ketone body concentrations, such as BHB, increase in the blood, urine and milk (e.g. Koeck et al., Reference Koeck, Jamrozik, Schenkel, Moore, Lefebvre, Kelton and Miglior2014). Concentrations of BHB in the blood have been used to diagnose hyperketonemia (Duffield, 2009) but this procedure is not practical and suitable for routine analysis. Previous studies have shown a high correlation between blood and milk BHB (Denis-Robichaud et al., Reference Denis-Robichaud, Dubuc, Lefebvre and DesCôteaux2014) and that milk BHB is a useful tool for diagnosing hyperketonemia (e.g. Koeck et al., Reference Koeck, Jamrozik, Schenkel, Moore, Lefebvre, Kelton and Miglior2014). In previous studies, lower conception rates have been found for cows with larger BHB concentrations than for healthy cows (e.g. Blom et al., Reference Blom, Christensen and Ridder2015). The incidence of clinical ketosis is low in Finland, in a study by Rajala-Schultz et al. (Reference Rajala-Schultz, Grohn and McCulloch1999) the incidence for Finnish Ayrshire was 3.3% and in the 2016 national dairy cattle health recording results (treatments by veterinarians) even lower being 1.04% (Faba, 2017). However, subclinical ketosis is more common, is not recorded, and can be costly to farmers as it has a negative effect on cows overall performance (Duffield et al., Reference Duffield, Lissemore, McBride and Leslie2009).
Traditional fertility traits and clinical ketosis are currently included in the Nordic breeding goal. For fertility traits, CFI, interval from first to last insemination (IFL), number of inseminations, non-return rate, conception rate and heat strength (data only from Sweden) are included, the heritability estimates for these traits are very low varying from 0.015 to 0.04 for first parity RDC cows. Heritability for clinical ketosis is 0.01 for first parity RDC cows.
The objective of this study was to estimate the genetic parameters of endocrine (P4) fertility traits and hyperketonemia (measured from milk BHB concentrations) in early lactation measured by the HN system and compare these traits with the traditional fertility traits (CFI, interval from calving to the last insemination (CLI) and IFL) and milk yield in Nordic RDC herds in Finland.
Materials and methods
In this study HN data from P4 and BHB concentrations from 14 Finnish dairy farms were provided by Lattec I/S (Hillerød, Denmark). Data were available from 2014 to 2017 although for six herds data were available from 2015 onwards and for three herds only from 2016. Milk P4 data (17 to 365 days postpartum) included 2531 observations from 1622 RDC cows from parities 1 to 3. Some of the cows had records from multiple parities and the average number of observations per herd was 181 (range 15 to 795). For endocrine fertility traits, early lactation observations within 100 days postpartum were included in the analysis. In this data set, many cows which had observation for the second and/or third parity were missing the first parity record due to recent investment to HN. Including animals with only later parity records can lead to biased estimates of genetic parameters, since information on selection process is missing. Therefore, genetic analyses were performed only for the first parity cows in this study.
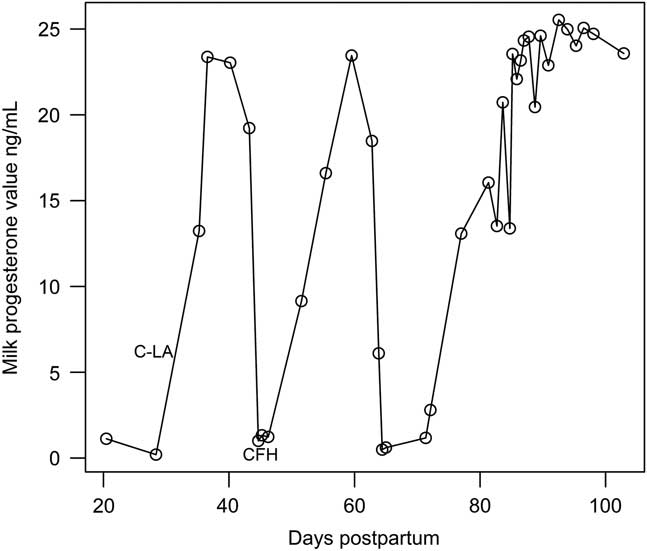
HN starts to record and analyze P4 concentrations from ca. 20 days after calving and uses immunoassay based dry-stick technique (Samsonova et al., Reference Samsonova, Safronova and Osipov2015). An extended Kalman filter is used to smooth the raw P4 values and a biological model is applied to predict the cows’ reproduction status (Friggens et al., Reference Friggens, Bjerring, Ridder, Højsgaard and Larsen2008). Cows are classified to three categories based on their reproduction status (0=postpartum anestrus, 1=estrus cycling and 2=potentially pregnant), additionally time (days) to the next sample is defined based on the reproduction status (Friggens et al., Reference Friggens, Bjerring, Ridder, Højsgaard and Larsen2008). Two P4 traits were studied, days from calving to the first heat (CFH, restricted to ⩽100 days) identified by HN system and commencement of luteal activity (C-LA, restricted to ⩽100 days). C-LA was calculated as a reproduction status change from 0 to 1 or 2 and it is assumed to describe accurately the first real heat since it is measured within a few days after the first heat has occurred. The CFH is difficult to detect from the P4 curve, since the P4 concentrations tend to be constantly low after calving (Figure 1). Hence, the model identifies P4 concentration change from high to low, determines passed heat and will be searching for new heat from around 17 to 18 days later. Therefore, CFH is recorded when the progesterone concentration changes from high to low and it actually describes the second real heat after calving.
Milk progesterone curve of a hypothetical dairy cow, used to define endocrine fertility traits. Commencement of luteal activity (C-LA) occurs few days after the first ovulation and the calving to the first heat identified by Herd Navigator (CFH) is recorded when the concentration changes from high to low

Insemination and pedigree data for the 14 HN farms studied were provided by Faba Coop (Vantaa, Finland). Three traditional fertility traits were analyzed, the CFI (days) (restricted to ⩽230 days), CLI (days) (restricted to ⩽365 days) and IFL (days). Two different datasets with different trait groups were created, first data set included CFH and traditional fertility traits (CFI, CLI, IFL) and second data set had observations for CFH, C-LA, milk yield (5 to 70 days postpartum) and two ketosis traits derived from smoothed BHB values (5 to 60 days postpartum).
For first parity cows, smoothed BHB values, based on prior measurements, between 5 and 60 days postpartum were used in the analysis. Cows (16 animals) with less than four BHB records were removed after which total of 16 851 observations from 794 first parity cows remained. The mean number of observations were 21.2 (range 4 to 55). Two BHB traits were defined which divided observations into three levels (0/1/2) with slightly different BHB thresholds (ket_s1 and ket_s2) to describe the cows’ hyperketonemia status. In ket_s1 the value ‘negative’ implied that milk BHB <0.10 mmol/l; animals with 0.10⩽ milk BHB <0.20 mmol/l were ‘suspect’ and animals with milk BHB ⩾0.20 mmol/l were ‘positive’. Thresholds used for ket_s2 were: negative (milk BHB <0.15 mmol/l), suspect (0.15⩽ milk BHB <0.20 mmol/l) or positive (milk BHB ⩾0.20 mmol/l). These thresholds were chosen based on the previous studies where BHB values between 0.10 and 0.20 mmol/l have been used (e.g. Denis-Robichaud et al., Reference Denis-Robichaud, Dubuc, Lefebvre and DesCôteaux2014; Koeck et al., Reference Koeck, Jamrozik, Schenkel, Moore, Lefebvre, Kelton and Miglior2014). Leblanc (Reference LeBlanc2010) suggested that if individual cows are inspected instead of group-level monitoring 0.20 mmol/l threshold should be used, therefore also binary trait (0/1 trait: ketosis_b) with a threshold of 0.20 mmol/l was studied. Only one, highest, observation per cow was used in the analysis. As BHB baseline can vary among cows due to the diet (Nielsen et al., Reference Nielsen, Hameleers, Young, Larsen and Friggens2010) also two binary (0/1) traits (ket_r1 and ket_r2) based on the ketosis risk values calculated by HN were studied. HN calculates the risk of ketosis (value between 0=no risk and 1=clinical ketosis) with biological models and uses the cow level baseline of BHB (based on first few samples) in the calculations. Based on the literature, the thresholds selected for ketosis risk traits were 55% for ket_r1 and 60% for ket_r2 (e.g. Nielsen et al., Reference Nielsen, Friggens, Chagunda and Ingvartsen2005).
HN data included the information about milk yields from all milkings. The sum of milk yields from 5 to 70 days postpartum was used to study the early lactation milk yield. Cows with less than 60 milking records available were removed from the analysis (because of the fixed time frame of data collection, some cows had either missing beginning of the recording period or end of the period). Most of the cows had milking records for all days in the recording period but in the case of missing records the previous or following record was used in order to get 66 records for all cows. For example, if the recording period ended when cow was on 68-day postpartum the 68-day milk yield was used also for days 69 and 70.
Statistical analysis
Data were analyzed with linear animal models using DMU software (Madsen and Jensen, Reference Madsen and Jensen2013). Fixed effects were chosen based on the models used in Nordic cattle genetic evaluations and the structure of the data. Interactions (e.g. herd×year) were not included because of the small data size. Pedigree was traced four generations back. Univariate and multivariate models were used in genetic analyses. Univariate models were used for all traits in this study. Bivariate model was used to calculate the correlation between endocrine fertility trait CFH and two traditional fertility traits which are included in the NTM (CFI, IFL). Multivariate models, with four traits at the time, were used to calculate the correlations between CFH, C-LA, milk yield and two ketosis traits derived from smoothed BHB values.
In matrix notation, the model was defined as follows:
 $${\bf{y}} {\equals} {\rm X\rbeta} {\plus}{\bf{Z}} _{{\bf{a}} } {\bf{a}} {\plus}{\bf{e}} $$
where y is a vector of observations; β a vector of the fixed effects of herd, calving year, calving month (not for CLI and IFL), first insemination month (for CLI and IFL) and calving age; a is a vector of random animal effects. For single trait analysis a~ N (0,
 ${\bf A}\sigma _{a}^{2} $
) where A is the additive genetic relationship matrix among animals and
 $\sigma _{a}^{2} $
is the additive genetic variance and e is a vector of random residuals (e~ N (0,
 ${\bf I}\sigma _{e}^{2} $
) where I is the identity matrix and
 $\sigma _{e}^{2} $
is the residual variance). X and Z
a
are the corresponding incidence matrices. Calving age was divided into seven classes <24, 24, 25, 26, 27, 28, >28 months.
In multivariate analysis, the variance–covariance structure for animal effects were defined as G=A ⊗ G 0, where G 0 denotes the additive genetic variances and covariance’s between animal effects, ⊗ the Kronecker product and A the additive genetic relationship matrix. Because not all animals had all records available the variance–covariance structures for residual effects were defined as a block-diagonal matrix R=diag(R i ), where R i is the animal specific submatrix depending on the number of available records.
To remove the dependency with the incidence levels, the linear model heritability estimates from binary hyperketonemia traits were converted to underlying scale using Dempster and Lerner (Reference Dempster and Lerner1950) approximation. In hyperketonemia analysis, also a threshold model, using same fixed and random factors as in the linear model, was tested to model binary traits using logit and probit link functions. The heritability estimates for the logit model were calculated using the correction of the residual variance by π2/3, which is the variance of standard logistic distribution.
Results
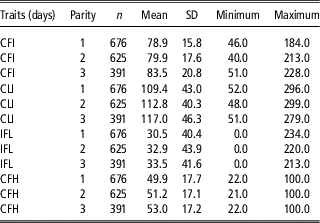
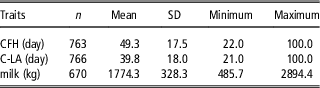
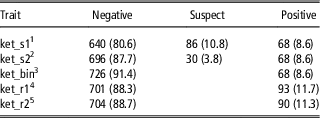
The means for traditional fertility traits and CFH increased together with the parity (Table 1). For C-LA the mean number of days were 39.8 (n=766), 37.7 (n=694) and 40.6 (n=473) for parities 1, 2 and 3, respectively. Most of the cows were inseminated first time to the second heat identified by the HN system (First 17.3%, Second 31.2% and Third 18.5%). The descriptive statistics for endocrine fertility traits and early lactation milk yield used in multivariate analysis with hyperketonemia traits for first parity cows are shown in Table 2. Distribution of the BHB values in hyperketonemia trait classes are shown in Table 3.
Descriptive statistics for CFH and traditional fertility traits for dairy cows

CFI=calving to first insemination restricted to ⩽230 days; CLI=calving to last insemination restricted to ⩽365 days; IFL=interval from first to last insemination; CFH=calving to the first heat identified by Herd Navigator restricted to ⩽100 days.
Descriptive statistics for CFH, C-LA and milk yield used in multivariate analysis with hyperketonemia traits for first parity cows

CFH=calving to the first heat identified by Herd Navigator restricted to ⩽100 days; C-LA=commencement of luteal activity restricted to ⩽100 days; milk=milk yield 5 to 70 days postpartum.
Distribution of hyperketonemia values (%) 5 to 60 days postpartum in different classifications of β-hydroxybutyrate values (BHB) and ketosis risk values for first parity cows

1 Smoothed BHB values (<0.10, ⩾0.10 and <0.20, ⩾0.20).
2 Smoothed BHB values (<0.15, ⩾0.15 and <0.20, ⩾0.20).
3 Smoothed BHB values (<0.20, ⩾0.20).
4 Ketosis risk values (<0.55, ⩾0.55).
5 Ketosis risk values (<0.60, ⩾0.60).
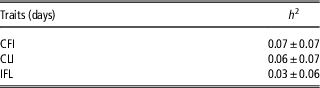
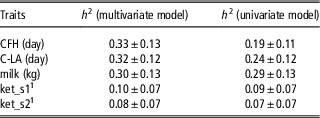
Heritability estimates, analyzed with univariate models, for traditional fertility traits were low and varied between 0.03 and 0.07 in first parity cows (Table 4). The heritability estimates for endocrine fertility traits were higher (Table 5). For first parity cows, the heritability estimates for CFH were 0.19 and 0.33 in univariate and multivariate models, respectively (Table 5). For C-LA, the univariate model heritability estimate for first parity cows (n=766) was 0.24 (Table 5). The heritability estimate for 70 days postpartum milk yield was as expected being 0.29 and 0.30 in the univariate and multivariate analysis, respectively.
Heritability estimates (h 2±SE) from univariate model for traditional fertility traits for first parity cows

CFI=calving to first insemination restricted to ⩽230 days; CLI=calving to last insemination restricted to ⩽365 days; IFL=interval from first to last insemination
Heritability estimates (h 2±SE) for CFH, C-LA, milk yield and hyperketonemia traits for first parity cows

CFH=calving to the first heat identified by Herd Navigator restricted to ⩽100 days; C-LA=commencement of luteal activity restricted to ⩽100 days; milk=milk yield 5 to 70 days postpartum; ket_s1=smoothed β-hydroxybutyrate (BHB) values (<0.10, ⩾0.10 and <0.20, ⩾0.20, restricted 5 to 60 days); ket_s2=smoothed BHB values (<0.15, ⩾0.15 and <0.20, ⩾0.20, restricted 5 to 60 days).
1 Either ket_s1 or ket_s2 were included in the multivariate model.
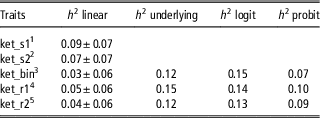
Linear model heritability estimates for ket_s1 and ket_s2 varied between 0.07 and 0.10 and were quite similar in univariate and multivariate analysis (Table 5). The heritability estimates for other hyperketonemia traits were also low (Table 6). Spearman’s rank correlation between ket_s1 and ket_s2, when animals were ordered based on their best linear unbiased predictions, was very high (0.995). Spearman’s rank correlation between ket_r1 and ket_r2 was 0.988 and among the ketosis (ket_s1 and ket_s2) and risk level (ket_r1 and ket_r2) traits varied from 0.950 to 0.961.
Heritability estimates (h 2±SE) for hyperketonemia traits recorded from 5 to 70 days postpartum for first parity cows from univariate analysis

1 Smoothed β-hydroxybutyrate (BHB) values (<0.10, ⩾0.10 and <0.20, ⩾0.20).
2 Smoothed BHB values (<0.15, ⩾0.15 and <0.20, ⩾0.20).
3 Smoothed BHB values (<0.20, ⩾0.20).
4 Ketosis risk values (<0.55, ⩾0.55).
5 Ketosis risk values (<0.60, ⩾0.60).
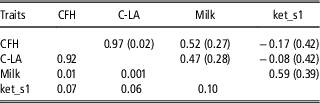
Correlations between the endocrine and traditional fertility traits were positive and favorable. Genetic correlation between CFH and CFI was 0.12±0.55 and between CFH and CLI 0.33±0.54 for first parity cows. Correlation between CFH and C-LA for first parity cows was very high and favorable, genetic correlation being 0.97±0.02 and phenotypic correlation being 0.92 (Table 7). The unfavorable moderate genetic correlations were found between 5 to 70 days postpartum milk yield and endocrine fertility traits (Table 7). Genetic correlations between ket_s1 and endocrine fertility traits (CFH, C-LA) were small, negative and had high standard errors (Table 7). Unfavorable and quite high genetic correlation was found between ket_s1 and postpartum milk yield, however, the estimate had a high standard error (0.59±0.39). Correlations for ket_s2 with endocrine fertility traits and milk yield were similar than for ket_s1.
Genetic (above diagonal) and phenotypic (below diagonal) correlations among CFH, C-LA, milk yield and ket_s1 for first parity cows

Standard errors of estimate in parentheses.
CFH=calving to the first heat identified by Herd Navigator restricted to ⩽100 days; C-LA=commencement of luteal activity restricted to ⩽100 days; milk=milk yield 5 to 70 days postpartum; ket_s1=smoothed β-hydroxybutyrate values (<0.10, ⩾0.10 and <0.20, ⩾0.20, restricted 5 to 60 days).
Discussion
The overall mean for C-LA in first parity cows was 39.9 days which is close to one Tenghe et al. (Reference Tenghe, Bouwman, Berglund, Strandberg, Blom and Veerkamp2015) found for Holstein-Friesian cows in the Netherlands (38.1 days). Bulman and Lamming (Reference Bulman and Lamming1978) indicated that C-LA occurs ca. 5 days after ovulation and can be used to study the interval from calving to first ovulation. Based on previous results, the first ovulation occurred ca. 35 days postpartum in our study. In addition, shorter mean C-LA figures of 24.7 to 33.8 days have been reported in previous studies (e.g. Bulman and Lamming, Reference Bulman and Lamming1978; Petersson et al., Reference Petersson, Berglund, Strandberg, Gustafsson, Flint, Woolliams and Royal2007). Differences between the figures may be due to different breeds, feeding practices, data editing and recording practices. For example, in HN herds the recording of P4 starts 20 days postpartum, whereas in some studies recording can start as early as 10 days postpartum. In addition, previous studies have indicated that declined dairy fertility and population differences can affect the length of this period (e.g. Pollott and Coffey, Reference Pollott and Coffey2008).
In general, traditional fertility traits such as CFI has been used to evaluate cow’s ability of returning to cyclicity and these traits tend to have low heritabilities. In the current study, heritability estimates for traditional fertility traits were low and in similar magnitude than in previous studies. For example, Muuttoranta et al. (Reference Muuttoranta, Tyrisevä, Mäntysaari, Pösö, Aamand, Eriksson, Nielsen and Lidauer2015) found slightly lower heritability estimates for traditional fertility traits in RDC (0.03 for CFI and 0.02 for IFL) and Tenghe et al. (Reference Tenghe, Bouwman, Berglund, Strandberg, Blom and Veerkamp2015) reported slightly higher heritability for CFI (0.11±0.06) in Holstein-Friesian cows. The length of the voluntary waiting period and the visual checks of heats can differ widely among herds which can have an effect on the heritability estimates and lower the accuracy of the traditional fertility traits in dairy genetic evaluations.
In this study, estimated heritabilities for endocrine fertility traits (CFH and C-LA) were higher than for traditional fertility traits (0.19 to 0.33). Because of the small number of animals in the data, some of the estimates had high standard errors indicating limited accuracy of the estimates. The difference between the heritability estimates for CFH between the univariate and multivariate model (0.19 and 0.33) were large most likely due to small data size, which is reflected by the standard errors of the estimates. It is also likely that with production information included the multi-trait models were better able to model the herd-year effects.
However, the magnitudes of the estimates are in line with previous studies where heritability estimates from 0.12 to 0.30 have been reported for endocrine fertility traits (e.g. Royal et al., Reference Royal, Flint and Woolliams2002; Petersson et al., Reference Petersson, Berglund, Strandberg, Gustafsson, Flint, Woolliams and Royal2007; Tenghe et al., Reference Tenghe, Bouwman, Berglund, Strandberg, Blom and Veerkamp2015). In addition, heritability estimates between 0.12 and 0.18 have been reported for traits based on cow activity, such as, calving to the first sign of high activity (CFHA) (Løvendahl and Chagunda, Reference Løvendahl and Chagunda2009; Ismael et al., Reference Ismael, Strandberg, Kargo, Fogh and Løvendahl2015). Endocrine fertility traits reflect better cows’ reproductive physiology and tend to have higher heritabilities than traditional fertility traits and could therefore perform better in dairy breeding schemes. However, P4 are currently available only for the small number of cows and although activity measurements are widely used in management they are seldom collected to central data base. Before they can be used in the national genetic evaluations the recording of these traits should be done more commonly.
For hyperketonemia traits, linear model heritability estimates were low, however, when the threshold model was used for binary traits or when the linear model estimates were transformed to the underlying scale the estimates became slightly higher (0.07 to 0.15).
In a literature review, Pryce et al. (Reference Pryce, Gaddis, Koeck, Bastin, Abdelsayed, Gengler, Miglior, Heringstad, Egger-Danner and Stock2016) reported low heritability estimates for clinical ketosis ranging from 0.01 to 0.16. In previous studies, most of the estimates for milk and serum BHB traits are low or moderate but higher than estimates for clinical ketosis (van der Drift et al., Reference van der Drift, van Hulzen, Teweldemedhn, Jorritsma, Nielen and Heuven2012; Koeck et al., Reference Koeck, Jamrozik, Schenkel, Moore, Lefebvre, Kelton and Miglior2014; Miglior et al., Reference Miglior, Koeck, Jamrozik, Schenkel, Kelton, Kistemaker and Van Doormaal2014; Koeck et al., Reference Koeck, Jamrozik, Kistemaker, Schenkel, Moore, Lefebvre, Kelton and Miglior2016; Lee et al., Reference Lee, Cho, Park, Choi, Kim and Do2016). For example, in a study of Lee et al. (Reference Lee, Cho, Park, Choi, Kim and Do2016) the heritability for milk BHB 30 days postpartum was 0.10 (the average heritability for the first parity was 0.08). In a study of Koeck et al. (Reference Koeck, Jamrozik, Schenkel, Moore, Lefebvre, Kelton and Miglior2014) the heritability of milk BHB between 5 and 40 days postpartum was 0.14 and in a study of van der Drift et al. (Reference van der Drift, van Hulzen, Teweldemedhn, Jorritsma, Nielen and Heuven2012) the heritability of milk BHB between 5 and 60 days postpartum was 0.16. In a study of Miglior et al. (Reference Miglior, Koeck, Jamrozik, Schenkel, Kelton, Kistemaker and Van Doormaal2014) higher heritability estimates for milk BHB were found varying between 0.13 and 0.29 and increasing with days in milk. The differences in the estimates between studies can partly depend on the different traits used, for example, maximum BHB concentration (e.g. Koeck et al., Reference Koeck, Jamrozik, Kistemaker, Schenkel, Moore, Lefebvre, Kelton and Miglior2016), BHB concentration measured at first or some specific test day (e.g. van der Drift et al., Reference van der Drift, van Hulzen, Teweldemedhn, Jorritsma, Nielen and Heuven2012; Koeck et al., Reference Koeck, Jamrozik, Schenkel, Moore, Lefebvre, Kelton and Miglior2014; Lee et al., Reference Lee, Cho, Park, Choi, Kim and Do2016) and classification based on different BHB thresholds (e.g. Miglior et al., Reference Miglior, Koeck, Jamrozik, Schenkel, Kelton, Kistemaker and Van Doormaal2014) have been used in previous studies. Most of the estimates found in literature are based on single or few BHB samples in the postpartum period. Although high sensitivity and specificity have been found in studies comparing milk and blood BHB measurements the use of single BHB values can be misleading if used to divide cows into ketotic or non-ketotic since BHB levels can change considerably between days (Oetzel, Reference Oetzel2007). In the current study, the frequent measurements of BHB were used which is deemed to be more accurate. There were only slight differences in the estimates, and Spearman’s rank correlations between predicted breeding values for different traits were high.
Risk level traits (ket_r1 and ket_r2) had lower heritability estimates than traits based on smoothed BHB concentrations and divided into three classes (ket_s1 and ket_s2), which was expected since continuous values contain more information. Based on the current study and previous studies, where higher heritabilities have been found for milk BHB traits than for clinical ketosis, it seems that including milk BHB traits as indicator traits to the national genetic evaluation for resistance to ketosis could be useful. Identification of animals more susceptible to subclinical ketosis may provide additional ways to producers to reduce costs (e.g. subsequent decrease in health, fertility and production) that would not be identified if only using clinical ketosis.
Genetic correlation between CFH and C-LA for first parity cows was very high (0.97) as expected since both traits are measured from milk P4 concentration and describe the cow’s ability of returning to cyclicity after calving. No previous studies were found where these two traits were compared. Based on these results, both of the studied P4 traits can be used in genetic analysis when analyzing cow’s ability of returning to cyclicity after calving. In this study, CFH was chosen to be used in the multivariate analysis with traditional fertility traits and milk yield. Correlation between CFH and CFI (genetic 0.12±0.55, phenotypic 0.21) for first parity cows was lower than in many previous studies, however, the standard error for this estimate was very high. In previous studies genetic correlations between 0.35 and 0.37 have been found among C-LA and CFI, however, many of these estimates had high standard errors as well (e.g. Nyman et al., Reference Nyman, Johansson, de Koning, Berry, Veerkamp, Wall and Berglund2014; Tenghe et al., Reference Tenghe, Bouwman, Berglund, Strandberg, Blom and Veerkamp2015). Positive genetic correlations indicate that selection for shorter C-LA will also reduce the interval for CFI. On the contrary, Royal et al. (Reference Royal, Flint and Woolliams2002) found a genetic correlation of −0.03±0.27 between the natural logarithm of milk C-LA (lnC-LA) and CFI and Ismael et al. (Reference Ismael, Strandberg, Kargo, Fogh and Løvendahl2015) found very high positive genetic correlation (0.91) between CFHA (based on activity) and CFI.
Moderate genetic correlations (0.47 to 0.52) were found between the endocrine fertility traits and 5 to 70 days postpartum milk yield, which is in line with previous studies where undesirable genetic correlations have been found between milk yield and different fertility traits. For example, the genetic correlations of 0.14 to 0.44 have been reported between CFI and the milk yield (e.g. Hoekstra et al., Reference Hoekstra, van der Lugt, van der Werf and Ouweltjes1994; Tenghe et al., Reference Tenghe, Bouwman, Berglund, Strandberg, Blom and Veerkamp2015). In addition, also unfavorable genetic correlations (0.18 to 0.45) between milk lnC-LA and milk yield have been reported (Royal et al., Reference Royal, Flint and Woolliams2002; Nyman et al., Reference Nyman, Johansson, de Koning, Berry, Veerkamp, Wall and Berglund2014; Tenghe et al., Reference Tenghe, Bouwman, Berglund, Strandberg, Blom and Veerkamp2015). For example, Nyman et al. (Reference Nyman, Johansson, de Koning, Berry, Veerkamp, Wall and Berglund2014) found a genetic correlation of 0.45 between lnC-LA and 60 days postpartum energy corrected milk yield.
In this study, hyperketonemia traits divided into three classes (ket_s1 and ket_s2) seemed to perform better than bivariate traits in the univariate analysis and were included in the multivariate analysis with endocrine traits and 70 days milk yield. In the current study, genetic correlations between hyperketonemia traits (ket_s1 and ket_s2) and endocrine fertility traits were small, negative and had high standard errors. Instead, genetic correlation between hyperketonemia traits (ket_s1 and ket_s2) and 5 to 70 days milk yield were high, however, the standard errors were high as well. In a study by Koeck et al. (Reference Koeck, Jamrozik, Schenkel, Moore, Lefebvre, Kelton and Miglior2014) moderate genetic correlations (0.13 to 0.22) were found between estimated breeding value of milk BHB and milk yield. Genetic associations found between the milk yield and traits measured from milk BHB concentrations are not surprising as selection for high milk production has negative impacts on cows energy balance and demand a larger fat mobilization in early lactation (e.g. Veerkamp et al., Reference Veerkamp, Beerda and van der Lende2003), consequently increasing the risk of hyperketonemia.
Conclusions
Endocrine fertility traits measured from milk progesterone concentration (CFH, C-LA) had higher heritability estimates than traditional fertility traits and the correlation between these traits was very high. Some of the estimates had high standard errors because of the small data size. However, these results suggest that the data on endocrine fertility traits measured by automatic systems is a promising tool for improving fertility, specifically when more data are available. For hyperketonemia traits, heritability estimates were quite low and there were only slight differences between the different traits studied, however, dividing values into three classes instead of two seemed to work somewhat better in the current study. Based on the current study and previous studies, where higher heritabilities have been found for traits based on milk BHB than for clinical ketosis, milk BHB is a promising indicator trait for resistance to ketosis and should be studied more. It is important that this kind of data from automatic devices is made available to recording and breeding organizations in the future.
Acknowledgments
This research is part of FinFert project which is part of inter-Nordic research project NorFert. The main participants are Natural Resources Institute of Finland (Luke) and Helsinki University (HU). Industry partners are Faba Coop, Viking Genetics (VG), Valio Ltd, ProAgria Advisory Center, Nordic Cattle Genetic Evaluation Ltd (NAV) and Lattec I/S. NorFert partners are AU Denmark, SLU Sweden and NMBU Norway. The project is funded by the Development Fund for Agriculture and Forestry (Makera), Faba Coop, VG and Valio Ltd.
Declaration of interest
The authors declare that they have no conflicts of interest.
Ethics statement
HN management program samples and analyses milk progesterone and BHB automatically during routine milking. No ethics statement was thus required.
Software and data repository resources
No data repository resources are available for this publication.