I. INTRODUCTION
In the last few decades, solid electrolytes have gained much interest due to their application in lithium batteries. In particular, sulphide glasses, which are materials with the highest ionic conductivity and better performance, have been reported by many authors, as thin films, Reference Ito, Sakuda, Ohtomo, Hayashi and Tatsumisago1–Reference Yamashita and Yamanaka5 powders, Reference Tatsumisago, Morimoto, Yamashita and Minami6–Reference Agostini, Aihara, Yamada, Scrosati and Hassoun10 and glass-ceramics. Reference Mizuno, Hayashi, Tadanaga and Tatsumisago11,Reference Tatsumisago and Hayashi12 In general, these studies are based on the preparation of Li2S–P2S5 materials, where GeS2, GeSe2, Ga2S3 or SiS2 is introduced to obtain high values of ionic conductivity (<10−4 S/cm). However, the main disadvantage of the materials with Li2S is the low chemical durability that produces a high degradation in air, being necessary the manipulation of these materials in an inert atmosphere. Minami et al. and Ohtomo et al. Reference Minami, Hayashi, Ujiie and Tatsumisago13,Reference Ohtomo, Hayashi, Tatsumisago and Kawamoto14 demonstrated that the introduction of 3 mol% P2O5 and 17–25 mol% Li2O, respectively, in the system of Li2S–P2S5 produces an increase in the ionic conductivity and chemical stability.
On the other hand, in pure oxide glasses, such as the Li2O–P2O5 system, Reference Le Sauze and Marchand15–Reference Mascaraque, Fierro, Durán and Muñoz19 oxygen substitution by nitrogen leads to an increase of nonbridging oxygens (NBO) contents, along with an increase in the connectivity of the glass network by the formation of P–N bonds, which have higher covalent character than P–O bonds. These structural changes can explain the increase in the thermal and chemical stability, together with the ionic conductivity. Besides, the increase of ionic conductivity by the effect of nitrogen also depends on the addition of lithium content, as observed by Mascaraque et al. Reference Mascaraque, Fierro, Durán and Muñoz19 Thus, it is expected that the introduction of lithium sulphide in nitrided phosphate glasses results in a simultaneous improvement of electrical and chemical properties that allows their application as solid electrolytes.
Nowadays, the study on Li2S–P2S5 glasses has been basically focused on electrical and electrochemical properties, without emphasizing their structure. In a preliminary study on Li2O–Li2S–P2O5–PON glass prepared for the first time by melting, Reference Mascaraque, Takebe, Tricot, Fierro, Durán and Muñoz20 it has been demonstrated that the introduction of Li2S and nitrogen produces a notable increase in the ionic conductivity. This process consists of two-step melting from the mixture of Li2S and LiPON glass, which was previously obtained by ammonolysis. Reference Muñoz, Durán, Pascual, Montagne, Revel and Rodrigues18,Reference Muñoz, Pascual, Durán, Rocherullé and Marchand21
In this work, mechanical milling (MM) was used for the preparation of LiPOSN glasses from the starting materials, Li2S and LiPON glasses, to arrive to final composition and a comparison between both procedures was performed. The main objectives are to increase the ionic conductivity with the simultaneous enhancement of chemical durability and to study the structure of the materials in detail. The structure of LiPOSN materials was performed through nuclear magnetic resonance (NMR) and x-ray photoelectron spectroscopy (XPS), and their electrical and thermal properties were studied through electrochemical impedance spectroscopy and differential scanning calorimetry (DSC).
II. EXPERIMENTAL
A. Preparation of LiPON glass
A parent glass of 55Li2O·45P2O5, which has already been studied in Ref. Reference Mascaraque, Fierro, Durán and Muñoz19, was firstly prepared by melt-quenching from batches of reagent grade materials such as Li2CO3 (99% ACS Reagent, Aldrich) and (NH4)2HPO4 (99% ACS Reagent, Merck). The batch was calcined in a porcelain crucible in an electric furnace up to 400 °C for 1 day and melted for 2 h at 850 °C. The glass was obtained by pouring the melt onto a brass plate. Finally, the glass was nitrided following a thermal treatment under anhydrous ammonia at 750 °C for 5 h, obtaining the glass called as 55LiPON.
B. Preparation of LiPOSN samples
The powdered materials belonging to Li2S–LiPON system were prepared from 1 g batches of reagent grade Li2S (99.9%) and LiPON glass by MM using a planetary ball mill (Fritsch Pulverisette 7) introduced in a glove box with Ar gas, with a ZrO2 pot (volume, 45 cm3) with 500 ZrO2 balls (diameter, 4 mm). The spinning rate was 510 rpm with milling time between 7 and 20 h, depending on the composition.
C. Characterization of the glasses
X-ray powder diffraction (XRD) patterns were obtained in a diffractometer (Rigaku, Ultima IV) using monochromatic Cu Kα radiation (λ = 1.540598). Scan rate is 2° per minute at 2θ from 10° to 60°. The total measuring time is 25 min.
The weight percentages of nitrogen and sulphur in powdered samples were determined using an analyzer LECO CHNS-932 (LECO corporation, St. Joseph, MI), verifying the simultaneous existence of nitrogen and sulphur in the phosphate network. The errors of nitrogen and sulphur analyses are ±0.3 and ±0.2 mol%, respectively.
31P magic angle spinning (MAS)-nuclear magnetic resonance (NMR) experiments were performed on a 9.4 T Bruker spectrometer at 162.9 MHz. The 1D MAS-NMR spectra were conducted at a spinning frequency of 15 kHz with a 4 mm probe-head. The experiments were recorded with a 4 μs pulse length (π/2 pulse angle), a radiofrequency (rf) strength of 60 kHz, and 128 transients separated by a recycle delay (rd) of 60 s.
Photoelectron spectra (XPS) were obtained with a VG Escalab 200R spectrometer equipped with a MgKα (hν = 1253.6 eV, 1 eV = 1.6302 × 10⁻¹⁹ J) x-ray source, powered at 120 W. The XPS data signals were taken in increments of 0.07 eV with a dwell time of 50 ms. Binding energies were calibrated relative to the C1s peak at 284.8 eV. Atomic ratios were computed from experimental intensity ratios and normalized by atomic sensitivity factors. Reference Wagner, Davis, Zeller, Taylor, Raymond and Gale22
The glass transition temperature, T g, was determined by DSC in a Discovery DSC (TA Instruments), which employs a constant heating rate of 10 °C/min under argon flow and between 25 and 500 °C. The T g error is within ±5 °C.
A JSM-6610A (JEOL Ltd., Tokyo, Japan) scanning electron microscope was used to determine the thickness of the LiPOSN materials. This equipment is equipped with an energy dispersive x-ray spectroscopy system (JED-2300, JEOL Ltd., Tokyo, Japan).
Ionic conductivity measurements were conducted under dry Ar atmosphere using a SI-1260 impedance analyzer from Solartron, in the frequency range from 0.1 to 1 MHz and a voltage of 50 mV. The LiPOSN powder (100 mg) was pressed at 360 MPa for 1 min to form a pellet, and foils were placed on both the surfaces of the pellet, followed by pressing at 100 MPa. Stainless steel disks were attached to the pellet as current collectors. The diameter of the pellets was 10 mm and the thickness was 0.33–1.14 mm. The AC impedance measurements were performed at 25 °C for the amorphous samples. The conductivity (σ) is calculated using the equation:
 $$\sigma = \left( {{1 \mathord{\left/ {\vphantom {1 R}} \right. \kern-\nulldelimiterspace} R}} \right) \cdot \left( {{d \mathord{\left/ {\vphantom {d S}} \right. \kern-\nulldelimiterspace} S}} \right)\quad ,$$
being (d/S) the sample geometric factor, where d is thickness and S is sample area.
III. RESULTS AND DISCUSSION
A. Composition of samples
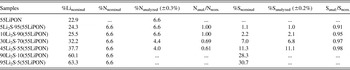
Table I shows the molar percentage of nominal and analyzed sulphur and nitrogen contents of the samples xLi2S·(100 − x) (55Li2O·45P2O5 + N) with Li2S contents between 5 and 95 mol%. The loss of sulphur is very low, just 2–10% in milled powders, but nitrogen losses increase with increasing Li2S contents, from 0% for samples with 5 and 10 mol% Li2S to 30–40% for samples with 30 and 45 mol% Li2S. The milled powders with 90 and 95 mol% Li2S were not characterised because the samples were not amorphous after 80 h of milling, likely due to the excess of Li2S content.
Molar percentage of lithium, sulphur, and nitrogen of the samples xLi2S(100 − x) (55Li2O·45P2O5 + N) (x = 5–95 mol%).

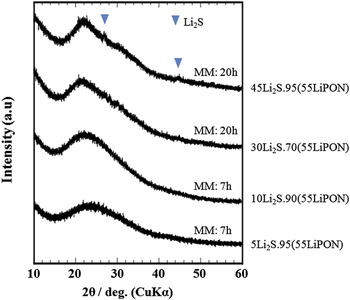
Figure 1 represents the XRD patterns of LiPOSN samples with 5–45 mol% Li2S. In the range of composition between 5 and 30 mol% Li2S, the samples are amorphous, but in the case of the sample with 45 mol% Li2S, peaks with very low intensity appear and correspond to a crystalline phase of Li2S, indicating that this composition is the limit of Li2S content, which can be introduced in lithium phosphorus oxynitride glasses.
X-ray diffractogram patterns of samples xLi2S(100 − x) (55Li2O·45P2O5 + N) (x = 5–45 mol%) prepared by MM for time periods of 7 and 20 h.

B. Structure
The structure of all the LiPOSN samples was studied through 31P MAS NMR and XPS. Through NMR, the phosphorus groups with and without nitrogen and sulphur can be identified. XPS of N1s , O1s , and S2p allows determination of the ratio BO/NBO (bridging oxygens/NBO), N t/N d (nitrogen tri-coordinated/nitrogen di-coordinated), and BS/NBS (bridging sulphurs/nonbridging sulphurs).
1. 31P MAS NMR
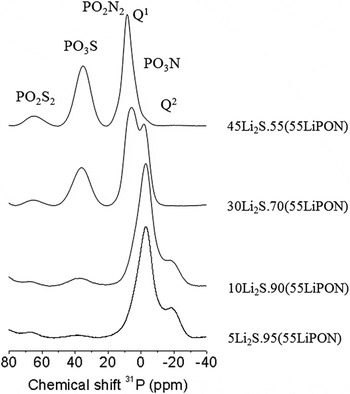
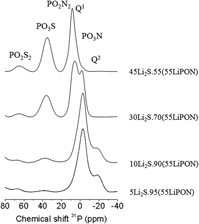
Figure 2 gathers that the 31P MAS NMR spectra of powdered glasses obtained by MM reveal two broad resonance bands in the range of 20 and −25 ppm and two resonances comprised between 70 and 30 ppm. According to the literature, Reference Tatsumisago, Morimoto, Yamashita and Minami6,Reference Hayashi, Araki, Tadanaga, Tatsumisago and Minami23–Reference Minami, Mizuno, Hayashi and Tatsumisago25 the resonances appearing at 35 and 65 ppm may be assigned to PO2S2 and PO3S units. For contents of lithium sulphide up to 10 mol%, the two broad resonances which maxima at −19 and 2 ppm may correspond to Q2 and Q1 groups. Reference Brow26 These samples present nitrogen, so PO3N and PO2N2 Reference Bunker, Tallant, Balfe, Kirkpatrick, Turner and Reidmeyer27,Reference Le Sauze, Montagne, Palavit, Fayon and Marchand28 groups are expected to appear at −11 and 6 ppm, likely overlapped with other broad resonances. For higher Li2S contents (30 and 45 mol%), the band assigned to Q2 groups disappears, indicating that the sulphur and lithium introduction produces the decrease of P–O–P bonds to form phosphate groups with one or two sulphurs, PO3S or PO2S2 species. The broad band situated between 6 and −11 ppm could correspond to several overlapping resonances assigned to Q1 groups at 2 ppm, Reference Brow26 and phosphorus species with nitrogen, PO2N2, and PO3N, at −11 and 6 ppm. Reference Bunker, Tallant, Balfe, Kirkpatrick, Turner and Reidmeyer27,Reference Le Sauze, Montagne, Palavit, Fayon and Marchand28
31P MAS NMR spectra of powdered lithium thio-phosphorus oxynitride samples.

2. XPS of N1s peak
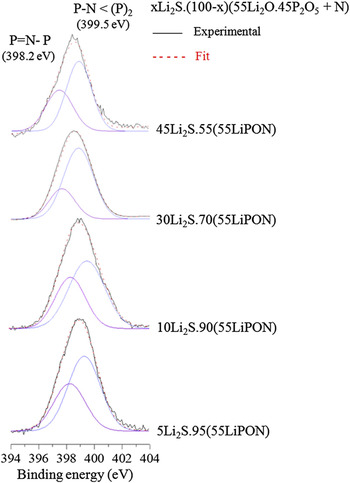
Figure 3 represents XPS spectra of the N1s peak of all lithium thio-phosphorus oxynitride samples. The spectra are deconvoluted into two Gaussian–Lorentzian mixed components assigned to two different bonding states of nitrogen atoms. Reference Wang, Kwak, Sales and Bates17,Reference Veprek, Iqbal, Brunner and Scharli29–Reference Brow, Reidmeyer and Day31 The first component corresponds to nitrogen 2-fold coordinated (N d) at ∼398.2 eV, and second one to nitrogen 3-fold coordinated (N t) at ∼399.5 eV.
XPS spectra of the N1s peak of samples xLi2S(100 − x) (55Li2O·45P2O5 + N), where x = 5, 10, 30, and 45 mol%.

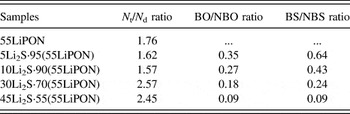
From the deconvolution of XPS spectra of N1s , the values of N t/N d can be calculated and are collected in Table II. The nitrogen content of the samples with 5 and 10 mol% Li2S does not change respecting to base oxynitride glass (Table I), so similar values of N t/N d are expected. However, glasses with 30 and 45 mol% Li2S present lower nitrogen contents. Following the study of N1s XPS of lithium phosphorus oxynitride glasses, Reference Mascaraque, Fierro, Durán and Muñoz19 the lower the nitrogen content, the higher will be the N t/N d ratio.
N t/N d, BO/NBO, and BS/NBS ratios of LiPOSN samples, with an error of ±0.05.

3. XPS of O1s peak
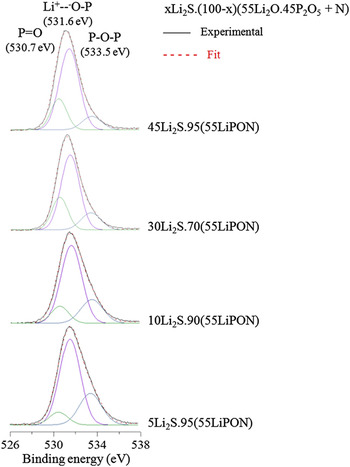
Figure 4 shows the XPS spectra of the O1s peak of all powdered samples. The spectra are deconvoluted into three Gaussian–Lorentzian mixed components attributed to two types of NBO, P=O at ∼530.7 eV and Li+…–O–P at ∼531.6 eV, and another component to BO at ∼533.5 eV. Reference Brückner, Chun, Goretzki and Sammet32 From the deconvolution of XPS spectra of O1s peaks, the BO/NBO ratio can be calculated as a function of sulphur content introduced in lithium phosphorus oxynitride glasses, Table II. The increase of lithium sulphide content in phosphate glasses produces the decrease of BO, related to the breaking of phosphate chains produced by the introduction of lithium, as observed by Mascaraque et al., Reference Mascaraque, Takebe, Tricot, Fierro, Durán and Muñoz20 and/or the substitution of BO and NBO by sulphur.
XPS spectra of the O1s peak of samples xLi2S(100 − x) (55Li2O·45P2O5 + N), where x = 5, 10, 30, and 45 mol%.

4. XPS of S2p peak
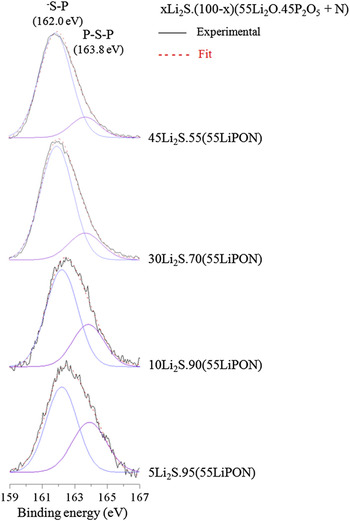
Figure 5 presents the spectra of the S2p peak of powder LiPOSN amorphous materials. These spectra are deconvoluted into two components assigned to NBS at ∼162.0 eV and BS at ∼163.8 eV. In this case, the spectra can only be deconvoluted into two components due to low sensibility of XPS equipment for lower bonding energy; although, this type of spectrum of S2p peak should be deconvoluted into four Gaussian–Lorentzian mixed components. Reference Foix, Gonbeau, Taillades, Pradel and Ribes33 In Table II, the ratio of BS/NBS obtained from the deconvolution of XPS spectra of S2p is indicated, as a function of sulphur content in lithium phosphorus oxynitride glasses. Oxygen is substituted by sulphur in the phosphate glasses to lead to BS and NBS. The increase of Li2S content produces an increase of NBS.
XPS spectra of the S2p peak of samples xLi2S(100 − x) (55Li2O·45P2O5 + N), where x = 5, 10, 30, and 45 mol%.

5. Structural interpretation
The structural interpretation is derived from the information obtained by NMR and XPS techniques:
-
(i) The increase of molar percentage of Li2S leads to the decrease of BO/NBO and BS/NBS ratios (Table II). For the sample with 45 mol% Li2S, the percentage of BO and BS is just 10% of their total contents.
-
(ii) The introduction of lithium and sulphur produces the decrease of P–O–P bonds by the formation of phosphate groups, Q2 and Q1, with sulphurs, PO3S, and PO2S2 species. For higher Li2S contents (30 and 45 mol%), the Q2 groups disappear (Fig. 2).
-
(iii) The percentages of PO3S and PO2S2 species increase with increasing lithium sulphide content, in particular, for samples with Li2S contents higher than 30 mol%.
-
(iv) 5Li2S·95(55LiPON) and 10Li2S·90(55LiPON) samples present a N t/N d ratio of approximately 1.6, while 30Li2S·70(55LiPON) and for 45Li2S·55(55LiPON) samples, which present lower amount of nitrogen, the N t/N d ratio is of approximately 2.5.
The structure of 5Li2S·95(55LiPON) and 10Li2S·90(55LiPON) materials may be thought to be similar to that of a conventional glass structure. However, in the 30Li2S·70(55LiPON) and 45Li2S·55(55LiPON) samples, there are an 80–90% of BO and BS, a lack of Q2 groups, and a significant percentage of PO3S and PO2S2 units. These results suggest that these materials present an ionic structure with isolated species and regions with phosphate groups with and without sulphur and connected through P–N bonds of the PO3N and PO2N2 species.
C. Properties
1. Thermal properties
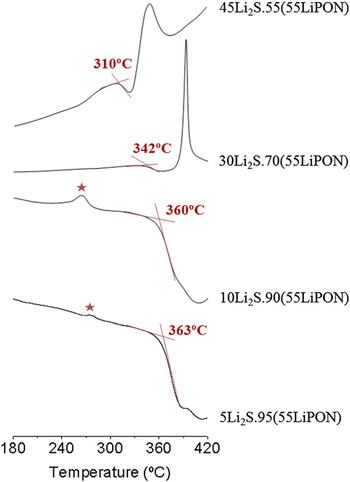
Figure 6 shows the DSC patterns of all powdered samples. Glass transition temperature obtained through DSC curves decreases after incorporation of S into the oxynitride glass down to 50 °C less for the 45 mol% Li2S sample due to the formation of PO3S species with lower number of BO-atoms and the presence of NBS-atoms, as observed by XPS (Figs. 4 and 5 and Table II). Besides, the materials with 5 and 10 mol% Li2S present an exothermal peak at 270 °C (denoted with red star), which can be due to a crystallization peak.
DSC curves of samples xLi2S(100 − x) 55Li2O·45P2O5 + nitrogen, where x = 5, 10, 30, and 45 mol%.

2. Ionic conductivity
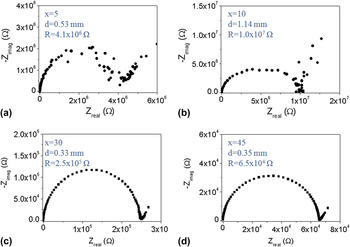
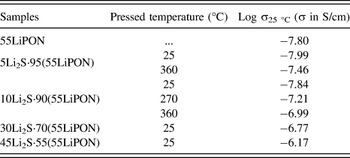
Figure 7 represents Nyquist diagrams at room temperature of all studied samples. Applying Eq. (1), the values of ionic conductivity at room temperature were calculated and are presented in Table III. The values of σ indicate that the introduction of lithium sulphide in lithium phosphorus oxynitride glasses produces a significant increase in their conductivity, with a difference of nearly two orders of magnitude between glasses with 5 and 45% mol% Li2S (Table III). On the other hand, it should be noted that the precursor 55LiPON is a bulk glass obtained by melting, while glasses with Li2S are compressed powder pellets, so, it is expected that the pellet with the lowest Li2S presents lower ionic conductivity compared to bulk 55LiPON glass.
Nyquist diagrams at room temperature of powder samples xLi2S(100 − x)55Li2O·45P2O5 + nitrogen, where x is (a) 5, (b) 10, (c) 30, and (d) 45 mol%.

Ionic conductivity at room temperature of all pellets obtained by cold-pressing, and the pellets with 5 and 10 mol% Li2S prepared by hot-pressing (270 and 360 °C).

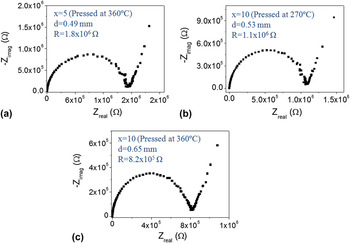
The pellets of powdered materials present ionic conductivity of the grain boundaries and within the grains. The resistance of grain boundaries is very high compared to the grain, decreasing the total ionic conductivity of the sample. To monitor and minimize the effect of grain boundaries, glasses with 5 and 10 mol% Li2S were selected to be pressed for 5 h at 360 °C [corresponding to glass transition temperature (Fig. 8)], and the sample with 10 mol% Li2S was also pressed at lower temperature, 270 °C, for 5 h to observe the effect of the pressing temperature on ionic conductivity.
Nyquist diagrams at room temperature of amorphous materials with 5 mol% Li2S pressed at (a) 360 °C, with 10 mol% Li2S pressed at (b) 270 °C and (c) 360 °C.

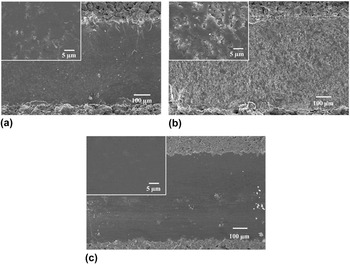
Figure 8 shows the Nyquist diagrams of the pellets obtained by hot-pressing, from which the resistances at room temperature are obtained, and applying Eq. (1), the values of ionic conductivity at 25 °C are calculated and gathered in Table III. The ionic conductivity values indicate that both treatments allow reducing the effect of grain boundary, the total log ionic conductivity increases up to −7.46 and −6.99 (σ in S/cm) in the glasses with 5 and 10 mol% Li2S, respectively. However, the temperature used has a strong influence on the ionic conductivity. Indeed, the pellet with 10 mol% Li2S pressed at 270 °C has a lower conductivity with respect to that pressed at 360 °C. Images of scanning electron microscopy (SEM) show that samples pressed at 360 °C are dense [Figs. 9(a) and 9(c)], with a small porosity on the sample with 5 mol% Li2S that could explain the lower increase in conductivity with respect to 10Li2S·90(55LiPON). The pellet with 10 mol% Li2S pressed at 270 °C shows a high porosity [Fig. 9(b)] and is only dense when pressed at 360 °C, where higher ionic conductivity is obtained.
SEM images of pellets with 5 mol% Li2S pressed at (a) 360 °C, with 10 mol% Li2S pressed at (b) 270 °C and (c) 360 °C.

D. Relationship between ionic conductivity and structure
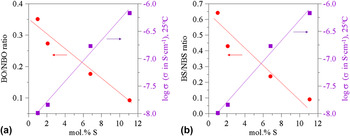
The XPS spectra of O1s and S2p peaks permit to calculate the percentage of BO and NBO and sulphurs, which is related to the electrical properties. Figure 10 indicates that the higher the decrease of BO/NBO and BS/NBS ratios and the higher the increase of ionic conductivity. The introduction of lithium sulphide leads to the breaking of phosphate chains by the double effect of lithium, a network modifier, and the substitution of BO by sulphur. Both effects produce the decrease of BO/NBO ratio, directly related to the increase of ionic conductivity. Besides, the introduction of 5 mol% Li2S (1 mol% S) leads to the formation of BS and NBS, having a 61% of NBS. With increasing Li2S content, the proportion of NBS gives rise up to 92%. The sharp decrease of BS/NBS appears as a direct cause of increased ionic conductivity, which is of nearly two orders of magnitude with respect to the glass with the lowest sulphur content.
Log σ at room temperature and (a) BO/NBO or (b) BS/NBS ratios, as a function of sulphur content of LiPOSN samples.

In samples with 30 and 45 mol% Li2S, which present the highest ionic conductivities, the results of NMR indicate the presence of ionic structures with isolated groups and low ratios of BO/NBO and BS/NBS that could improve the mobility of Li+ ions, leading to an increase of conductivity.
IV. CONCLUSIONS
The MM process starting from an oxynitride glass and Li2S allowed preparation of high lithium phosphate glasses containing both S- and N-anions. NMR and XPS demonstrated that both N and S substitute for the anionic positions in the Li-phosphate glasses. The structural results suggest that powder glasses with high sulphur content present an ionic type structure with isolated species and regions with PO4, PO3S, and PO2S2 groups, only connect through the PO3N and PO2N2 units. The double substitution of oxygen by nitrogen and sulphur in lithium phosphate glasses leads to a significant increase in the ionic conductivity. The enhancement of conductivity is related to the structural changes, being that the higher decrease of ratios of BO and NBO and sulphurs leads to the higher mobility of Li+ ions, i.e., the higher increase of ionic conductivity.
ACKNOWLEDGMENTS
Financial support from project MAT2010-20459 is greatly acknowledged. N. Mascaraque thanks MEC ministry for funding of a FPU-2009 grant. María José de la Mata (SIDI-UAM) is also greatly acknowledged for her assistance in the NMR characterization.