


Introduction
Analysis of polar climate requires uniform and consistent datasets for monitoring and modeling. A goal of the NASA Pathfinder Program is to use currently available Earth information to provide “consistently calibrated global change-related datasets” and to lest procedures for generating the consistent data products planned for the Earth Obsersing System (EOS) (UCAR, 1994). To achieve this goal, several new Pathfinder efforts have been initiated to address the requirements for integrated and comprehensive datasets for high-latitude climate studies. Here, we describe one component of this new Polar Pathfinder initiative—the Advanced Very High Resolution Radiometer (AVHRR)-based Polar Pathfinder (APP)—and discuss applications of these Pathfinder products to polar modeling.
The premises of the Polar Pathfinder program are that: (1) climate studies can best be served by providing a Suite of consistent and co-located products that encompass several aspects of the climate system; and (2) these products should be available for a range of scales suitable to different research applications. The goal of the APP is to provide a multi-year series of relatively high-resolution to medium-resolution climate-related products that encompasses several of the key parameters that characterize ice conditions. These include ice-motion information that documents ice-dynamical processes over regional to hemispheric scales, and surface temperature and albedo that help to define the energy budget of the ice cover. These products can be used individually or in combination with other datasets to investigate high-latitude regions. The products also encourage the generation of new and “value-added” datasets from combinations of data types and from data assimilation within models. An additional objective is to provide these products in forms compatible with other products from the Polar Pathfinder Group, such as the TIROS Operational Verlical Sounder (TOVS) and passive microwave Polar Pathfinders (e.g. Reference FrancisFrancis, 1997; Polar Pathfinder Group, 1997).
Product Summary
Overview
AVHRR provides appropriate spectral channels, high radiometric and spatial resolution, and complete polarregion coverage well suited for climate monitoring and energy-balance studies (Reference SteffenSteffen and others, 1993). The APP products (Table 1) take advantage of the relatively long-record of imagery gathered by the series of AVHRR sensors carried on board NOAA platforms since the early 1980s, as well as other datasets that can be used to optimize the product set. APP products are summarized below. Additional data-set details, schematics of the APP processing strategy and summaries of products are available via the World Wide Web (http://nsidc.colorado.edu).
AVHRR-based Polar Pathfinder products

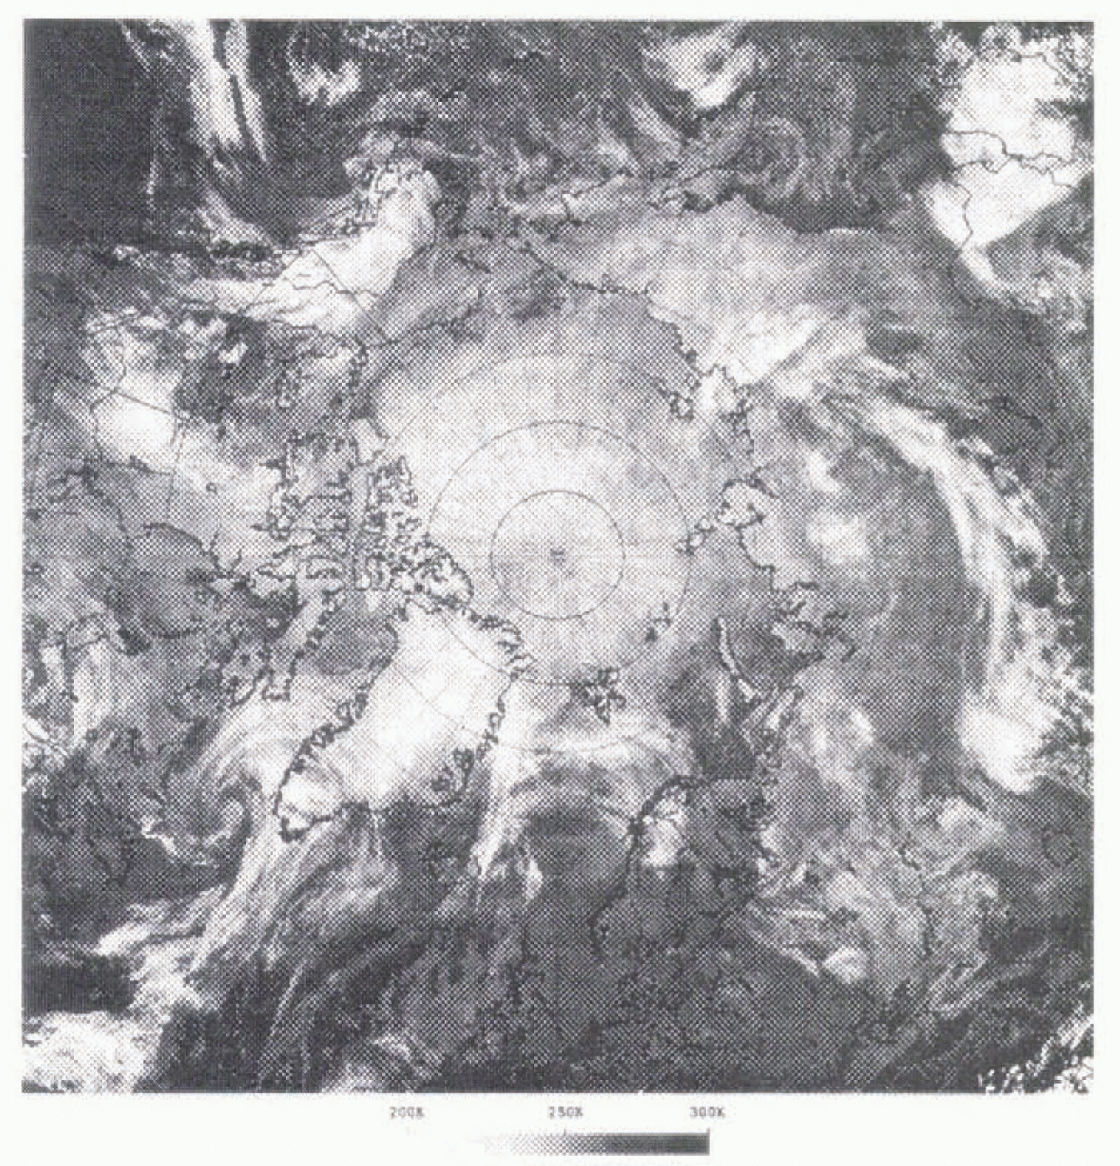
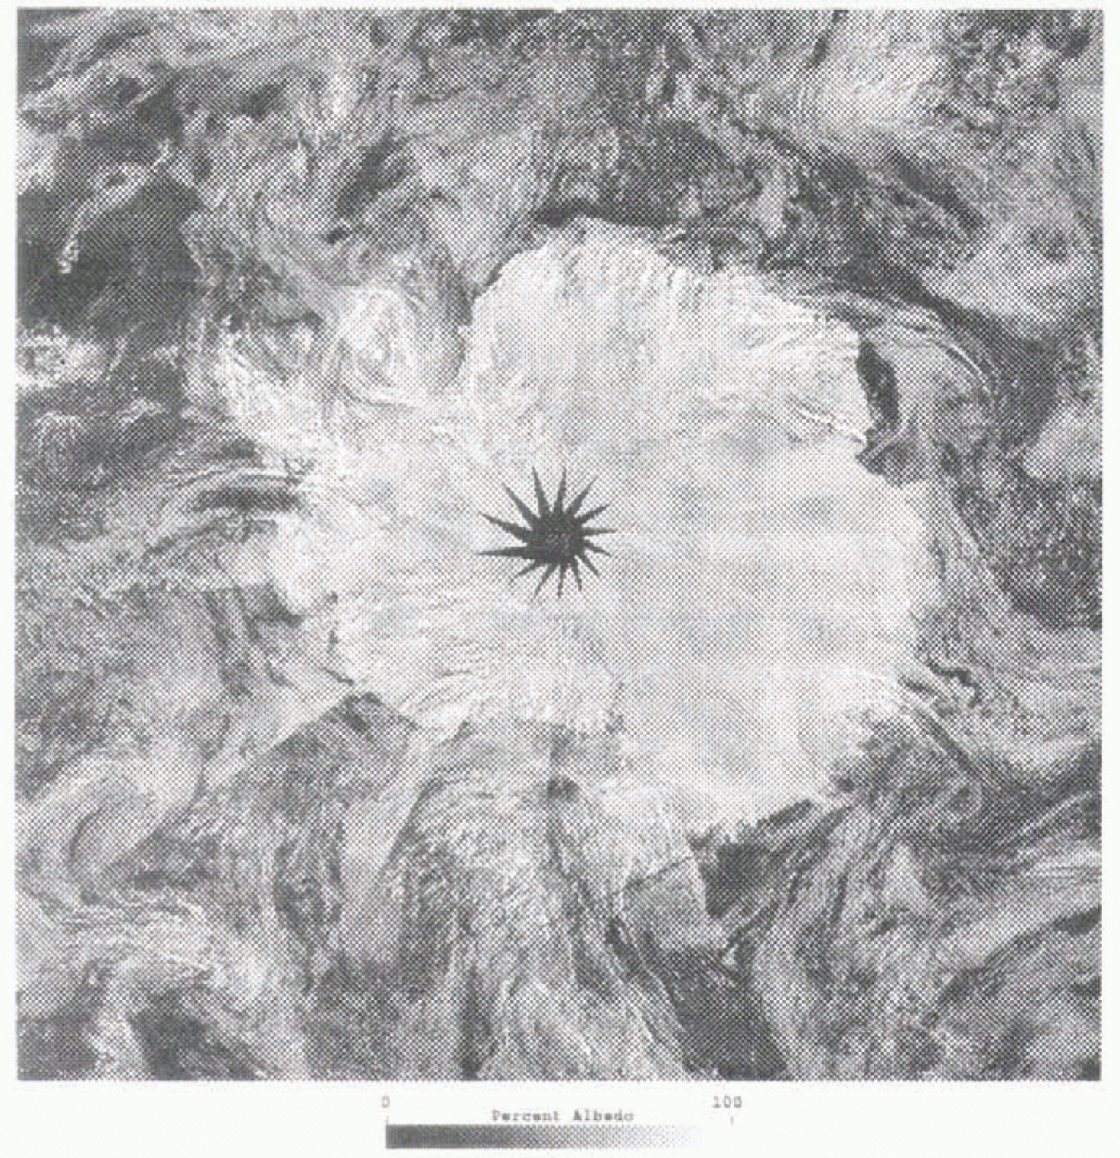
Algorithms from the CASPR (Cloud and Surface Parameter Retrieval) tool kit, developed under EOS POLES (Polar Exchange at the Sea Surface) funding (Reference KeyKey, 1996), have been adapted to produce a clear-sky surface (skin) temperature from AVHRR channels 4 and 5 (Reference Key and HaefligerKey and Haefliger, 1992), and a broadband albedo from channels 1 and 2 (Reference De Abreu, Key, Maslanik, Sereze and LeDrewDe Abreu and others, 1994). The albedo and ice-surface (skin) temperature images are assembled into two composites per day, for local times of 0200 and 1600 h GMT for the Southern Hemisphere and 0440 and 1400 h GMT for the Northern Hemisphere. Coverage areas and examples of temperature and albedo products are shown in Figures 1 and 2. Global Area Coverage (GAC) data with 4 km resolution will be used for the planned coverage period of 1983–96, with nominal 1.1 km resolution Local Area Coverage (LAC) and High Resolution Picture Transmission (HRPT) for 1996–97. Since AVHRR provides multiple orbit passes per day in the polar regions, pixels are selected from orbit swaths based on sampling time and scan angle. The precise local time for 90% of the cells in each grid is within 1 hour of the target time and 90% of the cells are acquired with scan angles <25°.
The AVHRR Polar Pathfinder dataset coverage for the Northern Hemisphere. The data shown are temperatures derived from AVHRR cannels 4 and 5.
Dataset coverage for Ihe Sothern Hemisphere. The data shown are broadband albedo derived from AVHRR channels 1 and 2.
The albedo, ice-surface temperature and cloud masks are provided for several gridcell sizes to accommodate uses ranging from detailed process studies to climate model validation. Grid sizes are 5 and 25 km for GAC-derived products, with the addition of 1.25 km products from LAC and HRPT data. Calibrated and geo-located data for the five AVHRR channels are arehived at 3km cell size. The products are mapped to equal area projections for the Southern and Northern Hemispheres, compatible with the Equal Area Spetial Sensor Microwave Imager (SSM/I) Earth (EASE) grid used by the Nalional Snow and Ice Data Center (NSIDC) for SSM/I Polar Pathfinider products (Reference Armstrong and BrodzikArmstrong and Brodzik, 1995). Grid coverage (Figs 1 and 2) extends from the North Pole to 50°N and the South Pole to 53°S. To support future algorithm development and intercomparison, a full suite of radiances and products at 1.25 km cell size will be retained for a sub-region of the Aretic. Data are stored as scaled 16 bit and 8 bit binary files in HDF (Hierarehical Data Format). Arctic grid dimensions are 1805 × 1805 pixels at 5 km, or 361 × 361 pixels at 25 km. To test ways of improving ease of use for modeling applications, a 100 km “data cube” consisting of a combination of co-registered Polar Pathfinder products (AVHRR, TOVS and SSM/I) is being prepared for 1986–87.
The APP ice-motion products complement existing drifting buoy data from the International Arctic Buoy Program (IAHP) and provide an historical record of ice motion prior to the availability of radar-derived products from the Canadian RADARSAT satellite. Using corresponding passes for consecutive days, daily sea-ice displacement vectors are determined through image-to-image correlation (Reference Emery, Fowler, Hawkins and PrellerEmery and others, 1991) and mapped to a 20 km grid. Characteristics of the sea-ice motion products dictate a different processing strategy and format than is used for the twice-daily products noted above. For each day, four scenes are chosen with acquisition times near 0000, 0600, 1200 and 1800 h GMT. These times allow for complete coverage of the polar ice with some overlap, and also compare as well as possible to the 12 hourly IABP buoy data.
Given the extensive cloudiness of the polar regions, the requirement that clear-sky conditions exist for consecutive days is a major limitation of AVHRR for mapping ice motion. An additional APP ice-motion product is therefore generated by combining AVHRR-derived ice displacements with other ice-motion information via optimal interpolation to create ice-motion fields that are uniform in time and space. Currently, these “blended” motion fields include ice-motion information extracted from AVHRR and drilling buoys. We will also use ice displacements estimated from Special Sensor Microwave/Imager (SSM/I) 85 GHz brightness temperatures (Reference Agnew and LeAgnew and Le, 1997; Reference Agnew, Le and HiroseAgnew and others, 1997). The blended-motion field thus takes advantage of the accurate, but sparse, buoy motions, the detailed, but intermittent, AVHRR-derived motions, and the lower-resolution, but uniform, temporal coverage provided by SSM/I. An example is shown in Figure 3. In the Antaretic, where buoy data are rare, the APP motion fields will consist of a combination of AVHRR and SSM/I-derived motions such as those shown in Figure 4. A time series of samples of the gridded motion products, including SSM/I-derived motion vectors for 1987–95, Scanning Multichannel Microwave Radtometer (SMMR) -derived motion for 1978–87 and temperature and albedo browse (25 km) images, can be accessed via the WWW at http://polarbear.colorado.edu.
Arctic sea-ice motion as determined through a blending via interpolation of drifting buoy motions with ice motion estimated from AVHRR and SSM/I data. Velocity vectors represent displacements from Julian Day 300–301 (28–29 October) in 1993. Maximum velocity (longest arrow) is approximately 30 cm s−1.

SSM/I-derived sea-ice motions for the Antaretic from Julian Day 142–143 (21–22 March) in 1993. The gray areas have at least 5% sea-ice concentration as estimated from SSM/I data. Minimum velocity (longest arrow) is approximately 40cm s−1.

Cloud detection
A critical element of APP product generation is detection of cloud cover. Cloud-detection methods used are optimized for polar conditions, where cloud screening is complicated by low contrast between clouds and the surface in reflected and thermal bands, and the lack of solar illumination for part of the year. The cloud screening currently being-applied uses statistical means and variances of probable clear-sky areas estimated regtonally. The basic cloud-detection procedure involves a combination of split-window and single-channel thresholds and temporal-change detection using estimates of clear-sky surface temperature and albedo determined separately as a function of surface type. SSM/I data are used to partition the surface into open water, ice, snow-free land and snow-covered land.
Quality control and validation
Quality-control steps include visual checking of the products in combination with automated checking for missing or poorly calibrated data. An important element of the APP products is the planned incluston of quality-control information that provides users with a means to assess the suitability of the data for their particular applications. Information likely to be provided in a reduced resolution form, or in ancillary tables, includes the assessment of cloud-screening accuracy and, for the blended ice-motion fields, parameters associated with the interpolation of individual motion vectors.
Validation of the products is a continuing process that lakes advantage of comparison data as they become available. Validation of the AVHRR ice motions to date has consisted primarily of comparisons with drilling buoys and limited coverages from ERS-I (Fowler, 1995). More extensive comparisons are planned with RADARSAT data. The most recent validation of surface-temperature and albedo-retrieval procedures used surface observations from the National Oceanic and Atmospheric Administration (NOAA) site near Barrow, Alaska (71.32° N, 156.61°W). Daily AVHRR data from a preliminary Pathfinder dataset (Reference Meier, Maslanik, Key and FowlerMeier and others, 1996) for mid 1992 to mid 1993 were used for this validation. In these comparisons, surface-temperature estimates agree well with observations, with a correlation coefficient of 0.98, bias of −0.97, and root mean squared error (RMSE) of 4.70. For surface albedo, the bias (mean error) in the estimates is near zero (r = 0.81, bias = 0.00, RMSE = 0.17), but the individual observations exhibit significant variability. This can be attributed to the inhomogeneity of the surface and the sensitivity of the retrieval scheme to changes in atmospheric aerosol and water-vapor amounts.
Overall accuracies for the products are difficult to determine, since conditions vary substantially across the large product domains and through time. Accuracy also depends on cloud screening and on the availability of updated and accurate AVHRR calibration data. In general, accuracies are approximately ±−2 K for AVHRR temperatures and ±−0.05 for albedo. For clear-sky conditions, the accuracies for albedo and temperature products are expected to be in the range noted above for the Barrow test, with temperatures accurate to ±−0.5°.
Accuracy for the ice-motion products is approximately 2 cm s−1 for AVHRR-derived vectors and 6 cm s−1 for SSM/I- derived vectors. Accuracies improve when the remotely sensed motions are interpolated with buoy vectors, which have an accuracy of about 0.5 cm s−1.
As with ice-motion products, potential improvements in the temperature and albedo algorithms to improve these accuracies, and to provide more useful datasets. are under investigation. We anticipate that two verstons of the APP products will be generated: a first version now being produced uses the Currently implemented algorithms, and a second version in the future will incorporate algorithm improvements.
Applications Examples
Ice model and forecast model validation
Figure 5 shows ice velocities simulated by a dynamic-thermodynamic model forced by data from the National Center for Environmental Predietion/National Center for Atmsospheric Researeh (NCEP/NCAR) reanalysis project (Reference KalnayKalnay and others, 1996), with the ice velocities corresponding to the NCEP 24 hour mean sea-level pressures (SLP) in Figure 6. The model uses a viscous-plastic ice rheology and a 12 hour timestep applied to an 80 km Cartesian grid for the Aretic Basin and adjacent seas. The model domain is initialized with a 2 in thick ice cover. Equilibrium is reached after a 5 year integration using 1993 daily forcings. The model and forcing fields are described in more detail in Reference Maslanik and DunnMaslanik and Dunn (1997).
Ice velocities simulatd using a dynamic-thermodynamic ice model with a viscous-plastic ice rhelogy and forced by NCEP-derived winds for Julian Day 301, 1993. Velocities represent a 24 hour average. Maximum velocity (longest arrow) is 25 cm s−1.
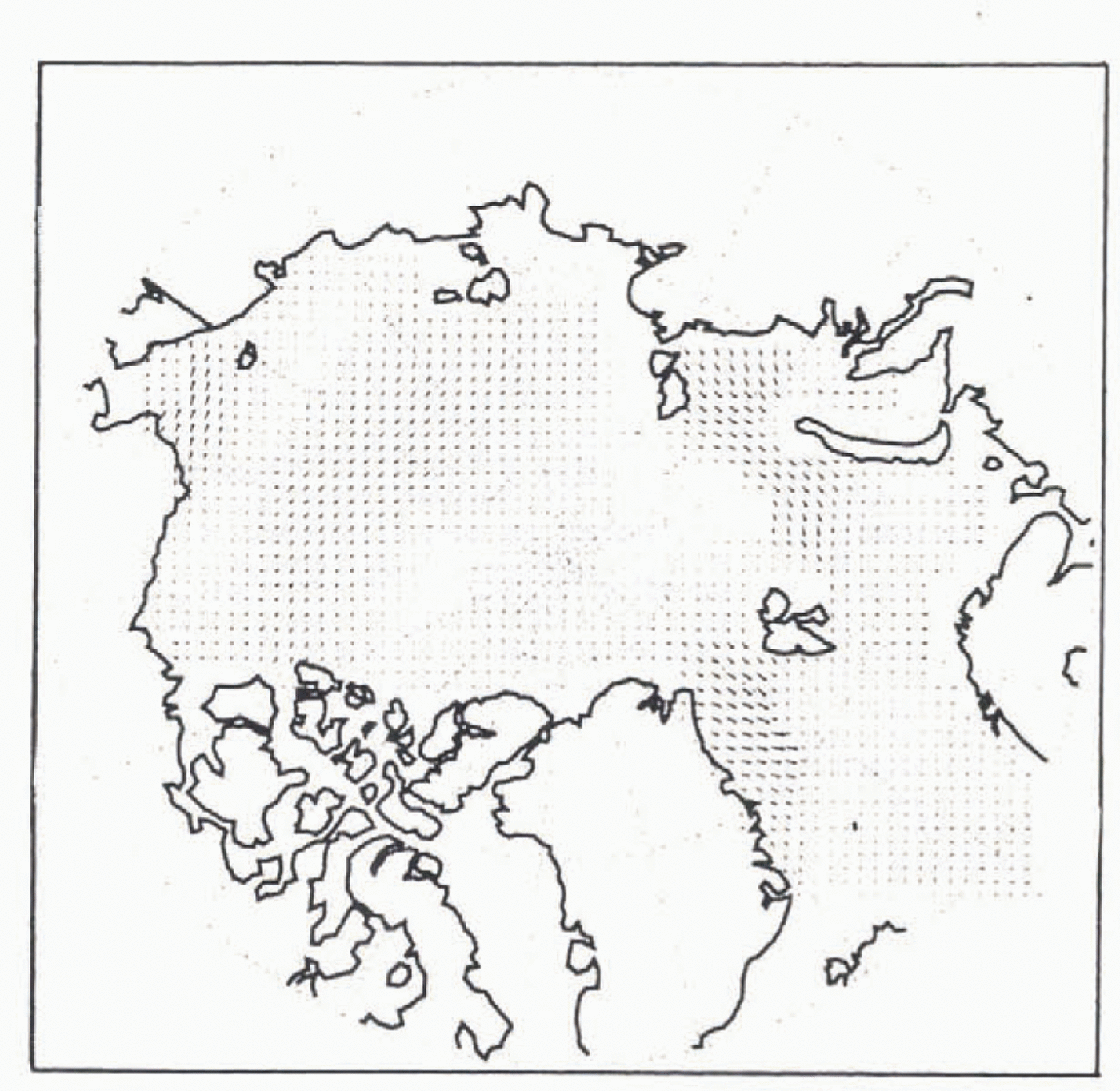
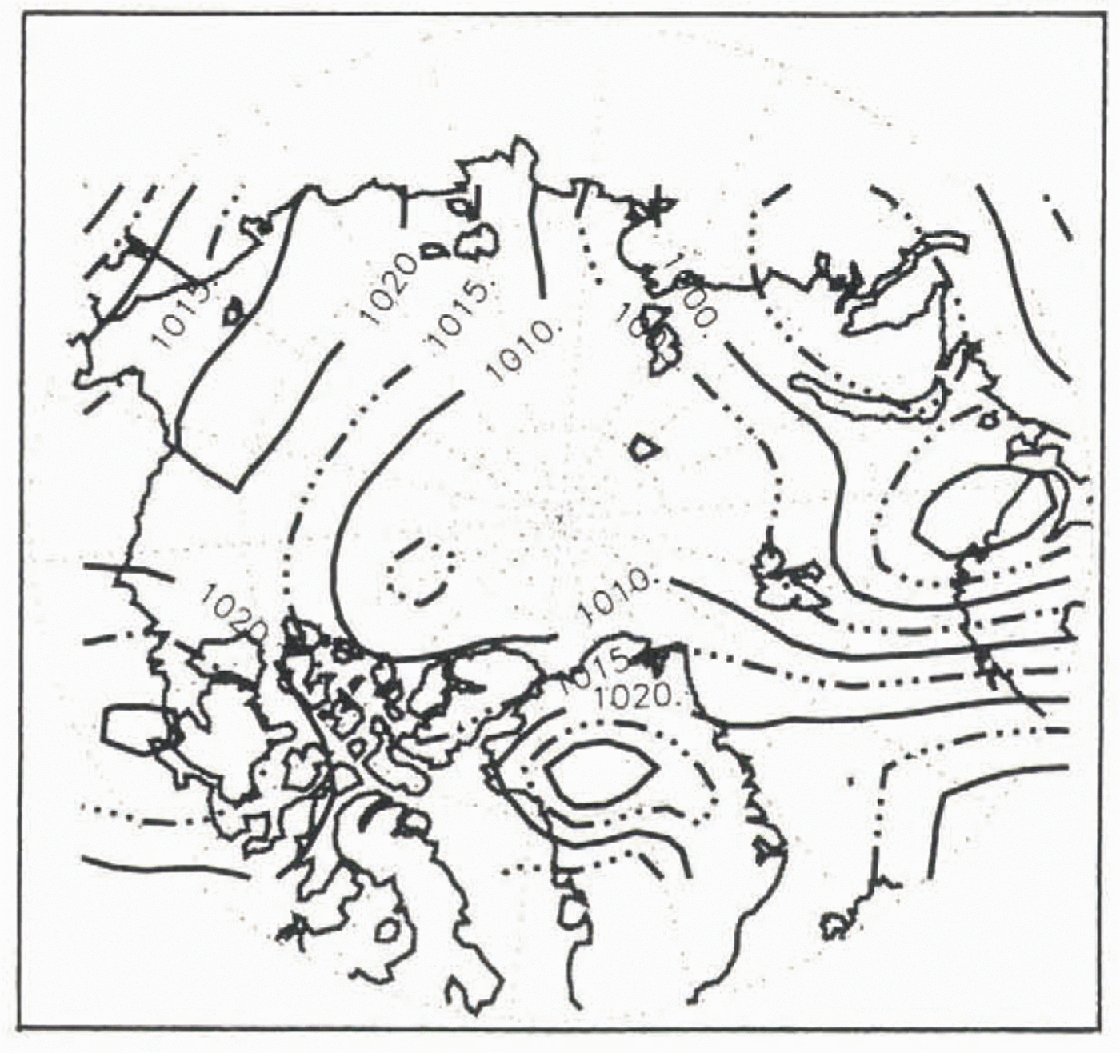
Comparing these data to the Pathfinder ice-motion fields in Figure 3 reveals generally good agreement between the Pathfinder data and the NCEP pressure patterns and simulated ice direction and speed. There are, however, also some notable differences. In particular, the Pathfinder motions show regtonal and local patterns that are not apparent in the NCEP SLP data. Most of the observed differences are likely to be due to the coarser resolution (2.5° × 2.5°) of the NCEP data compared to the higher resolution of the APP motion fields (20 km) or to inaccuracies in the torecasi model’s pressure field. For example, on Julian Day 301, a strong counterclockwise ice circulation occurs north of Svalbard, suggesting that the low pressure cell north of Finland in the NCEP data may be misplaced or too weak, or perhaps indicating the presence of a short-lived low that is not represented in the 24 hour SLP field. Also, since the ice model does not simulate ocean currents, the modeled ice velocities in Fram Strait may be underestimated for this day. The Pathfinder data also show a localized clockwise circulation in Baffin Hay that is not seen in the SEP data. Overall, the detailed motion fields from Pathfinder suggest a more dynamic ice pack than is simulated in the typical basin-scale model that uses daily forcings. This utility of basin-scale satellite products in depicting such large-scale variability is clearly revealed in similar time series of SSM/I data described by Agnew and Le (1997) and Agnew and others (1997). Applications, such as relating changes in ice extent to ice transport vs ice growth or melt, are further served by combining ice-motion fields with ice concentrations estimated from passive microwave data see Fig. 1.
The Pathfinder skin temperatures provide another comparison with the NCEP output. For Julian Day 302, Pathfinder data indicate clear-sky conditions over a portion of the central Aretic. The AVHRR temperatures in this area average 235 K. NCEP surfaee air temperatures range from 230 to 240 K in the same area. Of course, such comparisons are limited to clear-sky conditions, but they provide useful samples for comparisons in regtons such as the central Arctic and Antaretic, where few, if any, surface observations are available.
Applications within models
A potential application of the APP data, either alone or in conjunction with other datasets, is as forcings for models. As an example, an initial experiment has been conducted to determine the sensitivity of an ice model to the assimilation of AVHRR temperatures such as those provided by the Pathfinder. Presumably, constraining growth-rate calculations within an ice model by including an observed skin temperature provides a means of improving the simulation or of identifying shortcomings in the model physics.
To test such an application, a time series of preliminary Pathfinder AVHRR temperatures (Reference Meier, Maslanik, Key and FowlerMeier and others, 1996, in press) was supplied to a one-dimenstonal (I-D) ice model (Reference Ebert and CurryEbert and Curry, 1993). Figure 7 compares the modeled skin temperatures for a control run (e.g. the model run in normal mode using climatological air temperatures, wind speed and fluxes, and without assimilation) with AVHRR temperatures for a location at 80×N. For comparison, temperatures calculated from SSM/I brightness temperatures using emissivities assigned to the SSM/I-estimated fractional coverage of first-year ice, multi-year ice, and open water are also given in Figure 7. The data and model all track the annual cycle of temperatures reasonably well, with tower AVHRR temperatures in winter but higher AVHRR temperatures in spring and early summer relative to the model control run.
Comparison of AVHRR Polar Pathfinder skin temperatures (+ sign) and temperatures estimated from SSM/I data (dashed line) at 80°N with temperatures simulated by a thermodynamic ice model (solid line) using climatological forcings.
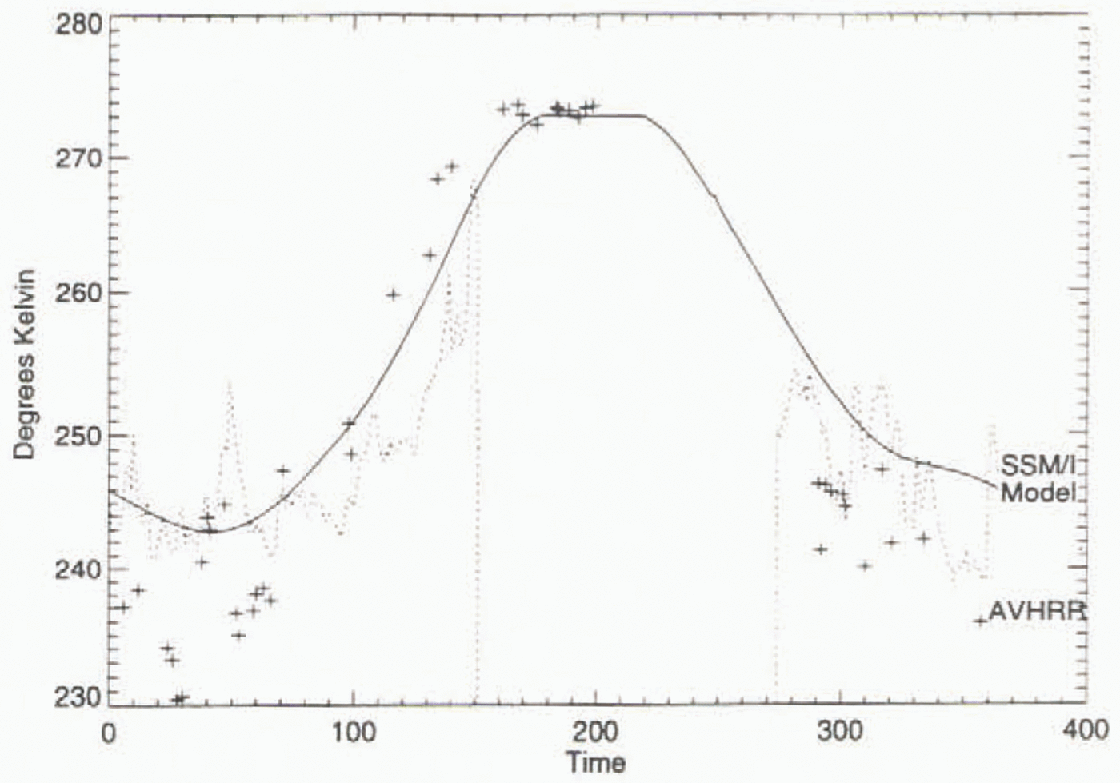
Assimilation results (not shown) highlight some expected, as well as some relatively subtle, effects of including observations. For example, since the model’s control run is driven by monthly means, the observations provide much more rapid day-to-day variability in the assimilation runs. Although the AVHRR temperatures are generally lower than temperatures simulated by the model control run. the AVHRR assimilation yields a thinner ice cover, probably due to a particular sensitivity of the model to temperatures preceding and during the melt period. Applying observed data to the model helps to identify such sensitivities that might not be considered in standard sensitivity experiments using perturbed forcings.
In the assimilation technique used, the prognostic variable (skin temperature) is replaced by a weighted combination of the modeled skin temperature and the remotely sensed temperature. Other assimilation runs have tested a range of weightings, as well as separate simulations, using AVHRR and SSM/I temperatures individually or with different weightings for the two temperature products. The SSM/I temperatures have the advantage of being relatively unaffected by cloud cover, but are less accurate than the AVHRR temperatures. By assigning different weights to the observation types based on expected accuracy, the assimilation offers a means of blending disparate data types into a uniform product that is potentially more valuable than any of the individual observation sets (or model output) used alone.
Conclusion
The AVHRR-based Polar Pathfinder will provide a suite of products useful for a variety of modeling and process studies. Product formats are compatible will be other Pathfinder data, and reduced-resolution products will be available that are particularly well suited for model forcings and validation. Examples of preliminary datasets suggest that the products will provide new levels of detail with temporal and spatial coverage not available from other data sources.
Acknowledgements
This work is supported by NASA’s Patthfinder project and Misston to Planet Earth. SSM/I data were provided by the National Snow and ICe Data Center.



