Implications
In commercial egg production facilities, light intensity and photoperiod are designed to primarily achieve high production efficiency, which may or may not match the actual biological or physiological needs of the hen. This potential mismatch may lead to undesirable well-being consequences such as feather pecking, cannibalism, eye disorders, and/or leg problems. Quantification of hen’s responses to different light intensities through preference testing helps better delineate the bird’s real light needs. Such information in turn will help instituting optimal lighting practices for improved animal welfare as well as production efficiency.
Introduction
Lighting and its properties (e.g. wavelength, intensity and duration) are crucial factors affecting birds’ growth, production, behavior, and welfare (Perry, Reference Perry2003; Lewis, Reference Lewis2010). Effects of lighting can vary with different types of birds (e.g. layers v. broilers). Light intensity can affect BW of broilers (Deep et al., Reference Deep, Schwean-Lardner, Crowe, Fancher and Classen2010), egg size and mortality of layers (Lewis and Morris, Reference Lewis and Morris1999). The recommended light intensity for commercial hen houses is 20 to 30 lux during laying period (Hy-Line, 2015). Some studies have reported that lower light intensity could reduce the incidence of cannibalism and feather pecking for layers (Kjaer and Vestergaard, Reference Kjaer and Vestergaard1999). However, improper low light intensity (e.g. 1.1 lux) could cause issues for broilers such as adrenal overweight (Siopes et al., Reference Siopes, Timmons, Baughman and Parkhurst1984), body underweight (Hester et al., Reference Hester, Sutton and Elkin1987), leg problems (Hester et al., Reference Hester, Sutton, Elkin and Klingensmith1985; Deep et al., Reference Deep, Schwean-Lardner, Crowe, Fancher and Classen2010), and partial or complete blindness due to eye morphology change (Blatchford et al., Reference Blatchford, Klasing, Shivaprasad, Wakenell, Archer and Mench2009; Deep et al., Reference Deep, Schwean-Lardner, Crowe, Fancher and Classen2010).
Photoperiod is considered as one of the most critical environment factors affecting bird production. Lewis et al. (Reference Lewis and Perry2007) compared the performance of broiler breeders reared in 11L : 13D and 16L : 8D, and found that birds under 11L : 13D had better feed conversion. Some intermittent lighting regimens have been reported to improve feed conversion (Lewis and Perry, Reference Lewis, Gous, Ghebremariam and Sharp1990; Ma et al., Reference Ma, Li, Xin, Shi and Zhao2013) and reduce mortality by reducing duration of daytime lighting for both laying hens and broiler breeders (Lewis et al., Reference Lewis, Morris and Ferry1996; Ma et al., Reference Ma, Li, Xin, Shi and Zhao2013). In commercial production, light intensity and photoperiod are designed mainly towards achieving high production, instead of considering lighting preferences and needs of the hens, which may cause some welfare issues (Hester et al., Reference Hester, Sutton, Elkin and Klingensmith1985; Prescott et al., Reference Prescott, Wathes and Jarvis2003). Furthermore, desired light intensity and photoperiod from the hen’s perspective are not fully understood and thus need investigation if we are to optimize lighting schedules with regard to animals’ light needs and welfare.
Preference test of animal responses to environmental stimuli offers good assessment of an animal’s needs. Davis et al. (Reference Davis, Prescott, Savory and Wathes1999) conducted a light intensity (6, 20, 60 and 200 lux) preference study using 2- and 6-week-old layer and broiler chicks and found that chicks preferred the brighter light at 2 weeks of age, but they spent more time under 6 lux at 6 weeks of age. Sherwin (Reference Sherwin1998) found that the light preference of male turkeys was affected by the light intensity under which they were pre-acclimatized. Prescott and Wathes (Reference Prescott and Wathes2002) studied feeding preference under different light intensities (<1, 6, 20 or 200 lux) of ISA Brown hens and found that the birds chose to eat most of the time in the brightest condition (200 lux) and the least in the dimmest (<1 lux). Some other lighting preference studies have been done on spectrum (Ham and Osorio, Reference Ham and Osorio2007), light source (Mendes et al., Reference Mendes, Paixao, Restelatto, Morello, Jorge de Moura and Possenti2013), and interaction between light intensity and room temperature (Alsam and Wathes, Reference Alsam and Wathes1991). In general, light preference of poultry is diversified with different strains and ages. No study was found on light intensity preference of W-36 hens, which has been the most popular layer breed in the United States.
The objective of this study was to evaluate the preference of fluorescent light intensity by W-36 white laying hens by providing the birds the choice of five light intensities (<1, 5, 15, 30 or 100 lux). An environmentally controlled light tunnel (LT), as described below, was constructed and used to address the objective.
Material and methods
System description
The systems for this study included a five-interconnected compartment preference test LT and a two-interconnected compartment acclimation chamber. Both were located in an environmentally controlled room at Iowa State University, Ames, Iowa, United States.
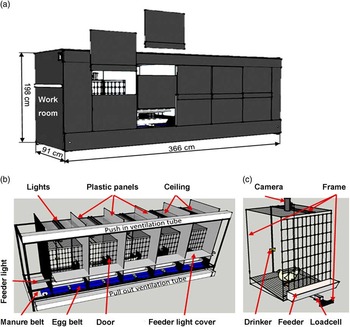
The light-proof preference test system, or LT (Figure 1), was constructed with an angle iron frame and plastic panels (white inside and black outside). The LT had an overall dimension of 366 cm long×91 cm wide×198 cm high. It was divided into five side-by-side compartments, each measuring 61 cm L×91 cm W×198 cm H. The lower portions (floor to 20 cm high) of the side walls in each compartment were painted black to provide good image contract between the white hens and the background. Each compartment had a perforated ceiling and a cage (61 cm L×61 cm W×91 cm H). A height-adjustable nipple drinker was installed at the back of the cage, and a feed trough was mounted on a load-cell weighing platform in front of the cage. Two fluorescent tube lights (GE, 15 W) partially covered by aluminum foil were installed on top of the perforated ceiling to provide different light intensities in each compartment. Placement and coverage of the light bulbs were adjusted to achieve uniform spatial distribution of light intensity at the bird level in each compartment (95% to 105% of the target value).
Schematic representation of the light tunnel (LT) for preference test of W-36 laying hens: (a) outside view, (b) inside view, and (c) an individual compartment.

A LED rope light for the feeders was placed inside a polyvinyl chloride pipe (5.1 cm diameter) with a contiguous opening (2.5 cm wide) facing the feeders, and the light pipe was fixed at 30 cm above the feed troughs along the entire LT. To eliminate the interference of the LED rope light with the main light intensity treatment, a plastic panel cover was used to confine the rope light in the feeder area only. Moreover, the LED rope light in each compartment was partially covered by aluminum foil to achieve the same light intensity of 30 lux in the feeder area in all but the <1 lux (totally covered) compartments.
The partition walls between two adjacent compartments had black rubber-strip curtains (36 cm H×20 cm W each), allowing the hens to easily pass through. Access to the LT by the caretaker was done through the movable front panel of each compartment. The five compartments shared a common hand-crank egg belt and a manure belt at the bottom of the LT, allowing eggs and manure collected at the end of the LT (Figure 1b) without opening the LT or disturbing the birds.
A push-pull ventilation system was installed to provide 60 air changes per hour (ACH) to the LT. It used two 10.5-cm diameter pushing fans (4WT47; Dayton Electric Mfg., Niles, IL, USA) at the inlet ends of a perforated air duct, and one 10.5-cm diameter pulling at one outlet end of the perforated air duct. Similar ventilation rate was achieved among all the compartments through design of size and distance of the air duct holes. Use of 60 ACH was to ensure no accumulation of bird heat, hence uniform indoor temperature in all compartments.
A separate acclimation chamber (216 cm L×89 cm W×159 cm H) was constructed and used to acclimate the hens to the different light intensities under evaluation and to train the hens in passing the curtain door before they were transferred to the LT. The acclimatization system was also constructed using angle iron and black/white plastic panels. The system was divided into two identical compartments (74 cm L×64 cm W×46 cm H each) with a black rubber-strip curtain door (same as those used in the LT) in between. Each compartment had a feed trough and a nipple drinker. A plastic board was placed under the wire-mesh floor to catch manure. Eight fluorescent tube lights (GE, 15 W) in pairs of two were installed overhead along the length direction of the chamber at the same height as those in the LT. Through partially covering the light tubes and operating proper light combination, four different light intensities of 5, 15, 30 and 100 lux were achieved inside the chamber.
Experimental design
General information
Six batches of eight 23-week-old cage-reared laying hens (Hy-Line W-36 breed) procured from local commercial farms were used for the preference test. Upon arrival at the laboratory, the eight hens of each batch were kept for 8 days in the acclimation chamber, where they were acclimated and exposed to the five light intensities under evaluation. Following acclimation, four hens were randomly chosen and transferred to the preference test LT, where they remained for 27 (for trial 1) or 33 days (for trials 2 to 6). Before the first trial and between trials, both LT and training/acclimation chamber were cleaned, disinfected and left empty for 3 days. The LT was maintained at 24.9±0.5°C and 30±5% relative humidity (RH) during the test periods. With four hens present in a compartment, the stocking density was 929 cm2/hen. Feed and water were provided ad libitum in the acclimation chamber and LT. Feeding and egg collection were performed at 0830 h every day, and manure was removed once a week.
Lighting environment
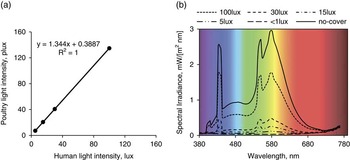
Light spectra at the five light intensities were measured using a spectrometer (Once Innovations Inc., Plymouth, MN, USA). Because the spectral sensitivity of poultry is different from that of humans (Prescott and Wathes, Reference Prescott and Wathes1999), the light intensity perceived by poultry (referred to as “plux” for poultry lux) may differ from that perceived by human (in lux) under the same lighting condition. Light intensity (lux) is usually tested based on human eye. Therefore, both plux and lux were measured under the five light intensities in this study, and their relationship is shown in Figure 2a. Spectra of all light intensities used had the same shape, which means the foil covers did not change the spectral profiles but only the irradiance (Figure 2b).
Relationship of light intensity of the fluorescent light for poultry v. human (a), and spectral profiles of the fluorescent light at different light intensities (b).

Acclimation
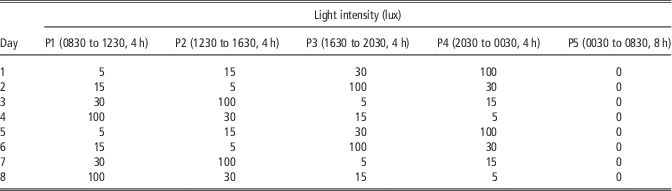
The curtain door was fully open on the first acclimation day, then the curtain strips were gradually let down in the next four days (1/4 every day). From day 5 to day 8, the curtain was fully down. This arrangement trained the hens to freely pass through the curtain doors in the LT during the preference test that followed. The hens were also exposed to multiple light intensities that were used in the LT. During the 8-day acclimation period, the photoperiod within the day was 16L : 8D. The 16 lighting hours of each day were divided into four equal-length periods (4 h/period) of 5, 15, 30 and 100 lux, respectively. The order of light intensities was based on a 4×4 Latin Square arrangement (Table 1), such that each time period received a given light intensity twice during the 8-day acclimation period. During the 8 h darkness, light intensity was 0 lux.
Lighting intensities assigned to different periods (P) during acclimation of the laying hens for preference tests

Preference test
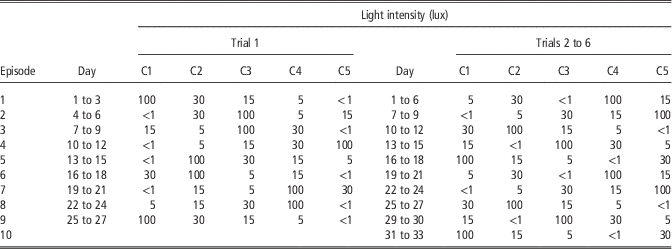
After acclimation, four birds were randomly selected and transferred to the LT for preference test. The five intensity levels of <1, 15, 30 and 100 lux were randomly assigned to the five compartments following a Latin Square design (Table 2), so that each compartment received a light intensity the same number of times per trial (balanced-randomized design). In this study, the <1 lux intensity was considered dark condition; with the small amount of light being from the adjacent compartments through the curtain strips. The <1 lux light intensity was always assigned to either of the two side compartments in trial 1, but randomized in other trials. Nine or ten episodes were involved per trial. In trial 1, each episode lasted for 3 days (27 consecutive days of testing overall). For trials 2 through 6, the first episode lasted for 6 days to give the birds more time to be acclimatized to the LT, and then lights were re-assigned every 3 days (33 consecutive days of testing overall). Between episodes, feed left in the trough of all compartments was removed and new feed added. As previously indicated, light intensity at the feeder was 30 lux for all but the <1 lux compartment (no feeder light).
Light intensities in compartments (C1 to C5) of the light tunnel during preference test period

Data collection
The compartment occupancy of hens was monitored using five infrared video cameras (GS831SM/B; Gadspot Inc. Corp., Tainan City, Taiwan) mounted atop the respective compartments. The five cameras were connected to a video capture card (GV-600B-16-X; GeoVision Inc., Taipei, Taiwan) with Surveillance System software (Ver 8.5; GeoVision Inc., Taipei, Taiwan). Images of each compartment were continuously captured at 2-s intervals throughout the experiment period. The number of hens in each compartment was determined using image analysis in Matlab (R2013a; MathWorks Inc., Torrance, CA, USA) and Excel 2013 (VBA program). To do so, original images were analyzed through cropping, binarization (with a black and white scale threshold of 0.75), boundary closing, hole filling, and spot removing to obtain the final image of hens in white and background in black. The total hen area, number of white regions, area of each region and number of compartments occupied by hens at a given moment were further analyzed in Excel to determine the number of hens in each image.
Distribution of the four hens in five compartments at a given moment has four possible scenarios: (a) all four hens in one compartment; (b) four hens in two compartments – 2 hens each or 1 hen in one compartment and 3 hens in the other; (c) four hens in three compartments – 1, 1 and 2 in the respective compartments; (d) four hens in four compartments – one hen per compartment. For scenarios (a) and (d), the number of hen(s) in each compartment is easily known. For scenarios (b) and (c), the number of hen(s) in each compartment was judged by several projected hen-area thresholds (At, cm2), as follows. The total projected area of all four hens, A(4), under typical conditions (e.g. no wing spreading) is ⩽2600 cm2. Images with larger A, though rare, were flagged and analyzed manually.
For scenario (b), there are two sub-scenarios:
-
i. One hen in one compartment, three hens in the other.
If 210 cm2⩽A(1)⩽800 cm2, the compartment likely contained one hen; if 1250 cm2⩽A(3)⩽1660 cm2 it likely contained three hens. If [A(3) – A(1)]⩾620 cm2, it confirms three hens in the A(3) compartment and one hen in the A(1) compartment.
-
ii. Two hens in two compartments each.
If 900 cm2⩽A(2)⩽1000 cm2, the two compartments likely contained two hens each. If [A(2)large – A(2)small]⩽290 cm2, it confirms two hen in each compartment.
In the case where hens huddled and the projected area was small, for example, [A(3) – A(1)]<620 cm2 or [A(2)large – A(2)small]⩾290 cm2, the previously determined hen number was retained.
For scenario c), if 900 cm2⩽A(2)⩽1000 cm2, the compartment would each contain two hens; whereas the two compartments each would have one hen if 210 cm2⩽A(1)⩽800 cm2, as defined previously.
It was considered that there was no inter-compartment movement if the change in hen areas was <210 cm2. The same area thresholds for one or two hens were used when determining the occurrence of one- or two-hen inter-compartment movement. The hen areas falling outside the thresholds were flagged for reprocessing or manual labeling. The program automatically checked to ensure that four hens were present at all times; or the data also would be flagged for reprocessing or manual check.
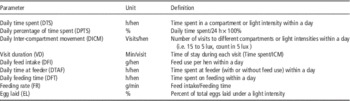
The accuracy of program output on hen number was validated by human observation of the images. For each trial, four days of data were chosen, and data associated with the first and last minutes of each hour were used in the validation. Results by the human observation and program calculation were compared and the agreement was 98% or better. The hen number data were analyzed in Excel to determine time spent (TS) in each compartment and the number of inter-compartment movement (ICM) (Table 3). The TS was calculated by summarizing hen number over a given time period (hour or day).The ICM was calculated based on change in the number of birds per compartment. A hen going from the current compartment (e.g. 15 lux) to the destination compartment (e.g. 5 lux) was counted as movement to the destination compartment (5 lux in this case) once. Such a movement would cause a change in the birds’ area for the departure (decrease) and destination (increase) compartments.
Hen behavior and production parameters measured during the preference test

Load-cell sensors (RL1040-N5; Rice Lake Weighing Systems, Rice Lake, WI, USA) were used to monitor and measure feeding activities and feed intake. Outputs of these weight sensors were continuously recorded at 1-s intervals using a LabVIEW program (version 7.1; National Instrument Corporation, Austin, TX, USA). An algorithm (in Matlab R2013a; MathWorks Inc., Torrance, CA, USA) was developed to calculate time at feeder, feeding time and feeding rate in each compartment (Table 3). Feeding events were determined from the time-series feeder weights. Feed intake from a feeding event was the change of stabilized feeder weight before and after the event. If indeed feed intake took place (i.e. the detected difference was greater than the resolution of the scale, 1.5 g), the duration of the feeding event was referred to as feeding time; otherwise the duration was referred to as time at the feeder (i.e. feeder weight change less than the resolution of the scale, 1.5 g). Because identification of individual birds was not reliable nor focus of the study, total feed intake under each light intensity was summed up to determine the mean daily feed intake (DFI) per hen. The distribution of feed intake under each light intensity relative to the total DFI was then used to delineate the impact of light intensity on the location of feed intake. The mean feeding rate was calculated as the ratio of total feed intake divided by total feeding time. The algorithm of feed intake determination used in this study was similar to that employed by Gates and Xin (Reference Gates and Xin2001). Additionally, eggs laid in each compartment were recorded daily (Table 3).
Temperature and RH inside the LT were continuously measured during the experiment using thermocouples (±0.5°C, Type-T; OMEGA Engineering Inc., Stamford, CT, USA) and a RH sensor (HMT100; Vaisala, Inc., Woburn, MA, USA). Room temperature was also monitored using the same type of thermocouple.
Statistical analysis
The first 4 days of each trial and the first day of each remaining test episode were considered as acclimation periods. As such, only data on the last two days of each test episode were used for subsequent data analysis. Therefore, 16 days (trial 1) or 20 days (trials 2, 3, 4, 5 and 6) of data were included in the statistical analysis. The percentage of time spent (pts) underwent a logarithmic transformation [loge (pts/(1−pts)] to stabilize the variance for statistical model. All data were analyzed using PROC MIXED model in SAS 9.3. The model included light intensity, compartment and their interaction as fixed effects. Trial and the three-way interaction among trials, day and compartment were considered as random effects. Finally a blocked-diagonal matrix for the error term was used, with block corresponding to the interaction between trial and day. Effects were considered significant when P<0.05. The statistical model was of the following form:
 $$Y_{{ijkd}} =\mu {\plus}L_{i} {\plus}C_{j} {\plus}(LC)_{{ij}} {\plus}T_{k} {\plus}(CTD)_{{jkd}} {\plus}{\epsilon}_{{ijkd}} $$
where Y
ijkd
is the response variable on day d of trial k in compartment j with light intensity i, μ the intercept, L
i
the light intensity (<1, 5, 15, 30 and 100 lux) effect, C
j
the compartment (1, 2, 3, 4 and 5) effect, (LC)
ij
the interaction effect of light intensity and compartment,
 $$T_{k} \,\sim\,N(0,\sigma ^{2} )$$
and
 $$CTD_{{jkd}} \,\sim\,N(0,\tau ^{2} )$$
are the random effect. Let
 $${\epsilon}_{{kd}} =({\epsilon}_{{11kd,}} \,\ldots\,,{\epsilon}_{{55kd}} )$$
the error vector for day d and trial k, then
 $$Var({\epsilon}_{{kd}} ){=R$$
is a positive-semidefinite and symmetric matrix.
Results and discussion
Daily time spent
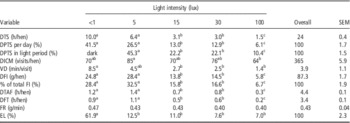
Daily time spent (DTS) in the compartments was significantly affected by light intensity, but not by compartment or light intensity×compartment interaction, indicating a strong preference of the hens for certain light intensities. DTS during the light period of the day was 14 h, of which 6.4±0.5 h (45%) was spent in 5 lux, which was significantly longer than DTS in any of the other three light intensities (Table 4). Hens spent similar amount of time in 15 lux (3.1±0.4 h, 22.2%) and 30 lux (3.0±0.4 h, 22.1%) (P=0.988). DTS in 100 lux (1.5±0.2 h, 6.1%,) was the lowest (P<0.05). The light intensity under which the hens spent longer time was considered as the preferred one. Based on this criterion, during the light period light intensity of 5 lux was preferred by the laying hens over 15 or 30 lux, and 100 lux was least preferred. This result seems consistent with the report by Davis et al. (Reference Davis, Prescott, Savory and Wathes1999) who observed that older poultry preferred dimmer light over brighter light.
Compartment use and feeding behavior of W-36 laying hens provided with free choice of light intensities (<1, 5, 15, 30 and 100 lux)

DTS=daily time spent; DPTS=daily percent of time spent; DICM=daily inter-compartment movement; VD=visit duration; DFI=daily feed intake; FI=feed intake; DTAF=daily time at feeder; DFT=daily feeding time; FR=feeding rate; EL=egg laid.
a,b,cValues within a row with different superscripts differ significantly at P<0.05. Each value is the mean of 116 observations.
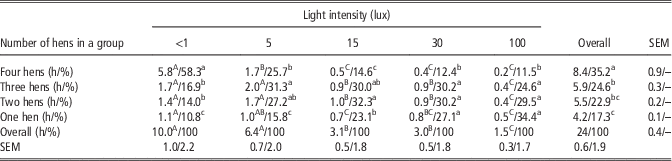
Laying hens are social animals. As such social coherence of the group was considered. The distribution and DTS of different number of hens as a group under the five light intensities are shown in Table 5. The hens spent a cumulative period of 10.0 h under darkness (<1 lux), and 7.5 h or 75.2% involved four or three hens as a group. During the light period, DTS of four or three hens as a group in 5, 15, 30 and 100 lux were, respectively, 3.7 h (57.0% of 6.4 h), 1.4 h (44.6% of 3.1 h), 1.3 h (42.6% of 3.0 h), and 0.6 (36.1% of 1.5 h). In general, 60% of the time three to four hens stayed or moved as a group, 23% of the time two hens moved together, and 17% of the time a hen by herself. Furthermore, the three or four hens as a group spent more time in the lower light intensities than in the higher light intensities. In particular, DTS for the 100 lux was 1.5 h, and 64% of the time involved one or two hens. Social behavior provides the framework for predictable relationships among members of a group through social dominance (Estevez et al., Reference Estevez, Andersen and Nævdal2007). Social discriminations are made by hens under the stress of competition (Syme et al., Reference Syme, Syme and Barnes1983), and animals with higher ranks would have priority of access to resources (Banks et al., Reference Banks, Woodgush, Hughes and Mankovich1979). In this study, ample amount of feed, feeder space and compartment space were available to the hens to avoid potential competition due to feed or space limitations. Although four or three hens stayed together for the most part, separation of the hens in different light intensities existed. Social hierarchy among the hens might be an attributing factor, albeit not confirmed.
Daily time spent (DTS) and distribution of different number of W-36 laying hens as a group under different light intensities (<1, 5, 15, 30 and 100 lux)

a,b,cValues within a column with different superscripts differ significantly at P<0.05.
A,B,CValues within a row with different superscripts differ significantly at P<0.05. Each value is the mean of 116 observations.
Effects of low and bright light intensities on animal welfare had been examined. A few studies have shown that low intensity light, as compared to bright light, can reduce cannibalism and feather pecking and has been used in commercial operations (Kjaer and Vestergaard, Reference Kjaer and Vestergaard1999). At the same time, some studies showed that birds reared in low light intensity at 0.5 or 1 lux resulted in heavier and larger eyes (Deep et al., Reference Deep, Schwean-Lardner, Crowe, Fancher and Classen2010). Blatchford et al. (Reference Blatchford, Klasing, Shivaprasad, Wakenell, Archer and Mench2009) reported that broilers had heavier and lager eyes at 5 lux, whereas Olanrewaju et al. (Reference Olanrewaju, Purswell, Collier and Branton2012) and Deep et al. (Reference Deep, Raginski, Schwean-Lardner, Fancher and Classen2013) found no difference in eye size under 5 lux as compared to birds under higher light intensities. These studies used different light intensities (range from 0.1 to 220 lux), strains (laying hens, turkeys and broilers) and ages (from day-old to 46-week-old), making it difficult to draw concrete conclusions.
Animals generally behave to maximize their welfare and will preferentially choose the variant that is most likely to satisfy their requirements (Dawkins, Reference Dawkins1990). During light period, the W-36 hens spent most of the time under the lower light intensity of 5 lux, but they also spent part of the time under the higher light intensities of 15, 30 and 100 lux. This outcome suggests that the hens may be better served by a variable light intensity environment. It should be noted that the light set-up in the present study, where five levels of light intensity were provided continuously, is not comparable with the practice typical of commercial layer housing where birds are provided consecutive light (e.g. 16) or dark (8) hours per day. Therefore, further work is needed to verify the welfare effects of the light intensities or photoperiod patterns as preferred or displayed by the hens in the present study over an extended period.
DFI and feeding behavior
DFI, daily time at feeder (DTAF) and daily feeding time (DFT) were significantly affected by light intensity, but not by compartment/location or light intensity×compartment interaction. Feeding rate (FR) was not affected by light intensity or compartment. The distribution of DFI in the five light intensities is shown in Table 4. DFI in <1 lux and 5 lux was significantly higher than that in 15, 30 or 100 lux (P<0.05). No significant difference in DFI was observed between 15 and 30 lux (P=0.901). DFI was the lowest in 100 lux (P<0.05). DTAF and DFT followed the similar trend to DFI. DTAF averaged 4.4±0.1 and 3.4±0.1 h of which was spent on actual feeding. This led to an average FR of 0.43±0.04 g/min per hen. No significant difference in FR was detected among the five light intensities (P=0.057 to 0.998).
Prescott and Wathes (Reference Prescott and Wathes2002) studied feeding preference under different light intensities (<1, 6, 20 or 200 lux) of ISA Brown hens and found that the birds chose to eat the most time in the brightest (200 lux) and least in the dimmest (<1 lux) light intensity. Their conclusion was that hens might be averse to eating in very dim light, presumably because the process of eating is normally guided visually. In the present study, feeding light (30 lux) was provided to all compartments except for the <1 lux regimen. The results showed that the hens fed more under the lower light intensities, which was somewhat contrary to the findings of Prescott and Wathes (Reference Prescott and Wathes2002). Moreover, the W-36 hen did not show aversion to feeding in <1 lux.
Interestingly, Malleau et al. (Reference Malleau, Duncan, Widowski and Atkinson2007) found that broiler and layer chicks were very rarely recorded at the feeder or drinker during the lights-off period, but they spent the dark hours resting as a group. Kristensen et al. (Reference Kristensen, Prescott, Perry, Ladewig, Ersboll, Overvad and Wathes2007) found no broilers feeding or drinking during an 8-hour uninterrupted dark (0 lux) at 2 or 6 weeks of age. Savory (Reference Savory1980) reported that fowl did not feed during 8 h periods of darkness, but they did feed during 6 h or shorter dark periods, suggesting that they perceive multiple periods of darkness differently.
Egg production and eggs laid
Throughout the experiment period, four hens laid three or four eggs daily and the hen-day egg production averaged 96.0±0.9%. The proportion of three to four eggs laid in the same compartment amounted to 76.9% of the total eggs produced. Light intensity impacted the location of eggs laid in that the hens laid 61.9±3.6% of total eggs in <1 lux, which was significantly higher than that in 5, 15, 30 or 100 lux (P<0.05) (Table 4). There was no difference among 5 lux (12.5±2.3%), 15 lux (11.0±2.3%), 30 lux (7.6±1.6%) and 100 lux (7.0±1.9%) (P=0.184 to 0.795). Therefore, the hens clearly demonstrated preference of laying eggs in <1 lux over other light intensities.
Appleby et al. (Reference Appleby, Mcrae and Peitz1984) found that birds’ choice of dark (5 lux) or light (20 lux) nest boxes varied with both strain and maturity, although the reason was unclear. It was reported that White Leghorn hens exhibited preference of laying eggs in dark nests; whereas hens derived from Rhode Island Reds were more likely to lay in light nests. Both strains of hens that had previously been laying in open pens showed greater preference for light nests than did pullets. Millam (Reference Millam1987) found that turkey hens were able to discriminate light intensity levels and used light intensity as a cue in their initial selection of nest boxes. These hens preferred next boxes with low light intensity over those with high light intensity. The difference in egg-laying behavior responses to light intensity among the different strains may help explain why the W-36 hens showed a strong motivation of laying eggs in low light intensity (<1 lux) as observed in the current study.
Daily inter-compartment movement and visit duration
Light intensity, compartment and their interaction had effects on daily inter-compartment movement (DICM). DICM and visit duration (VD) under different light intensities are shown in Table 4. The only significant difference in DICM occurred between 5 lux (85±6 visits/hen) and 100 lux (64±6 visits/hen) (P<0.05). The otherwise similar DICM values seem to suggest that the hens experienced or explored all the light intensities during the preference test. However, it was difficult to discern a particular DICM resulting from preference for the light intensity v. mere passing-through to reach other light intensity. VD in <1 lux (8.5±1.1 min/visit) was significantly greater than those of the other light intensities (P<0.05). VD can provide information on an animal’s motivation to exit or enter a specific environment, hence reflecting the natural exploratory behavior of most animal species (Kristensen et al., 2000).
Light and dark rhythm
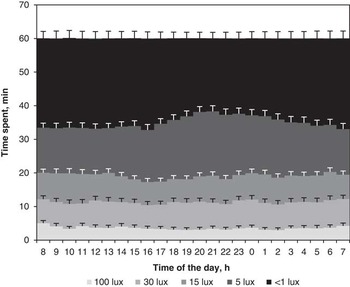
Light intensity associated with the definition of dark has been reported to range from 0 to 4 lux (Coenen et al., Reference Coenen, EMTJ, Van Luijtelaar and Blokhuis1988; Malleau et al., Reference Malleau, Duncan, Widowski and Atkinson2007). The light intensity of <1 lux was considered as dark in the present experiment. Figure 3 depicts the diurnal pattern of hourly time spent in each light intensity. It can be seen that TS in the dark (<1 lux) and light (sum of TS in 5, 15, 30 and 100 lux) was intermittently distributed in each hour; and that hens did not display distinct circadian rhythmicity of light v. dark photoperiod. The mean hourly TS in the dark was 25.0±0.4 min and it was by and large consistent throughout the day. The daily total TS in the dark (<1 lux) and light (sum of 5, 15, 30 and 100 lux) was 10.0±0.7 h and 14.0±0.7 h, respectively (P<0.001).
Diurnal distribution of time spent (TS) under different light intensities (<1, 5, 15, 30 and 100 lux) by W-36 laying hens when given free choice. Each hourly TS value is the mean of 116 observations. SE bars were displayed on the top of each column.

Savory and Duncan (Reference Savory and Duncan1982) investigated the preference of female broilers (7 to 13 weeks of age) and layers (19 to 66 weeks of age) for light and dark by training them to peck on a panel to switch light on or off. They also showed birds distributing light and dark intermittently in every hour. The authors augured that bird’s requirements for darkness may depend on whether or not they prefer to sleep in the dark. Davis et al. (Reference Davis, Prescott, Savory and Wathes1999) investigated light intensity (6, 20, 60 and 200 lux) preference of pullets and broilers at 2 or 6 weeks of age using continuously lights on, and found no significant circadian rhythm in using 6 or 200 lux by the broilers at 2 or 6 weeks, or the pullets at 2 weeks.
It is interesting to note the differences between the findings of the current study and what is typically practiced in the commercial production settings. First, the overall daily photoperiod of 14L : 10D revealed in the present study was intermittently distributed, as compared to the photoperiod of 16 consecutive hours of light followed by 8 consecutive hours of dark (16L : 8D) typically practiced in commercial operation. Second, the total dark period of 10 h from the present study is longer than the typical 8 h used in commercial practice. While the underlying reason for the longer dark period remains to be better understood, the results seem to suggest that the hens may be better served by intermittent lighting and different duration of darkness. Further studies to assess the impact of the preferred light intensities and hourly rhythm on the welfare and performance of laying hens over extended period are advisable.
Summary and conclusions
Preference of W-36 laying hens (23 to 30 weeks of age) to fluorescent light intensity of <1, 5, 15, 30 or 100 lux was assessed using free-choice tests. The hens showed the following behavioral responses.
-
1. Preference of staying in dimmer light (5 lux) over 15 or 30 lux, with 100 lux being least preferred during light period. The 14 h daily light period was distributed as 6.4 h (45.4%) in 5 lux, 3.1 h (22.2%) in 15 lux, 3.0 h (22.1%) in 30 lux, and 1.5 h (10.4%) in 100 lux.
-
2. Preference to feed in 5 lux (28.4 g/hen, 32.5% of DFI) with a feeder light of 30 lux or <1 lux (24.8 g/hen, 28.4%) without feeder light, as compared to 15 lux (13.8 g/hen, 15.8%), 30 lux (14.5 g/hen, 16.6%) and 100 lux (5.8 g/hen, 6.7%) all with a feeder light of 30 lux.
-
3. Strong preference of laying egg in ‘dark’ (<1 lux) over light, with 61.9% of their eggs laid in <1 lux.
-
4. A daily overall photoperiod of 14L : 10D. However, the intermittent hourly light and dark time was distributed quite consistently throughout the day, with time spent in the ‘dark’ (<1 lux) condition averaging 25.0±0.4 min per hour.
Acknowledgments
This study was funded by Iowa State University, China Agricultural Research System for laying hens (CARS-41) and Key Technologies and Integration of Environmental Control for Livestock and Poultry Breeding (2012BAD39B02). The authors thank the commercial hen farms for providing the birds and feed used in this study. The assistance by undergraduate students – Jace Klein, Haocheng Guo, Kyle Dresback in the system development and data processing was greatly appreciated. Author He Ma also thanks China Scholarship Council (CSC) for supporting her 2-year research and study at Iowa State University.