“I don't think Mitt Romney is the President's opponent. The economy is.”
—Rahm Emanuel“We're killing [the enemy] at a ratio of ten to one.”
—General William Westmoreland, US Commander in Vietnam.“Westy, the American people don't care about the ten. They care about the one.”
—Senator Ernest Hollings, during a visit to his fellow South Carolinian in the field.A TWO-FACTOR MODEL BASED ON OBJECTIVELY MEASURED POLITICAL-ECONOMIC FUNDAMENTALS
According to the Bread and Peace Model postwar, American presidential elections should be interpreted as a sequence of referendums on the incumbent party's record during its four-year mandate period. In fact postwar aggregate votes for president are well explained by just two objectively measured fundamental determinants: (1) weighted-average growth of per capita real disposable personal income over the term, and (2) cumulative US military fatalities due to unprovoked, hostile deployments of American armed forces in foreign wars. No other outside variable systematically affects postwar aggregate votes for president.Footnote 1
Factor 1: Bread
Economic performance usually is the dominant factor. The incumbent party is rewarded for good real income growth performance and punished for poor performance, with growth rates closer to the election date receiving more weight than outcomes earlier in the term. Voting is retrospective.Footnote 2
Growth of per capita real disposable personal income is the broadest single aggregate measure of changes in the electorate's economic well-being in as much as it includes income from all market sources and transfer payments to persons, is adjusted for inflation, population growth, and taxes and is correlated with changes in central real-economy variables like unemployment and per capita real GDP.Footnote 3 Accordingly, changes in economic performance are best measured by a weighted-average of (annualized, quarterly) growth rates of per capita real disposable personal income, computed from the election quarter back to the first full quarter of each presidential term.
Factor 2: Peace
The second factor systematically affecting postwar aggregate votes for president is US military fatalities due to unprovoked, hostile deployments of American armed forces in foreign conflicts; namely the military interventions in Korea, Vietnam, Iraq, and Afghanistan. My research shows that the electoral penalties exacted by those wars affect the presidential vote of the party initiating the unprovoked commitment of US forces—the Republicans for Iraq, and the Democrats for Korea, Vietnam, and most recently Afghanistan—and those vote penalties are proportionate to the cumulative number of American military fatalities per millions of US population over the presidential term (Hibbs Reference Hibbs2000; Hibbs Reference Hibbs2008). Presidents inheriting unprovoked foreign wars from the opposition party are given a one-term grace period before US fatalities begin to depress the incumbent vote share. Hence Richard Nixon's vote in 1972 was not affected by US fatalities in Vietnam because the Vietnam War was inherited from Lyndon Johnson. And Barack Obama's vote in 2012 will not be affected by fatalities in Iraq because the Iraq War was inherited from George W. Bush.
The Bread and Peace Model regards American fatalities in Afghanistan under G.W. Bush following “9/11” as owing to a provoked commitment of US forces. Consequently, unlike the Iraq War, fatalities in Afghanistan did not detract from Bush's vote in 2008. However, US fatalities in Afghanistan beginning with President Obama's prolonged “war of necessity” against the Taliban more than seven years later are treated as due to an unprovoked foreign war. As a result, under the Bread and Peace Model those fatalities will affect negatively the Democratic Party's presidential vote in the 2012 election. Fatalities exert no systematic influence on aggregate congressional election outcomes.
Other Factors
Other factors of course influence presidential voting, potentially so dramatically that the systematic influence of Bread and Peace fundamentals may be overwhelmed. However, such events are transitory rather than persistent, they vary randomly from election to election, and they typically defy ex-ante objective measurement. The accounts by talking heads, and even analyses by thoughtful journalists and academic experts, are sometimes populated with stories revolving around election-specific idiosyncratic factors and fanciful ad-hoc variables whose true influence can be assessed scientifically only by statistical conditioning on persistent fundamentals.
In 2008, Obama's race and McCain's age were prominent idiosyncratic factors, though in the end neither exerted perceptible net effect on the election outcome. Race will never again figure significantly in presidential politics, and that will be Obama's greatest positive legacy to democracy in America.Footnote 4 In 2012 the main idiosyncratic issues appear to be gay marriage, immigration policy, Romney's religion and financial affairs, and the Affordable Care Act upheld on June 28, 2012 by the Supreme Court. On the personality dimension we have Romney's social awkwardness and distance by contrast to Obama's hip-cool. None of those factors played a role in earlier elections and all will have disappeared by 2016, and maybe even by Election Day 2012.
BREAD AND PEACE MODEL MECHANICS
The Bread and Peace Model is writtenFootnote 5
 $$
p(y|f_1^{2012} ,f_2^{2012} , \ldots ,f_K^{2012} ) = \sum\limits_{k = 1}^K {w_k N(f_k^{2012} ,\sigma ^2 ),}
$$
where: Vote is the percentage share of the two-party vote received by the incumbent party's candidate. R is per capita disposable personal income deflated by the Consumer Price Index and ΔlnR is the quarter-to-quarter log-percentage change expressed at annual rates, computed ΔlnR t = ln(R t /R t−1)·400. λ is a lag weight (0 ≤ λ ≤ 1), and the reciprocal of the sum of the weights, 1/∑j=014λj, scales the real income growth rate sequence ΔlnR t + λΔlnR t−1 + λ2ΔlnR t−1 + ··· + λ14ΔlnR t−14 so that the coefficient β1 represents the effect on the incumbent vote share of each log-percentage point of annualized, quarter-to-quarter real income growth sustained over the presidential term. As the weighting parameter λ approaches a value of 1.0 the incumbent party vote share is affected by a simple average of per capita real income growth rates over the whole term—growth at the beginning of the term has the same electoral impact as growth just before the election. As λ approaches zero only the election quarter growth rate affects votes for president. Values of λ between 0 and 1 reveal the relative effects of real income growth rates just before the election as compared to growth rates earlier in the term.Footnote 6 Fatalities denotes the cumulative number of American military fatalities per millions of US population in Korea, Vietnam, Iraq, and Afghanistan during the presidential terms preceding the 1952, 1964, 1968, 1976 and 2004, 2008, and 2012 elections.
Interpretation of Coefficient Estimates
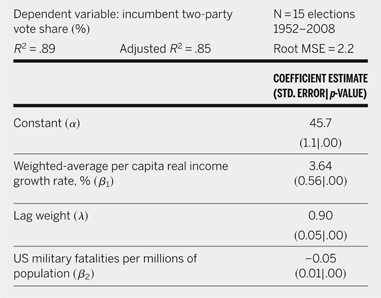
Table 1 reports nonlinear least-squares coefficient estimates and related statistics of the Bread and Peace equation fit to 15 postwar presidential elections, 1952–2008.Footnote 7
Bread and Peace Equation Estimates

The parameter estimate for weighted-average per capita real disposable personal
income growth,  = 3.6,
means that each log-percentage point of real income growth sustained over a
presidential term boosts the in-party candidate's vote share by about 3.6 percentage
points above a benchmark constant,
 , of
approximately 46%. The lag weight parameter estimate,
 = 0.9,
implies that the per capita real income growth rate in the last full quarter before
an election (q3 of election years) has almost four times the electoral impact of
income growth in the first full quarter of the term (q2 of inauguration years):
.9/.914 = 3.9. And the fatalities coefficient,
 =
−0.05, means that each 100 US military fatalities per millions of population owing
to hostile deployments of US armed forces in unprovoked wars depresses the incumbent
vote by 5 percentage points.
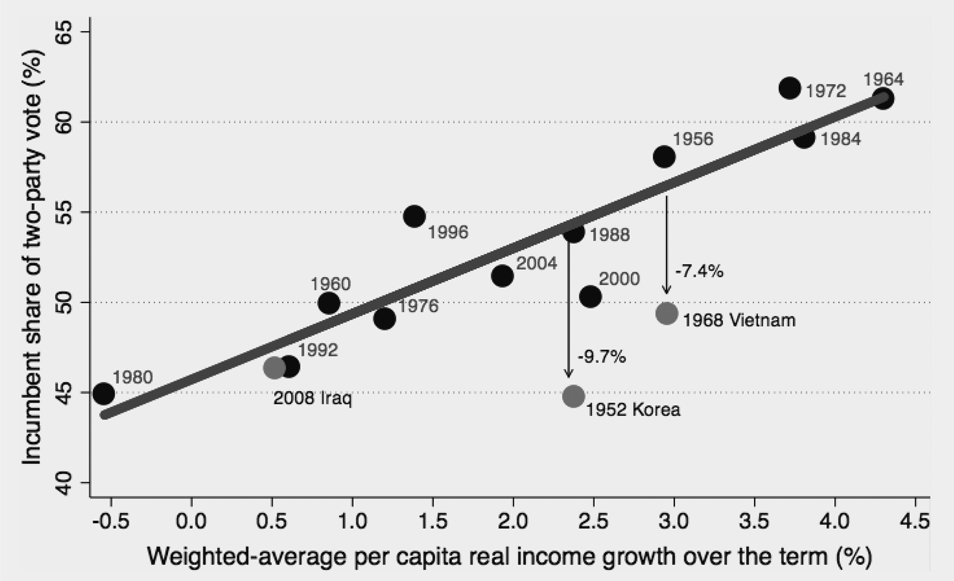
Figure 1 graphs the remarkably close connection of major-party vote shares received by incumbent party candidates to weighted-average per capita real income growth rates at postwar presidential elections 1952–2008. Notice that the two elections regarded as the most “ideological” in postwar American presidential politics—1964 and 1980—are explained almost perfectly by real income growth over the presidential term.
Bread and Peace Voting in US Presidential Elections 1952–2008
Regression line and war effects computed from Bread and Peace equation estimates.
Source: www.douglas-hibbs.com October 27 2011.

In 1964 the Democratic Party incumbent Lyndon Johnson, the most important agent of American welfare-state liberalism since Franklin Roosevelt, faced Barry Goldwater, the godfather of modern American conservatism. Johnson won with 61.3% of the vote, one of the biggest margins in US presidential election history. The result was widely viewed as a popular rejection of Goldwater's alleged right-wing views on the federal government's proper role in society and economy and his bellicose posture on America's Cold War rivalry with the Soviet Bloc. Yet one need not appeal to such grand ideological themes to explain the 1964 election result. Johnson's landslide victory conforms exactly to the historical connection between presidential voting outcomes and weighted-average real income growth over the term.
In 1980 the incumbent Jimmy Carter faced Ronald Reagan, Goldwater's successor as the icon of the Republican Party's conservative wing. Unlike the Johnson-Goldwater contest in 1964, this time the arch conservative Reagan trounced the liberal Carter. The election was commonly interpreted in the media as signaling a fundamental “shift to right” among American voters (Hibbs Reference Hibbs1982). Yet, again, one need not appeal to grand ideological themes. As shown by figure 1, Carter's big loss (he received only 44.8% of the vote—tied for the worst election showing by an incumbent party presidential candidate during the postwar era) was the predictable consequence of poor weighted-average real income growth over the 1977–80 term.
The elections of 1952 and 1968 exhibit the biggest deviations from the statistical prediction line based on real income growth performance. Those deviations are explained by the second fundamental determinant of votes for president: American military fatalities in unprovoked foreign wars. High cumulative US military fatalities in Korea at the time of the 1952 election (29,260 or 190 per millions of population), and in Vietnam at the 1968 election (28,900 or 146 per millions of population), most likely caused Adlai Stevenson's loss to Dwight Eisenhower in 1952 by depressing the incumbent party's presidential vote by almost 10 percentage points, and almost certainly caused Hubert Humphrey's loss to Richard Nixon in 1968 by depressing the incumbent party's vote by more than 7 percentage points. Absent America's interventions in the Korean and Vietnamese civil wars, the strong real income growth record prior to those elections (particularly in 1968) should easily have kept the Democrats in the White House.
In the Bread and Peace Model presidents get a one-term grace period when unprovoked foreign wars are inherited from the opposition party. Hence the 1956 vote for Dwight Eisenhower (who inherited American involvement in the Korean civil war from Harry Truman) was unaffected by the relatively small number of US military fatalities in Korea after Eisenhower assumed office in 1953. In like fashion, the 1972 vote for Richard Nixon (who inherited American involvement in the Vietnamese civil war from Lyndon Johnson) was unaffected by the large (but declining) number of US fatalities accumulated in Vietnam after Nixon assumed office in 1969. In principle, military fatalities due to discretionary American involvement in foreign conflicts might have affected the 1964, 1976, 2004, and 2008 elections, but the impact on aggregate votes was negligible because the fatality numbers were (politically) small.Footnote 8
The only postwar presidential election results not well explained by the Bread and Peace Model are 1996 and 2000. In 1996 the vote received by the incumbent Democrat Clinton was 4% higher than expected from political-economic fundamentals, whereas in 2000 the vote for the incumbent Democratic Party candidate Gore was 4.5% less than expected from fundamentals. I am tempted to argue that idiosyncratic influence of candidate personalities took especially strong form in those elections, with the ever-charming Bill Clinton looking especially attractive when pitted against the darkly foreboding Bob Dole in 1996, and the unfailingly wooden Al Gore paling by comparison to an affable George W. Bush in 2000. Alas, this line of reasoning is entirely ad hoc and without scientific merit.
TRENDS AND SENTIMENTS
The Bread and Peace Model aims to pin down quantitatively the persistent influence of objectively measured political-economic fundamentals on aggregate votes for president, rather than to predict votes optimally or to track them statistically after the fact. For those reasons the model includes no arbitrarily coded dummy, count, trend, and related time-coded variables, which are not objective measurements of policies and performance affecting voters. Likewise the Bread and Peace Model makes no use of preelection poll readings of voter sentiments, preferences, and opinions. Attitudinal variables are endogenous: they are affected causally by objective fundamentals and consequently supply no insight into the root causes of voting behavior, no matter how much they may enhance accuracy of prediction.
THE 2012 PRESIDENTIAL ELECTION
George Stephanopoulos of ABC News: “Are you the underdog now?”
President Obama: “Absolutely, given the economy.”—October 3, 2011.Footnote 9
But how much of an underdog? And might Obama's fortunes turn around?
The Situation So Far
During the first 13 full quarters of President Obama's term, 2009:q2 through 2012:q2, which at time of this writing (July 27, 2012) covers the most recent quarter for which we have Bureau of Economic Analysis (BEA) data on the National Income and Product Accounts, the annualized, weighted-average quarterly growth rate of per capita real disposable personal income was only 0.1%; way below the post-1948 average of 1.8%. Over the same period US fatalities in Afghanistan totaled 1,355, amounting to 4.4 per millions of population. Poor real income growth performance all by itself means that Obama is in deep trouble: the Bread and Peace equation estimates in table 1 imply that over-the-term weighted-average real growth must be at least 1.2% for the incumbent's expected two-party vote share to cross 50%.Footnote 10
Election Day Projections
To project Obama's 2012 vote I make the plausible assumption that American military fatalities in Afghanistan continue running at the (politically relatively low) average quarterly rate of the past year: 95 or 0.3 per millions of population. At Election Day cumulative Fatalities then would amount to approximately 1,500 or 4.8 per millions of population, which would depress Obama's expected two-party vote share by less than a quarter of a percentage point (−0.5·4.8 = −0.24%). Barring a really big escalation in the aggressiveness of fighters resisting US military presence in Afghanistan, plausible alternative assumptions about the flow of American body bags during the next four months would only negligibly affect my projections of Obama's reelection prospects. Consequently, growth rates of per capita real disposable personal income over the remainder of the term will be the decisive as yet unrealized fundamental factor in the 2012 presidential election.
Calculations in table 2 show that according to the Bread and Peace Model per capita real income growth rates must average out at more than 6% after 2012:q2 for Obama to have a decent chance of reelection. If the US economy experiences an unanticipated reversal of fortune with growth surging to rates not uncommon in the initial robust phase of recoveries from deep contractions, Obama could squeak out a win, as implied by the last column of table 2. However the pace of recovery from the 2008 Great Recession remains sluggish, and the famous 2009 book This Time Is Different: Eight Centuries of Financial Folly by Carmen Reinhart and Kenneth Rogoff documents how recoveries from contractions originating with the bursting of speculative financial bubbles are not V-shaped as in garden-variety recessions, but instead are typically prolonged U-shaped affairs lasting 5 to 6 years. The univariate statistical properties of postwar per capita real disposable personal incomes indicate that the chances of weighted-average growth on the order of 6% over the one and one-third quarters remaining until Election Day 2012 are no better than 1/10.
Obama's Expected Two-Party Vote Share at Hypothetical Real Income Growth Rates 2012:q3–2012:q4

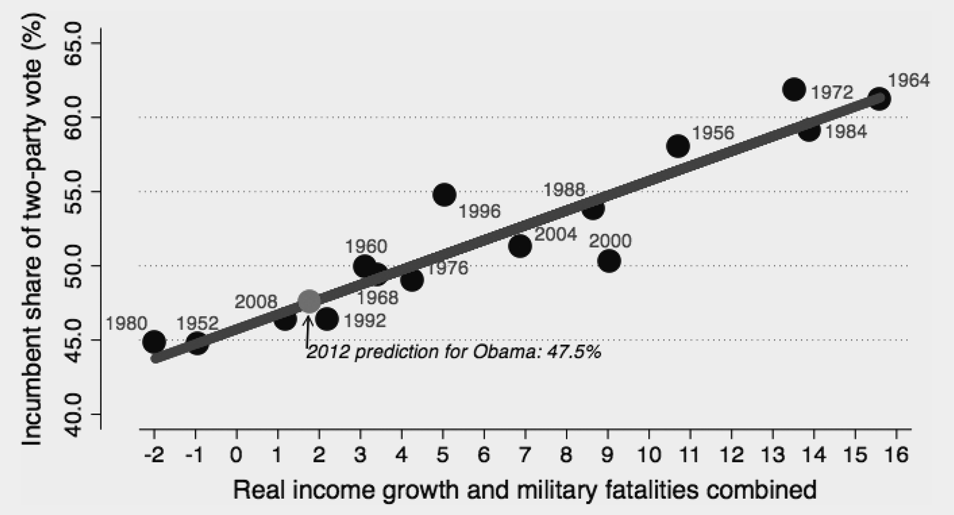
The protocol of the PS Election Forecast Symposium obliges me to make a specific prediction of the 2012 aggregate voting result. My reading of the tea leaves (statistical forecasts of income and output growth from formal econometric models have proven to be useless) leads me to posit that quarterly, annualized per capita real income growth rates will fall in the interval [1,2%] during the remainder of President Obama's term. That supposition, along with my assumption that fatalities in Afghanistan will not escalate dramatically, yields a projected Obama two-party vote share centered at 47.5%, as indicated by boldface entries in table 2.Footnote 11 Figure 2, which combines the Bread and Peace factors to one dimension, illustrates the same prediction in perspective of actual and fitted values of incumbent vote shares at all postwar presidential elections 1952–2008.
Obama's Reelection Prospect under Bread and Peace Voting 2012 Prediction Based on Projections of 2012q3–2012q4 Conditions
Combination of real growth and fatalities weights each variable by its estimated coefficient. Estimated effects of fatalities on vote shares: −0.7% in 2008 (Iraq), −7.4% in 1968 (Vietnam), −9.7% in 1952 (Korea); negligible in 1964, 1976, 2004, 2012, and null in other years.
Source: www.douglas-hibbs.com July 27 2012

Yet remember that transitory, idiosyncratic issues and events potentially can overcome the persistent impact of Bread and Peace fundamentals. The standard error (Root Mean Square Error) of the Bread and Peace Model is 2.2%. A positive aggregate idiosyncratic “shock” of just two standard errors (a 2 sigma event), which hardly is of Black Swan magnitude, would push Obama's vote share to almost 52%, even if my guess of a 1–2 percent average per capita real income growth over the last 4 months of the term turns out to be accurate and even if the functional form of the Bread and Peace model is spot on.
I am aware that my forecast of a fairly big loss by President Obama deviates substantially from prevailing views—particularly those in which I generally put greatest stock: betting price data at the Iowa Electronic Market and Intrade. During the last week of July 2012 betting data implied that President Obama's chances for reelection were above 58%.