1 Introduction
Runaway acceleration of an electron in a plasma occurs if the electric field exceeds a critical value, above which the friction force on the electron from collisions with other plasma particles becomes smaller than the force from the electric field (Wilson Reference Wilson1925). Electrons can enter the runaway region in velocity space as a result of a random walk caused by long-range Coulomb collisions (primary or Dreicer generation) (Dreicer Reference Dreicer1959). If there is an initial population of fast electrons in the plasma, they may produce secondary runaway electrons via close collisions – leading to an exponential multiplication of the fast-electron population – an avalanche (Sokolov Reference Sokolov1979). Secondary generation of runaway electrons is expected to be substantial in future high-current tokamak disruptions (Jayakumar, Fleischmann & Zweben Reference Jayakumar, Fleischmann and Zweben1993; Rosenbluth & Putvinski Reference Rosenbluth and Putvinski1997), and successful mitigation is required to prevent unacceptable wall damage if a runaway population is formed (Boozer Reference Boozer2015; Reux et al. Reference Reux, Plyusnin, Alper, Alves, Bazylev, Belonohy, Boboc, Brezinsek, Coffey and Decker2015).
The most promising runaway-mitigation method is to inject impurities which dissipate the runaway beam by collisional scattering (Hollmann et al. Reference Hollmann, Aleynikov, Fülöp, Humphreys, Izzo, Lehnen, Lukash, Papp, Pautasso and Saint-Laurent2015). Due to the low temperatures of the post-disruption plasma, the impurities will only be partially ionized. Since the collision frequencies scale strongly with charge, the runaway dissipation rate will be heavily influenced by the extent to which fast electrons can penetrate the bound electron cloud around the impurity ion, i.e. the effect of partial screening.
Partial screening has a strong effect on collision frequencies (Kirillov, Trubnikov & Trushin Reference Kirillov, Trubnikov and Trushin1975; Mosher Reference Mosher1975; Lehtinen, Bell & Inan Reference Lehtinen, Bell and Inan1999; Dwyer Reference Dwyer2007; Zhogolev & Konovalov Reference Zhogolev and Konovalov2014; Hesslow et al. Reference Hesslow, Embréus, Stahl, Dubois, Papp, Newton and Fülöp2017), which calls for accurate models of the collisional processes. Such a model requires a quantum-mechanical treatment of both elastic and inelastic collisions, as well as knowledge of the electronic charge density of the impurity ion. Previous treatments of partially screened elastic electron–ion collisions are limited to either a semi-classical treatment (Mosher Reference Mosher1975; Martín-Solís, Loarte & Lehnen Reference Martín-Solís, Loarte and Lehnen2015), or employ the Thomas–Fermi theory for the electron charge density (Kirillov et al. Reference Kirillov, Trubnikov and Trushin1975; Zhogolev & Konovalov Reference Zhogolev and Konovalov2014), which is limited to intermediate distances from the nucleus, and does not capture the shell structure of the ion (Landau & Lifshitz Reference Landau and Lifshitz1958). Therefore, in a recent paper we presented a collision operator based on a quantum-mechanical treatment of both elastic and inelastic collisions, and used density functional theory (DFT) to obtain the electron-density distribution of the impurity ions (Hesslow et al. Reference Hesslow, Embréus, Stahl, Dubois, Papp, Newton and Fülöp2017). This generalization of the Fokker–Planck operator to a partially ionized plasma was expressed as modifications to the deflection and slowing-down frequencies, and it was shown that both frequencies increased significantly compared to the case of complete screening, already at subrelativistic energies. This generalized operator was used by Hesslow et al. (Reference Hesslow, Embréus, Wilkie, Papp and Fülöp2018) to derive an analytical expression including the effect of screening and radiation on the effective critical field for runaway formation and runaway current decay.
The present paper details the theoretical basis of the collision operator in Hesslow et al. (Reference Hesslow, Embréus, Stahl, Dubois, Papp, Newton and Fülöp2017) and applies it to investigate the effects of partial screening on runaway electron dynamics. We compare these results with the predictions from the approximate Thomas–Fermi theory. Using the generalized collision operator, we present a detailed analysis of the steady-state runaway avalanche growth rate in the presence of partially ionized atoms. The increased collisional rates with partially ionized impurities lead to a substantially increased critical electric field for runaway generation (Hesslow et al. Reference Hesslow, Embréus, Wilkie, Papp and Fülöp2018). However, when the electric field is significantly larger than the critical field, the runaway avalanche growth rate is considerably higher than in the complete-screening case – corresponding to a fully ionized plasma with the same net ion charge. This behaviour, which contradicts previous predictions (Putvinski et al. Reference Putvinski, Fujisawa, Post, Putvinskaya, Rosenbluth and Wesley1997), produces an additional layer of complexity when evaluating the effect of partially ionized impurities on the number of runaway electrons.
The presence of partially ionized impurities enhances the relative frequency of large-angle collisions, which are beyond the Fokker–Planck formalism. We therefore investigate the validity of the Fokker–Planck operator by comparing it to the more general Boltzmann operator. The results show that the Fokker–Planck operator accurately captures the key quantities, such as the runaway density and current, only the synchrotron emission spectrum at large electric fields is slightly less accurate. This demonstrates that the generalized collision operator derived here is adequate for most runaway studies.
The structure of the paper is as follows. Section 2 details the derivation of the generalized collision operator for fast electrons in the presence of partially ionized impurities. In § 3, we investigate the effects of screening on the avalanche growth rate. Section 4 compares the results obtained using the Fokker–Planck operator to the corresponding ones using the Boltzmann operator. Finally, § 5 summarizes our conclusions.
2 Generalized collision operator for fast electrons in a plasma with partially ionized impurities
There are two types of collisions between fast electrons and partially ionized atoms: elastic collisions, where the state of the ion remains unchanged during the collision and the incident electron is only deflected with a negligible energy transfer; and inelastic collisions, where the ion is excited or further ionized, causing the incident electron to impart a fraction of its kinetic energy to the bound electrons. For fast electrons, both types of collisions can be treated using the Born approximation. In the case of elastic collisions, this requires knowledge of the electronic charge density of the impurity ion, which we obtain from DFT calculations. In contrast, the inelastic collisions with bound electrons primarily lead to collisional friction; the rate of pitch-angle scattering against bound electrons is smaller than the rate against ions by approximately a factor of the charge number (the full nuclear charge)
 $Z\gg 1$
. This allows us to model collisions with bound electrons with Bethe’s theory for the collisional stopping power (Bethe Reference Bethe1930) without the need for detailed differential cross-sections for these processes.
In both processes, the target particle can be treated as stationary since we consider incident suprathermal electrons. The average momentum of the bound electrons must be below the thermal electron momentum at a given temperature if the ionization state is roughly equilibrated with the electron temperature. Moreover, the ion thermal speed fulfils
 $v_{T\text{i}}\ll v_{T\text{e}}$
due to the small electron-to-ion mass ratio. Consequently, the collision operator presented here is valid for electron speeds
 $v$
fulfilling
(i)
 $v/c\gg Z\unicode[STIX]{x1D6FC}$
(the Born approximation), with
$\unicode[STIX]{x1D6FC}\approx 1/137$
the fine-structure constant. The Born approximation may be accurate even at lower energies, as it has been experimentally verified for incident electron energies from 1 keV and above for argon and neon, which are particularly relevant for fusion experiments (Mott et al.
Reference Mott and Massey1965).
(ii)
$\unicode[STIX]{x1D6FE}-1\gg I_{j}/(m_{\text{e}}c^{2})$
(Bethe’s stopping power formula), where
$\unicode[STIX]{x1D6FE}$
is the Lorentz factor and
$I_{j}/(m_{\text{e}}c^{2})$
is the mean excitation energy of the ion normalized to the electron rest energy, which is of the order
$10^{-4}$
–
$10^{-3}$
for argon and neon, increasing with ionization degree (Sauer, Oddershede & Sabin Reference Sauer, Oddershede and Sabin2015).(iii)
$v\gg v_{T\text{i}}$
(ions at rest).


By matching the high-energy expressions describing the effects of partial screening to the completely screened low-energy limit, where the electron only interacts with the ion through the net ion charge number
 $Z_{0}$
, we obtain a collision operator which can be applied at all energies, although it is known to be correct only when the conditions above are fulfilled.
2.1 The Fokker–Planck operator
The Fokker–Planck collision operator between species
 $a$
and
 $b$
is given by
 $$\begin{eqnarray}C^{\mathit{ab}}=-\unicode[STIX]{x1D735}_{k}(f_{a}\langle \unicode[STIX]{x0394}p^{k}\rangle _{\mathit{ab}})+{\textstyle \frac{1}{2}}\unicode[STIX]{x1D735}_{k}\unicode[STIX]{x1D735}_{l}(f_{a}\langle \unicode[STIX]{x0394}p^{k}\unicode[STIX]{x0394}p^{l}\rangle _{\mathit{ab}}),\end{eqnarray}$$
where the term
 $\langle \unicode[STIX]{x0394}p^{k}\rangle _{\mathit{ab}}$
represents the average change in the
 $k$
th component of the momentum of the incoming electron during a collision, while
 $\langle \unicode[STIX]{x0394}p^{k}\unicode[STIX]{x0394}p^{l}\rangle _{\mathit{ab}}$
describes the change in the tensor
 $p^{k}p^{l}$
. Moreover,
 $p=\unicode[STIX]{x1D6FE}v/c$
, and
 $\unicode[STIX]{x1D735}_{k}$
refers to the momentum-space gradient operator. These moments are given by


where  is the Møller relative speed and
 $\text{d}\unicode[STIX]{x1D70E}_{\mathit{ab}}/\text{d}\unicode[STIX]{x1D6FA}$
is the differential scattering cross-section between species
 $a$
and
 $b$
. Here, the angular integral is taken over
 $$\begin{eqnarray}\int \text{d}\unicode[STIX]{x1D6FA}=\int _{\unicode[STIX]{x1D703}_{\text{min}}}^{\unicode[STIX]{x03C0}}\sin \unicode[STIX]{x1D703}\,\text{d}\unicode[STIX]{x1D703}\int _{0}^{2\unicode[STIX]{x03C0}}\text{d}\unicode[STIX]{x1D719},\end{eqnarray}$$
where the Coulomb logarithm, a large factor which will be described in more detail in § 2.2, enters through
 $\ln \unicode[STIX]{x1D6EC}=\ln (2/\unicode[STIX]{x1D703}_{\text{min}})$
. The Fokker–Planck operator can formally be seen as an expansion of the Boltzmann operator in small momentum transfers, which is motivated by the rapid decay of the Coulomb collision differential cross-section with momentum transfer;
 $\text{d}\unicode[STIX]{x1D70E}_{\mathit{ab}}/\text{d}\unicode[STIX]{x1D6FA}\sim \sin ^{-4}(\unicode[STIX]{x1D703}/2)$
. This grazing collision nature of Coulomb interaction translates to a prefactor of
 $\ln \unicode[STIX]{x1D6EC}$
when the collision operator is evaluated explicitly. Consequently, the Fokker–Planck operator only retains the terms of order
 $\ln \unicode[STIX]{x1D6EC}$
in (2.1).
When species
 $b$
has a Maxwellian distribution, the resulting collision operator is parametrized by the three collision frequencies
 $\unicode[STIX]{x1D708}_{\text{D}}^{\mathit{ab}}$
,
 $\unicode[STIX]{x1D708}_{S}^{\mathit{ab}}$
and
 $\unicode[STIX]{x1D708}_{\Vert }^{\mathit{ab}}$
, describing deflection at constant energy (pitch-angle scattering), collisional friction and parallel (energy) diffusion (Helander & Sigmar Reference Helander and Sigmar2005):
 $$\begin{eqnarray}C^{\mathit{ab}}=\unicode[STIX]{x1D708}_{\text{D}}^{\mathit{ab}}{\mathcal{L}}(f_{a})+\frac{1}{p^{2}}\frac{\unicode[STIX]{x2202}}{\unicode[STIX]{x2202}p}\left[p^{3}\left(\unicode[STIX]{x1D708}_{S}^{\mathit{ab}}f_{a}+\frac{1}{2}\unicode[STIX]{x1D708}_{\Vert }^{\mathit{ab}}p\frac{\unicode[STIX]{x2202}f_{a}}{\unicode[STIX]{x2202}p}\right)\right].\end{eqnarray}$$
The pitch-angle scattering operator
 $$\begin{eqnarray}{\mathcal{L}}=\frac{1}{2}\frac{\unicode[STIX]{x2202}}{\unicode[STIX]{x2202}\unicode[STIX]{x1D709}}(1-\unicode[STIX]{x1D709}^{2})\frac{\unicode[STIX]{x2202}}{\unicode[STIX]{x2202}\unicode[STIX]{x1D709}},\end{eqnarray}$$
represents scattering at constant energy, and is proportional to the angular part of the Laplace operator. Here it is specialized to azimuthally symmetric systems, and
 $\unicode[STIX]{x1D709}=\boldsymbol{p}\boldsymbol{\cdot }\boldsymbol{B}/(pB)$
is the cosine of the pitch angle with respect to a preferred direction, set here by an applied magnetic field
 $\boldsymbol{B}$
.
2.2 The Coulomb logarithm
The Coulomb logarithm
 $\ln \unicode[STIX]{x1D6EC}$
determines a minimum scattering angle below which Debye shielding screens out long-range interaction. Furthermore, it quantifies the dominance of small-angle collisions compared to large-angle collisions, and therefore provides a measure of the validity of the Fokker–Planck operator, which only captures small-angle collisions accurately. For electrons,
 $\ln \unicode[STIX]{x1D6EC}$
is the logarithm of the Debye length divided by the de Broglie wavelength, which depends on the electron energy (Solodov & Betti Reference Solodov and Betti2008). At thermal speeds, the Coulomb logarithm is given by (Wesson Reference Wesson2011)
 $$\begin{eqnarray}\ln \unicode[STIX]{x1D6EC}_{0}\approx 14.9-0.5\ln n_{\text{e}20}+\ln T_{\text{keV}},\end{eqnarray}$$
where
 $T_{\text{keV}}$
is the temperature in keV and
 $n_{\text{e}20}$
is the free-electron density in units of
 $10^{20}~\text{m}^{-3}$
. The suprathermal expressions take the following form (Solodov & Betti Reference Solodov and Betti2008):
 $$\begin{eqnarray}\left.\begin{array}{@{}c@{}}\ln \unicode[STIX]{x1D6EC}^{\text{ee}}=\ln \unicode[STIX]{x1D6EC}_{\text{c}}+\ln \sqrt{\unicode[STIX]{x1D6FE}-1},\\ \ln \unicode[STIX]{x1D6EC}^{\text{ei}}=\ln \unicode[STIX]{x1D6EC}_{\text{c}}+\ln (\sqrt{2}p),\end{array}\right\}\end{eqnarray}$$
where we introduced a Coulomb logarithm evaluated at relativistic electron energies:
 $$\begin{eqnarray}\ln \unicode[STIX]{x1D6EC}_{\text{c}}=\ln \unicode[STIX]{x1D6EC}_{0}+\frac{1}{2}\ln \frac{m_{\text{e}}c^{2}}{T}\approx 14.6+0.5\ln (T_{\text{eV}}/n_{\text{e}20}).\end{eqnarray}$$
Note that the temperature dependence of
 $\ln \unicode[STIX]{x1D6EC}_{\text{c}}$
is reduced compared to
 $\ln \unicode[STIX]{x1D6EC}_{0}$
, since it describes collisions between thermal particles and relativistic electrons as opposed to collisions among thermal electrons. Although the energy dependence of the Coulomb logarithm can be neglected in many scenarios, it can be significant for relativistic electrons at post-disruption temperatures. In such cases, the thermal Coulomb logarithm is often of the order of
 $\ln \unicode[STIX]{x1D6EC}_{0}\approx 10$
while
 $(1/2)\ln (m_{\text{e}}c^{2}/T)\approx 5$
at
 $T=10~\text{eV}$
. It is then appropriate to use
 $\ln \unicode[STIX]{x1D6EC}_{\text{c}}$
in the relativistic collision time:
 $\unicode[STIX]{x1D70F}_{c}=(4\unicode[STIX]{x03C0}n_{\text{e}}cr_{0}^{2}\ln \unicode[STIX]{x1D6EC}_{\text{c}})^{-1}$
, where
 $r_{0}$
is the classical electron radius.
An accurate treatment of the Coulomb logarithm that can be used in the collision operator however requires a formula that is valid from thermal to relativistic energies. We therefore match the thermal Coulomb logarithm (2.7) with the suprathermal Coulomb logarithms (2.8) according to
 $$\begin{eqnarray}\left.\begin{array}{@{}c@{}}\displaystyle \ln \unicode[STIX]{x1D6EC}^{\text{ee}}=\ln \unicode[STIX]{x1D6EC}_{0}+\frac{1}{k}\ln \{1+[2(\unicode[STIX]{x1D6FE}-1)/p_{T\text{e}}^{2}]^{k/2}\},\\ \displaystyle \ln \unicode[STIX]{x1D6EC}^{\text{ei}}=\ln \unicode[STIX]{x1D6EC}_{0}+\frac{1}{k}\ln [1+(2p/p_{T\text{e}})^{k}],\end{array}\right\}\end{eqnarray}$$
where
 $p_{T\text{e}}=\sqrt{2T/(m_{\text{e}}c^{2})}$
is the thermal momentum, and the parameter
 $k=5$
is chosen to give a smooth transition between
 $\ln \unicode[STIX]{x1D6EC}_{0}$
and
 $\ln \unicode[STIX]{x1D6EC}^{\text{ee}(\text{ei})}$
. The precise value of
 $k$
does not significantly impact the resulting runaway dynamics, but a differentiable function facilitates implementation in numerical kinetic solvers.
2.3 Elastic electron–ion collisions
In this section, we follow the recipe of Rosenbluth, MacDonald & Judd (Reference Rosenbluth, MacDonald and Judd1957) and Akama (Reference Akama1970) to derive a generalized collision operator that takes partial screening into account by including a more general differential cross-section in (2.1). We model elastic electron–ion collisions quantum mechanically in the Born approximation. With the ions as infinitely heavy stationary target particles initially at rest, the differential scattering cross-section takes the following form (Mott et al. Reference Mott and Massey1965):
 $$\begin{eqnarray}\frac{\text{d}\unicode[STIX]{x1D70E}_{\text{e}j}}{\text{d}\unicode[STIX]{x1D6FA}}=\frac{r_{0}^{2}}{4p^{4}}\left(\frac{\cos ^{2}(\unicode[STIX]{x1D703}/2)p^{2}+1}{\sin ^{4}(\unicode[STIX]{x1D703}/2)}\right)|Z_{j}-F_{j}(q)|^{2},\end{eqnarray}$$
where the form factor for ion species
 $j$
is defined as
 $$\begin{eqnarray}F_{j}(\boldsymbol{q})=\int \unicode[STIX]{x1D70C}_{\text{e},j}(r)\text{e}^{-\text{i}\boldsymbol{q}\boldsymbol{\cdot }\boldsymbol{r}/a_{0}}\,\text{d}\boldsymbol{r}.\end{eqnarray}$$
Here,
 $\boldsymbol{q}=2\boldsymbol{p}\sin (\unicode[STIX]{x1D703}/2)/\unicode[STIX]{x1D6FC}$
, and
 $a_{0}=\hbar /(m_{\text{e}}c\unicode[STIX]{x1D6FC})$
is the Bohr radius. The high- and low-energy behaviour of the form factor represent the limits of complete and no screening: at low
 $q$
, the exponential approaches unity and thus the form factor is to lowest order given by the number of bound electrons
 $N_{\text{e},j}$
, whereas at high
 $q$
the fast oscillations in the exponential instead cause the form factor to vanish. Consequently, the factor
 $|Z_{j}-F_{j}|^{2}$
varies between the net charge number squared
 $Z_{0j}^{2}$
and the atomic number squared
 $Z_{j}^{2}$
of ion species
 $j$
. The ratio between these limits is typically of order
 $10^{2}$
for weakly ionized high-
 $Z$
impurities, which motivates an accurate description of the effect of partial screening in the intermediate region.
We define a local centre of mass frame
 $\{\boldsymbol{e}_{L}^{i}\}$
with
 $p_{L}^{0}$
time-like,
 $e_{L}^{1}=\boldsymbol{p}/p$
parallel to the initial momentum, while
 $e_{L}^{2}$
and
 $e_{L}^{3}$
are orthogonal to
 $e_{L}^{1}$
. The momentum transfers can then be written in terms of the deflection angle
 $\unicode[STIX]{x1D703}$
as follows:
 $$\begin{eqnarray}\left.\begin{array}{@{}c@{}}\unicode[STIX]{x0394}p_{L}^{0}=0,\\ \unicode[STIX]{x0394}p_{L}^{1}=p(\cos \unicode[STIX]{x1D703}-1),\\ \unicode[STIX]{x0394}p_{L}^{2}=p\sin \unicode[STIX]{x1D703}\cos \unicode[STIX]{x1D719},\\ \unicode[STIX]{x0394}p_{L}^{3}=p\sin \unicode[STIX]{x1D703}\sin \unicode[STIX]{x1D719}.\end{array}\right\}\end{eqnarray}$$
Inserting the cross-section in (2.11) and
 $\unicode[STIX]{x0394}p^{k}$
from (2.13) into the moments in (2.2)–(2.3), we evaluate the integral over the azimuthal angle
 $\unicode[STIX]{x1D719}$
. There are three non-vanishing moments:
 $\int _{0}^{2\unicode[STIX]{x03C0}}\,\text{d}\unicode[STIX]{x1D719}=2\unicode[STIX]{x03C0}$
and
 $\int _{0}^{2\unicode[STIX]{x03C0}}\text{sin}^{2}\unicode[STIX]{x1D719}\,\text{d}\unicode[STIX]{x1D719}=\int _{0}^{2\unicode[STIX]{x03C0}}\text{cos}^{2}\unicode[STIX]{x1D719}\,\text{d}\unicode[STIX]{x1D719}=\unicode[STIX]{x03C0}$
, respectively corresponding to
 $\langle \unicode[STIX]{x0394}p_{L}^{1}\rangle$
,
 $\langle \unicode[STIX]{x0394}p_{L}^{1}\unicode[STIX]{x0394}p_{L}^{1}\rangle$
and
 $\langle \unicode[STIX]{x0394}p_{L}^{2}\unicode[STIX]{x0394}p_{L}^{2}\rangle =\langle \unicode[STIX]{x0394}p_{L}^{3}\unicode[STIX]{x0394}p_{L}^{3}\rangle$
. With species
 $a$
denoting electrons and the target particles
 $b$
denoting stationary ions of species
 $j$
, so that
 $f_{j}(\boldsymbol{p})=n_{j}\unicode[STIX]{x1D6FF}(\boldsymbol{p})$
, the moments are given by
 $$\begin{eqnarray}\left.\begin{array}{@{}c@{}}\displaystyle \langle \unicode[STIX]{x0394}p_{L}^{1}\rangle _{\text{e}j}=-4\unicode[STIX]{x03C0}n_{j}pv\int _{1/\unicode[STIX]{x1D6EC}}^{1}4\frac{\text{d}\unicode[STIX]{x1D70E}_{\text{e}j}}{\text{d}\unicode[STIX]{x1D6FA}}x^{3}\,\text{d}x,\\ \displaystyle \langle \unicode[STIX]{x0394}p_{L}^{1}\unicode[STIX]{x0394}p_{L}^{1}\rangle _{\text{e}j}=8\unicode[STIX]{x03C0}n_{j}p^{2}v\int _{1/\unicode[STIX]{x1D6EC}}^{1}4\frac{\text{d}\unicode[STIX]{x1D70E}_{\text{e}j}}{\text{d}\unicode[STIX]{x1D6FA}}x^{5}\,\text{d}x,\\ \displaystyle \langle \unicode[STIX]{x0394}p_{L}^{2}\unicode[STIX]{x0394}p_{L}^{2}\rangle _{\text{e}j}=4\unicode[STIX]{x03C0}n_{j}p^{2}v\int _{1/\unicode[STIX]{x1D6EC}}^{1}4\frac{\text{d}\unicode[STIX]{x1D70E}_{\text{e}j}}{\text{d}\unicode[STIX]{x1D6FA}}x^{3}(1-x^{2})\,\text{d}x=\langle \unicode[STIX]{x0394}p_{L}^{3}\unicode[STIX]{x0394}p_{L}^{3}\rangle ,\end{array}\right\}\end{eqnarray}$$
where
 $x=\sin (\unicode[STIX]{x1D703}/2)$
. Inserting the differential cross-section from (2.11) yields
 $$\begin{eqnarray}\left.\begin{array}{@{}c@{}}\displaystyle \langle \unicode[STIX]{x0394}p_{L}^{1}\rangle _{\text{e}j}=-4n_{j}\unicode[STIX]{x03C0}r_{0}^{2}\frac{v}{p^{3}}\int _{1/\unicode[STIX]{x1D6EC}}^{1}\frac{1}{x}[(1-x^{2})p^{2}+1]|Z_{j}-F_{j}(q)|^{2}\,\text{d}x,\\ \displaystyle \langle \unicode[STIX]{x0394}p_{L}^{1}\unicode[STIX]{x0394}p_{L}^{1}\rangle _{\text{e}j}=8n_{j}\unicode[STIX]{x03C0}r_{0}^{2}\frac{v}{p^{2}}\int _{1/\unicode[STIX]{x1D6EC}}^{1}x[(1-x^{2})p^{2}+1]|Z_{j}-F_{j}(q)|^{2}\,\text{d}x,\\ \displaystyle \langle \unicode[STIX]{x0394}p_{L}^{2}\unicode[STIX]{x0394}p_{L}^{2}\rangle _{\text{e}j}=4n_{j}\unicode[STIX]{x03C0}r_{0}^{2}\frac{v}{p^{2}}\int _{1/\unicode[STIX]{x1D6EC}}^{1}\frac{1-x^{2}}{x}[(1-x^{2})p^{2}+1]|Z_{j}-F_{j}(q)|^{2}\,\text{d}x=\langle \unicode[STIX]{x0394}p_{L}^{3}\unicode[STIX]{x0394}p_{L}^{3}\rangle .\end{array}\right\}\end{eqnarray}$$
Unlike the non-relativistic case, the relativistic Fokker–Planck operator does not capture the correct interspecies energy transfer of the corresponding Boltzmann operator. In the case considered here, of collisions with stationary heavy targets, an unphysical non-zero energy transfer occurs. This can be avoided by expanding the integrands of (2.15) to leading order in the scattering-angle parameter
 $x$
, but at the same time allowing the momentum transfer
 $q=2px/\unicode[STIX]{x1D6FC}$
to be non-negligible as it contains the large factor
 $p/\unicode[STIX]{x1D6FC}$
. The resulting form of the operator is validated against the Boltzmann operator in § 4: it is shown that with this choice the loss rates of parallel momentum of the Fokker–Planck and Boltzmann operators are equal at non-relativistic energies, and differ by a term of order
 $1/\ln \unicode[STIX]{x1D6EC}$
in the ultra-relativistic limit.
For the moments, we thus obtain
 $$\begin{eqnarray}\left.\begin{array}{@{}c@{}}\displaystyle \langle \unicode[STIX]{x0394}p_{L}^{1}\rangle _{\text{e}j}=-4\unicode[STIX]{x03C0}n_{j}cr_{0}^{2}\frac{\unicode[STIX]{x1D6FE}}{p^{2}}[Z_{0}^{2}\ln \unicode[STIX]{x1D6EC}^{\text{ei}}+g_{j}(p)],\\ \langle \unicode[STIX]{x0394}p_{L}^{1}\unicode[STIX]{x0394}p_{L}^{1}\rangle _{\text{e}j}=0,\\ \displaystyle \langle \unicode[STIX]{x0394}p_{L}^{2}\unicode[STIX]{x0394}p_{L}^{2}\rangle _{\text{e}j}=4\unicode[STIX]{x03C0}n_{j}cr_{0}^{2}\frac{\unicode[STIX]{x1D6FE}}{p}[Z_{0}^{2}\ln \unicode[STIX]{x1D6EC}^{\text{ei}}+g_{j}(p)],\end{array}\right\}\end{eqnarray}$$
where
 $$\begin{eqnarray}g_{j}(p)\equiv \int _{1/\unicode[STIX]{x1D6EC}}^{1}\frac{1}{x}[|Z_{j}-F_{j}(q)|^{2}-Z_{0,j}^{2}]\,\text{d}x.\end{eqnarray}$$
To obtain an explicit form of the collision operator in spherical coordinates
 $\{p,\unicode[STIX]{x1D703},\unicode[STIX]{x1D719}\}$
, where
 $\boldsymbol{p}=(p,0,0)$
, we transform the expressions in (2.16) into an arbitrary coordinate system
 $\{\boldsymbol{e}^{\unicode[STIX]{x1D707}}\}$
and then evaluate the collision operator using covariant notation. For details of this calculation, we refer the reader to appendix A. The collision operator then becomes
 $$\begin{eqnarray}C^{\text{e}j}=\frac{1}{p^{2}\sin \unicode[STIX]{x1D703}}\unicode[STIX]{x2202}_{\unicode[STIX]{x1D707}}(p^{2}\sin \unicode[STIX]{x1D703}V^{\unicode[STIX]{x1D707}}),\end{eqnarray}$$
where
 $$\begin{eqnarray}V^{\unicode[STIX]{x1D707}}=\left(\begin{array}{@{}c@{}}\displaystyle -\left[\langle \unicode[STIX]{x0394}p_{L}^{1}\rangle _{\text{e}j}+\frac{1}{p}\langle \unicode[STIX]{x0394}p_{L}^{2}\unicode[STIX]{x0394}p_{L}^{2}\rangle _{\text{e}j}\right]f_{\text{e}}\\ (2p^{2})^{-1}\langle \unicode[STIX]{x0394}p_{L}^{2}\unicode[STIX]{x0394}p_{L}^{2}\rangle _{\text{e}j}\unicode[STIX]{x2202}_{\unicode[STIX]{x1D703}}f_{\text{e}}\\ (2p^{2}\sin ^{2}\unicode[STIX]{x1D703})^{-1}\langle \unicode[STIX]{x0394}p_{L}^{2}\unicode[STIX]{x0394}p_{L}^{2}\rangle _{\text{e}j}\unicode[STIX]{x2202}_{\unicode[STIX]{x1D719}}f_{\text{e}}\end{array}\right)^{\unicode[STIX]{x1D707}}.\end{eqnarray}$$
From the first component of (2.19), it is clear that the contributions to the energy loss vanish identically only if higher-order terms in the Fokker–Planck operator are neglected so that
 $\langle \unicode[STIX]{x0394}p_{L}^{1}\rangle _{\text{e}j}=-p^{-1}\langle \unicode[STIX]{x0394}p_{L}^{2}\unicode[STIX]{x0394}p_{L}^{2}\rangle _{\text{e}j}$
. Finally, evaluating (2.18) for an axisymmetric plasma yields, after summation over ion species
 $j$
, the electron–ion collision operator
 $$\begin{eqnarray}\displaystyle C^{\text{ei}} & = & \displaystyle \mathop{\sum }_{j}\frac{1}{p^{2}}\langle \unicode[STIX]{x0394}p_{L}^{2}\unicode[STIX]{x0394}p_{L}^{2}\rangle _{\text{e}j}\frac{1}{2}\frac{\unicode[STIX]{x2202}}{\unicode[STIX]{x2202}\unicode[STIX]{x1D709}}(1-\unicode[STIX]{x1D709}^{2})\frac{\unicode[STIX]{x2202}}{\unicode[STIX]{x2202}\unicode[STIX]{x1D709}}f_{\text{e}}\end{eqnarray}$$
 $$\begin{eqnarray}\displaystyle & = & \displaystyle \mathop{\sum }_{j}4\unicode[STIX]{x03C0}n_{j}cr_{0}^{2}\frac{\unicode[STIX]{x1D6FE}}{p^{3}}[Z_{0}^{2}\ln \unicode[STIX]{x1D6EC}^{\text{ei}}+g_{j}(p)]{\mathcal{L}}\{f_{\text{e}}\},\end{eqnarray}$$
and we can identify the deflection frequency
 $$\begin{eqnarray}\unicode[STIX]{x1D708}_{\text{D}}^{\text{ei}}=4\unicode[STIX]{x03C0}cr_{0}^{2}\frac{\unicode[STIX]{x1D6FE}}{p^{3}}\Bigl(n_{\text{e}}Z_{\text{eff}}\ln \unicode[STIX]{x1D6EC}^{\text{ei}}+\mathop{\sum }_{j}n_{j}g_{j}(p)\Bigr),\end{eqnarray}$$
where the first term is the completely screened collision frequency with the effective charge defined as
 $Z_{\text{eff}}=\sum _{j}n_{j}Z_{0,j}^{2}/n_{\text{e}}$
. Note that the properties of the form factor ensure that the completely screened limit is reached if either
 $p\rightarrow 0$
, or if the ion is fully ionized so that
 $Z=Z_{0}$
.
What remains is to find the screening function
 $g_{j}(p)$
for all ion species
 $j$
. This requires the electronic charge distribution of the ion, which we determine from density functional theory (DFT), using the programs exciting (Gulans et al.
Reference Gulans, Kontur, Meisenbichler, Nabok, Pavone, Rigamonti, Sagmeister, Werner and Draxl2014) and gaussian (Frisch et al.
Reference Frisch, Trucks, Schlegel, Scuseria, Robb, Cheeseman, Scalmani, Barone, Petersson and Nakatsuji2016). The gaussian calculations were performed using the hybrid-exchange correlation functional PBE0 (Adamo & Barone Reference Adamo and Barone1999), a Douglas–Kroll–Hess second-order scalar relativistic Hamiltonian (Douglas & Kroll Reference Douglas and Kroll1974; Hess Reference Hess1986; Barysz & Sadlej Reference Barysz and Sadlej2001), and the atomic natural orbital-relativistic correlation consistent basis set, ANO-RCC (Widmark, Malmqvist & Roos Reference Widmark, Malmqvist and Roos1990; Roos et al.
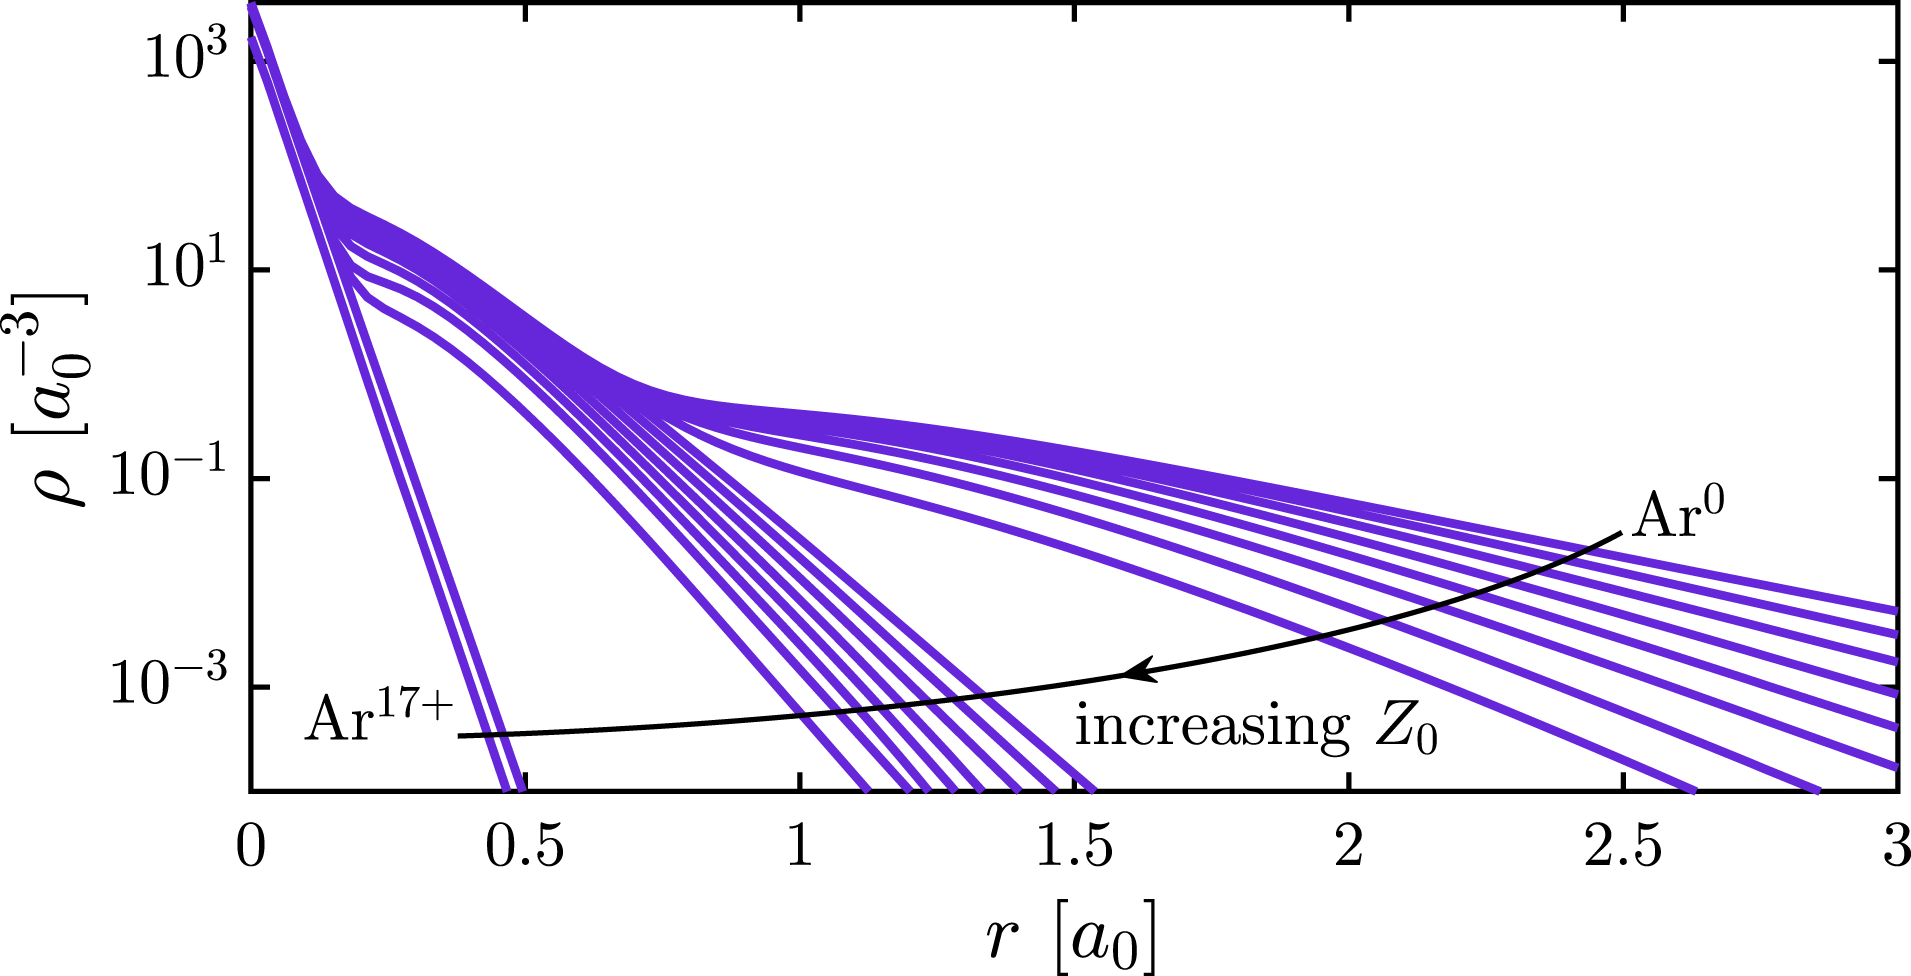
Reference Roos, Lindh, Malmqvist, Veryazov and Widmark2004, Reference Roos, Lindh, Malmqvist, Veryazov and Widmark2005). As an example, figure 1 shows the density of bound electrons as a function of radius for all argon ionization states. Note that the density decay can be approximately parametrized with piecewise exponentials having different slopes for each of the atomic shells.
Number density of bound electrons averaged over solid angle as a function of radius for all ionization states of argon. The length scale is given in units of the Bohr radius
 $a_{0}$
.

When calculating the form factor, the electronic density was first spherically averaged, in which case the form factor in (2.12) simplifies to
 $$\begin{eqnarray}F_{j}(q)=4\unicode[STIX]{x03C0}\int _{0}^{\infty }\unicode[STIX]{x1D70C}_{\text{e},j}(r)\frac{ra_{0}}{q}\sin (qr/a_{0})\,\text{d}r,\end{eqnarray}$$
where again
 $q=2px/\unicode[STIX]{x1D6FC}$
and the total number of bound electrons is given by
 $N_{\text{e}}=4\unicode[STIX]{x03C0}\int r^{2}\unicode[STIX]{x1D70C}_{\text{e},j}(r)\,\text{d}r$
.
Numerically, we find that the form factor is well described by a generalized version of the form factor obtained from the Thomas–Fermi model by Kirillov et al. (Reference Kirillov, Trubnikov and Trushin1975):
 $$\begin{eqnarray}F_{j,{\rm \small{tf}}\text{-}{\rm \small{dft}}}(q)=\frac{N_{\text{e},j}}{1+(qa_{j})^{3/2}}.\end{eqnarray}$$
Note that we can extend the lower integration limit to zero in the definition of
 $g_{j}(p)$
(2.17) since the integrand is finite as
 $p\rightarrow 0$
(the logarithmically diverging terms cancel as shown in appendix B). In the form factor in (2.23), this extension of the integral amounts to neglecting terms of order
 $\unicode[STIX]{x1D6EC}^{-3/2}\ll 1$
and
 $(p\bar{a}_{j}/\unicode[STIX]{x1D6EC})^{3/2}\ll 1$
which describe the transition from partial screening to no screening. However, since
 $\unicode[STIX]{x1D6EC}^{\text{ei}}=\exp (\ln \unicode[STIX]{x1D6EC}^{\text{ei}})\propto p$
at high energies from (2.8), we obtain
 $(p\bar{a}_{j}/\unicode[STIX]{x1D6EC})^{3/2}\sim 137/\unicode[STIX]{x1D6EC}_{\text{c}}$
; therefore, this approximation is always valid and the no-screening limit will never be reached. Equation (2.24) then gives
 $$\begin{eqnarray}g_{j}(p)=\frac{2}{3}(Z_{j}^{2}-Z_{0,j}^{2})\ln [(p\bar{a}_{j})^{3/2}+1]-\frac{2}{3}\frac{N_{\text{e},j}^{2}(p\bar{a}_{j})^{3/2}}{(p\bar{a}_{j})^{3/2}+1}.\end{eqnarray}$$
This model, which we denote the Thomas–Fermi–DFT (TF-DFT) model, includes one free parameter: the effective ion length scale
 $a_{j}$
in units of the Bohr radius
 $a_{0}$
, with
 $\bar{a}_{j}=2a_{j}/\unicode[STIX]{x1D6FC}$
. This parameter is determined from the density of bound electrons obtained from the DFT calculations.
The general properties of the screening function
 $g_{j}(p)$
allow us to determine
 $a_{j}$
so that the deflection frequency exactly matches the high-energy asymptote of the DFT results. As shown in appendix B,
 $g_{j}(p)$
always takes the form
 $$\begin{eqnarray}g_{j}(p)=(Z_{j}^{2}-Z_{0,j}^{2})\ln (2p/\unicode[STIX]{x1D6FC})+C,\quad 2p/\unicode[STIX]{x1D6FC}\gg 1,\end{eqnarray}$$
where only the constant
 $C$
depends on the specific ionic distribution. Since the additive constant can be absorbed into the effective length scale, the high-energy behaviour of the screening function is reduced to a one-parameter problem. This indicates that (2.25) should be well suited as an analytic model of the screening problem, if it approximates the transition from the low-momentum behaviour to the high-momentum behaviour. Accordingly, we determine
 $a_{j}$
for an arbitrary charge distribution
 $\unicode[STIX]{x1D70C}_{\text{e},j}(r)$
by matching the
 $g_{j}(p)$
in (2.26) to the general high-energy asymptote of
 $g_{j}(p)$
,
 $$\begin{eqnarray}g_{j}(p)\sim (Z_{j}^{2}-Z_{0,j}^{2})\ln (p\bar{a}_{j})-{\textstyle \frac{2}{3}}N_{\text{e},j}^{2},\quad p\bar{a}_{j}\gg 1.\end{eqnarray}$$
The resulting closed form of the effective length scale
 $\bar{a}_{j}$
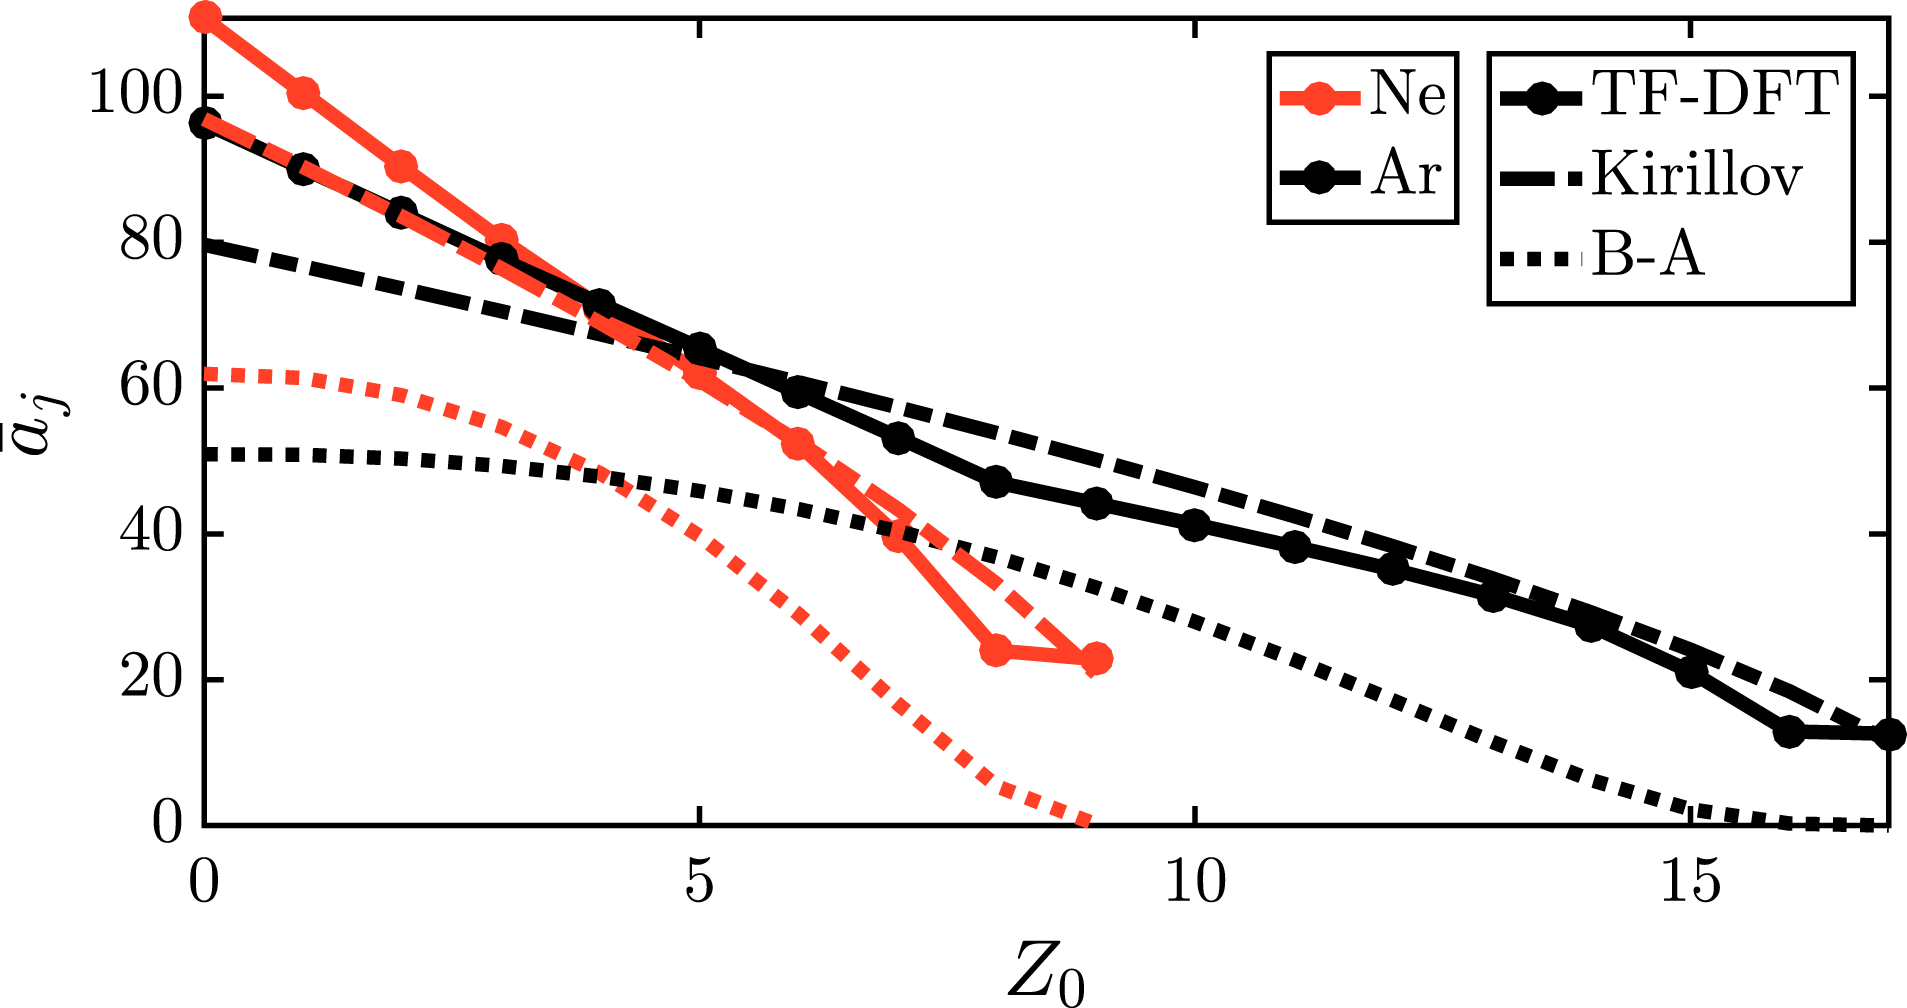
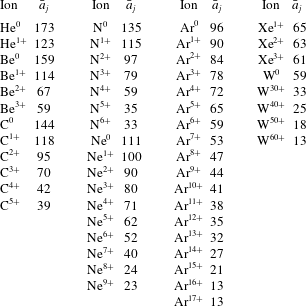
is given in (B 11) in appendix B, and tabulated for many of the fusion-relevant ion species in table 1. The constants for argon and neon are illustrated in figure 2 as a function of
 $Z_{0}$
in solid line. Curiously, the shell structure observed in the charge density of figure 1 can be discerned as discontinuities in
 $\unicode[STIX]{x2202}\bar{a}_{j}/\unicode[STIX]{x2202}Z_{0,j}$
.
Length scale
 $a_{j}$
for Ne and Ar, compared to both the Thomas–Fermi model with the Kirillov solution from (2.28), and the Breizman–Aleynikov (B–A) model from (2.29). Note that by definition,
 $\bar{a}_{j}=\bar{a}_{{\rm \small{tf}}\text{-}{\rm \small{dft}}}\equiv \bar{a}_{{\rm \small{dft}}}$
.

Values of the normalized effective length scale
 $\bar{a}_{j}=2a_{j}/\unicode[STIX]{x1D6FC}$
for different ion species. These values were obtained with (B 11) using electronic charge densities from DFT calculations.

Since the obtained values are
 $\bar{a}_{j}\sim 10^{2}$
for several weakly ionized species such as neon and argon, the deflection frequency will be significantly enhanced compared to complete screening already at
 $p\sim 10^{-2}$
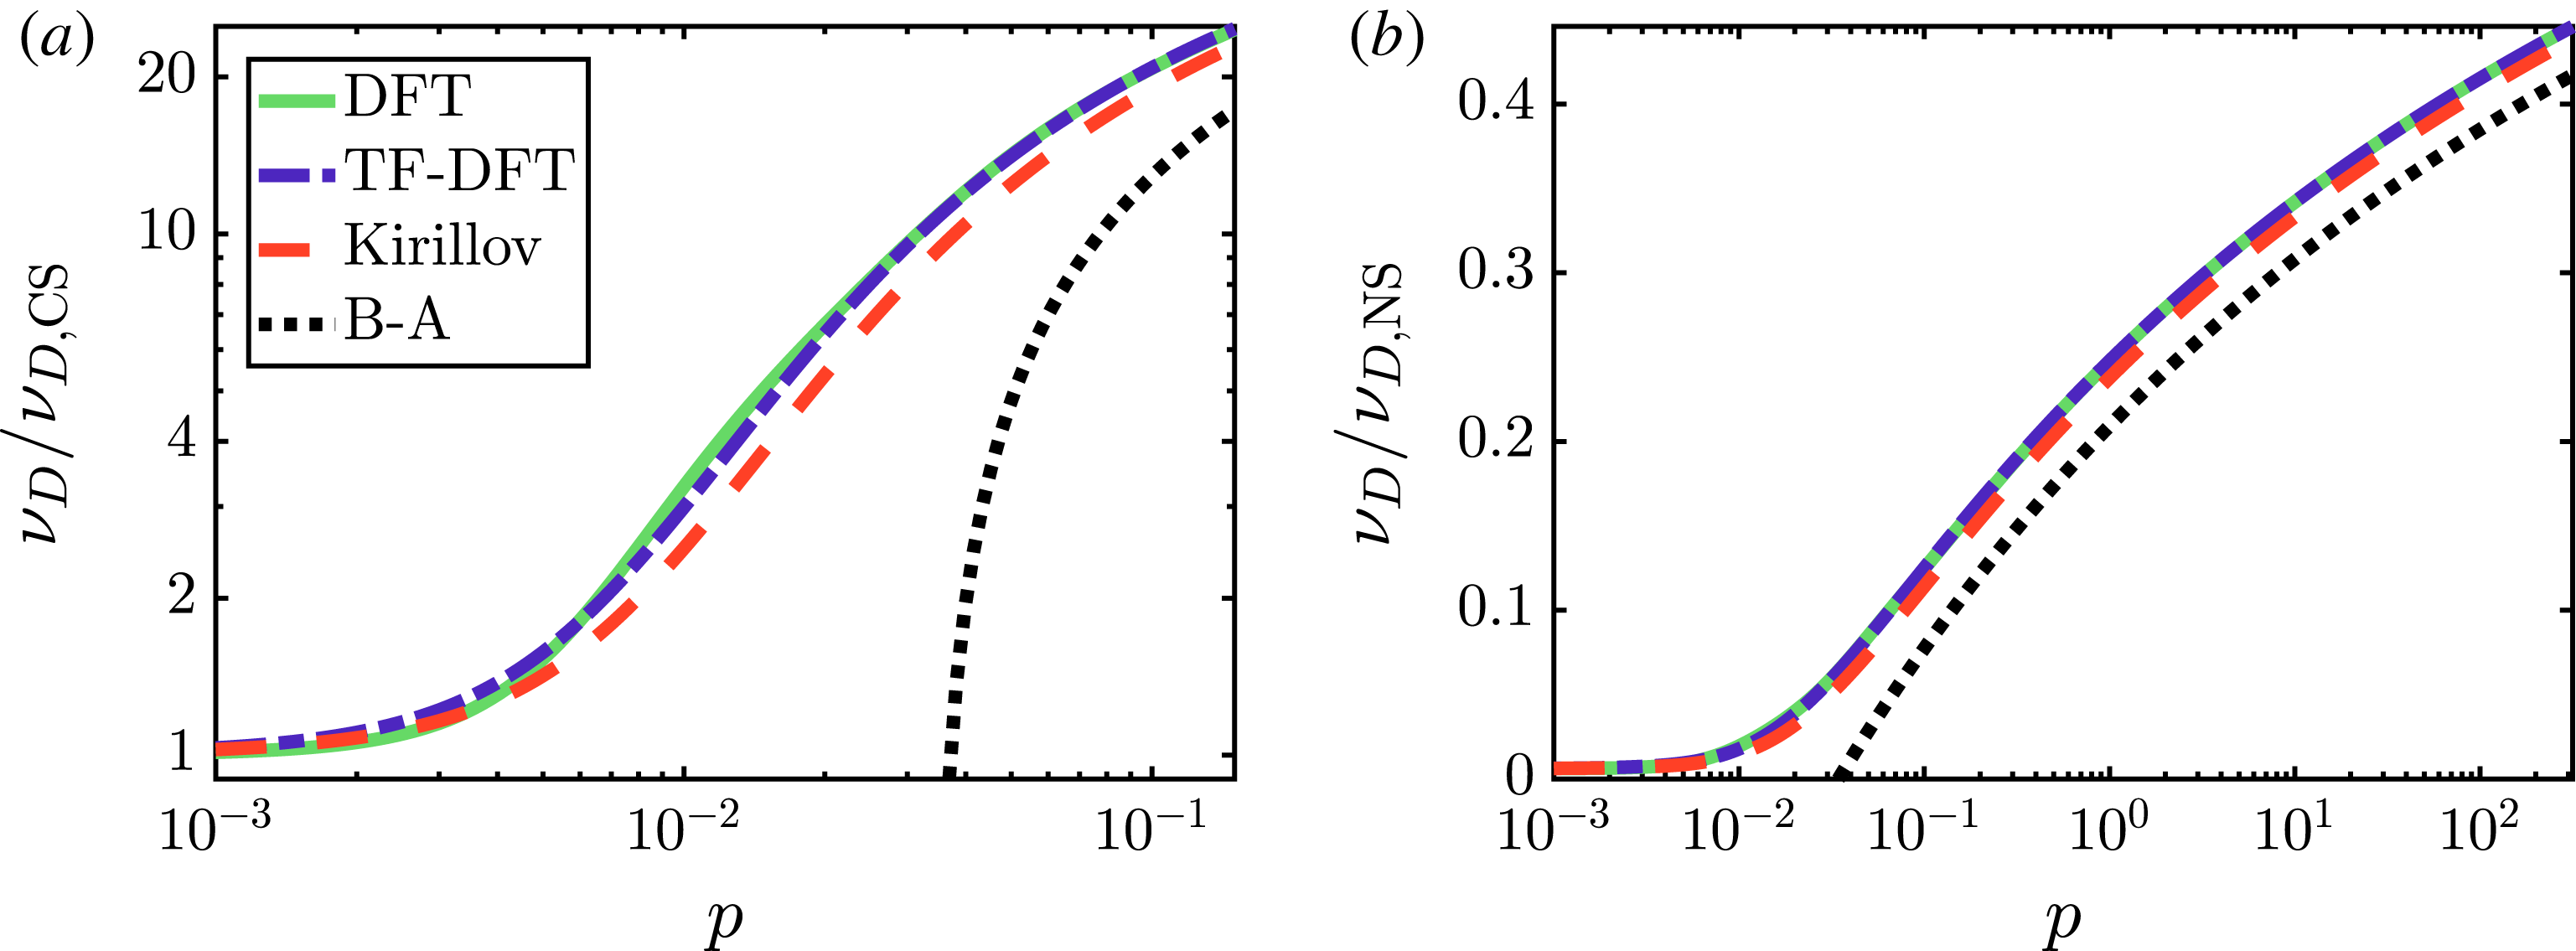
. This is confirmed in figure 3, which also shows that the most accurate model for the deflection frequency – the DFT model (solid, green line) – is well approximated by the TF-DFT model in dash-dotted blue over the entire energy interval from non-relativistic to ultra-relativistic energies.
Comparison between the DFT and TF-DFT models for the enhancement of the deflection frequency. (a) Shows the low-energy behaviour, and is normalized to the completely screened (CS), low-energy limit. (b) Shows the behaviour up to higher energies, and is normalized to the no-screening (NS) limit. The deflection frequency is significantly lower than the no-screening limit even at ultrarelativistic speeds. The figure is for
 $\text{Ar}^{1+}$
, and the Coulomb logarithm was determined by setting
 $T=10~\text{eV}$
and
 $n_{\text{e}}=10^{20}~\text{m}^{-3}$
.

The length parameter
 $\bar{a}_{j}$
is well suited to compare our result with previous work since it completely characterizes the behaviour of the deflection frequency at high energy, which is the most important region for fast-electron dynamics. A comparison at low energies, where the screening function cannot in general be described by a single parameter, should be approached with caution as the Born approximation is only valid in the regime
 $\unicode[STIX]{x1D6FD}\gtrsim Z\unicode[STIX]{x1D6FC}\Leftrightarrow p\gtrsim [(Z\unicode[STIX]{x1D6FC})^{-2}-1]^{-1/2}\sim 10^{-1}$
. The behaviour at lower momenta is approximate, and should merely be regarded as an interpolation between the low-energy limit of complete screening (which is reproduced by the TF-DFT model) and the behaviour at higher energies. Therefore, we primarily focus on the length scale
 $\bar{a}_{j}$
when comparing with previous work. For example, the result of Kirillov et al. (Reference Kirillov, Trubnikov and Trushin1975) corresponds to
 $$\begin{eqnarray}\bar{a}_{\text{Kirillov}}=\frac{2}{\unicode[STIX]{x1D6FC}}\frac{(9\unicode[STIX]{x03C0})^{1/3}}{4}\frac{N_{\text{e}}^{2/3}}{Z}\approx \frac{2}{\unicode[STIX]{x1D6FC}}\frac{3}{4}\frac{N_{\text{e}}^{2/3}}{Z}.\end{eqnarray}$$
The Kirillov model captures the approximate scaling of
 $\bar{a}_{j}$
with
 $Z$
and
 $Z_{0}$
, however it differs significantly from the DFT results at low ionization degrees (maximum relative error 20 %, obtained for
 $\text{C}^{0}$
) and for
 $N_{\text{e}}=2$
(maximum 43 %,
 $\text{Ar}^{16+}$
). As shown in figure 2, this is because the Kirillov model does not capture the shell structure of the ion, which is an inherent characteristic of the Thomas–Fermi theory employed by Kirillov et al. (Reference Kirillov, Trubnikov and Trushin1975). Although these relative errors are significant, the final error in the deflection frequency is modest at high energies, since the deflection frequency is only sensitive to
 $\ln \bar{a}_{j}$
. At
 $p=0.1$
, the relative error of
 $\bar{a}_{j}$
between the TF-DFT model and the Thomas–Fermi model is at most 14 %.
We find a significantly larger difference between our model for the deflection frequency and the model used by Breizman & Aleynikov (Reference Breizman and Aleynikov2017). In this model, which we refer to as the B–A model, the deflection frequency always increases logarithmically. The deflection frequency therefore diverges as
 $p\rightarrow 0$
and the complete-screening limit is consequently not reproduced, which is illustrated in figure 3(a). This means that the B–A model is only applicable at relativistic energies and is unable to describe phenomena involving mildly relativistic electrons, such as hot-tail, primary runaway generation and the avalanche mechanism at high electric fields. In the B–A model, the logarithmic increase of the deflection frequency corresponds to the length constant
 $$\begin{eqnarray}\bar{a}_{\text{B}{-}\text{A}}=\frac{2}{\unicode[STIX]{x1D6FC}}Z_{j}^{-1/3}\exp \left(\frac{2}{3}\frac{N_{\text{e},j}^{2}-6\ln 2(Z_{j}Z_{0,j}-Z_{j}^{2}-Z_{0,j}^{2})}{Z_{j}^{2}-Z_{0,j}^{2}}\right).\end{eqnarray}$$
As shown in figure 2,
 $\bar{a}_{\text{B}{-}\text{A}}$
differs significantly from both
 $\bar{a}_{\text{Kirillov}}$
and our more accurate DFT-based values of
 $\bar{a}_{j}$
.
We conclude that the Kirillov formula suffices for an accurate description of screening in most situations, although the constants derived from DFT have a higher level of accuracy, especially at low momenta.
2.4 Inelastic collisions with bound electrons
Unlike for elastic collisions with partially screened nuclei, there is no analytic expression for the differential cross-section for inelastic collisions between fast and bound electrons, but the energy loss is described by the Bethe stopping-power formula (Bethe Reference Bethe1930; Jackson Reference Jackson1999). Accordingly, we modify the slowing-down frequency
 $\unicode[STIX]{x1D708}_{S}^{\text{ee}}$
in (2.5), which describes collisional drag, whereas we neglect the modification of the electron–electron deflection frequency
 $\unicode[STIX]{x1D708}_{\text{D}}^{\text{ee}}$
, since it does not follow from the stopping-power calculation. The error introduced through this approximation, i.e.
 $\unicode[STIX]{x1D708}_{\text{D}}\approx \unicode[STIX]{x1D708}_{\text{D}}^{\text{ei}}+\unicode[STIX]{x1D708}_{\text{D},{\rm \small{cs}}}^{\text{ee}}$
, can be estimated by considering the limits of no screening and complete screening of
 $\unicode[STIX]{x1D708}_{\text{D}}^{\text{ee}}$
. For suprathermal electrons,
 $\unicode[STIX]{x1D708}_{\text{D},{\rm \small{cs}}}^{\text{ee}}=4\unicode[STIX]{x03C0}cr_{0}^{2}(\unicode[STIX]{x1D6FE}/p^{3})n_{\text{e}}\ln \unicode[STIX]{x1D6EC}^{\text{ee}}$
, while
 $\unicode[STIX]{x1D708}_{\text{D},{\rm \small{ns}}}^{\text{ee}}$
is enhanced by a factor of
 $n_{\text{e}}^{\text{tot}}/n_{\text{e}}=1+\sum _{j}N_{\text{e},j}n_{j}/n_{\text{e}}$
. Comparing to the electron–ion deflection frequency (2.22), we find that our approximation is valid if either
 $\sum _{j}Z_{j}^{2}n_{j}\gg \sum _{j}N_{\text{e},j}n_{j}$
, or if
 $1+Z_{\text{eff}}\gg \unicode[STIX]{x1D708}_{\text{D}}^{\text{ee}}/\unicode[STIX]{x1D708}_{\text{D},{\rm \small{cs}}}^{\text{ee}}$
due to either significant ionization levels or low electron momentum. In other words, our model is accurate both when screening effects are small and in the presence of high-
 $Z$
impurities.
The Bethe stopping-power formula modifies the slowing-down frequency
 $\unicode[STIX]{x1D708}_{S}^{\text{ee}}$
describing collisional drag according to Bethe (Reference Bethe1930) and Jackson (Reference Jackson1999)
 $$\begin{eqnarray}\unicode[STIX]{x1D708}_{S}^{\text{ee}}=4\unicode[STIX]{x03C0}cr_{0}^{2}\frac{\unicode[STIX]{x1D6FE}^{2}}{p^{3}}\left[n_{\text{e}}\ln \unicode[STIX]{x1D6EC}^{\text{ee}}+\mathop{\sum }_{j}n_{j}N_{\text{e},j}(\ln h_{j}-\unicode[STIX]{x1D6FD}^{2})\right],\end{eqnarray}$$
where
 $h_{j}=p\sqrt{\unicode[STIX]{x1D6FE}-1}(m_{\text{e}}c^{2}/I_{j})$
, and
 $I_{j}$
is the mean excitation energy of the ion. In this work, the numerical values of
 $I_{j}$
for different ion species were obtained from Sauer et al. (Reference Sauer, Oddershede and Sabin2015). In addition, several sources list the mean excitation energy for neutral atoms, for instance Berger et al. (Reference Berger, Inokuti, Anderson, Bichsel, Dennis, Powers, Seltzer and Turner1984), which is used in estar (Berger et al.
Reference Berger, Coursey, Zucker and Chang2005). Equation (2.30) is valid for
 $m_{\text{e}}c^{2}(\unicode[STIX]{x1D6FE}-1)\gg I_{j}$
, which is typically of the order of hundreds to thousands of eV. In order to find an expression that is applicable over the entire energy range from thermal to ultrarelativistic energies, we match (2.30) to the low-energy asymptote corresponding to complete screening. The resulting interpolation formula, which we refer to as the Bethe-like model, is given by
 $$\begin{eqnarray}\unicode[STIX]{x1D708}_{S}^{\text{ee}}=4\unicode[STIX]{x03C0}cr_{0}^{2}\frac{\unicode[STIX]{x1D6FE}^{2}}{p^{3}}\left\{n_{\text{e}}\ln \unicode[STIX]{x1D6EC}^{\text{ee}}+\mathop{\sum }_{j}n_{j}N_{\text{e},j}\left[\frac{1}{k}\ln (1+h_{j}^{k})-\unicode[STIX]{x1D6FD}^{2}\right]\!\right\},\end{eqnarray}$$
where we set
 $k=5$
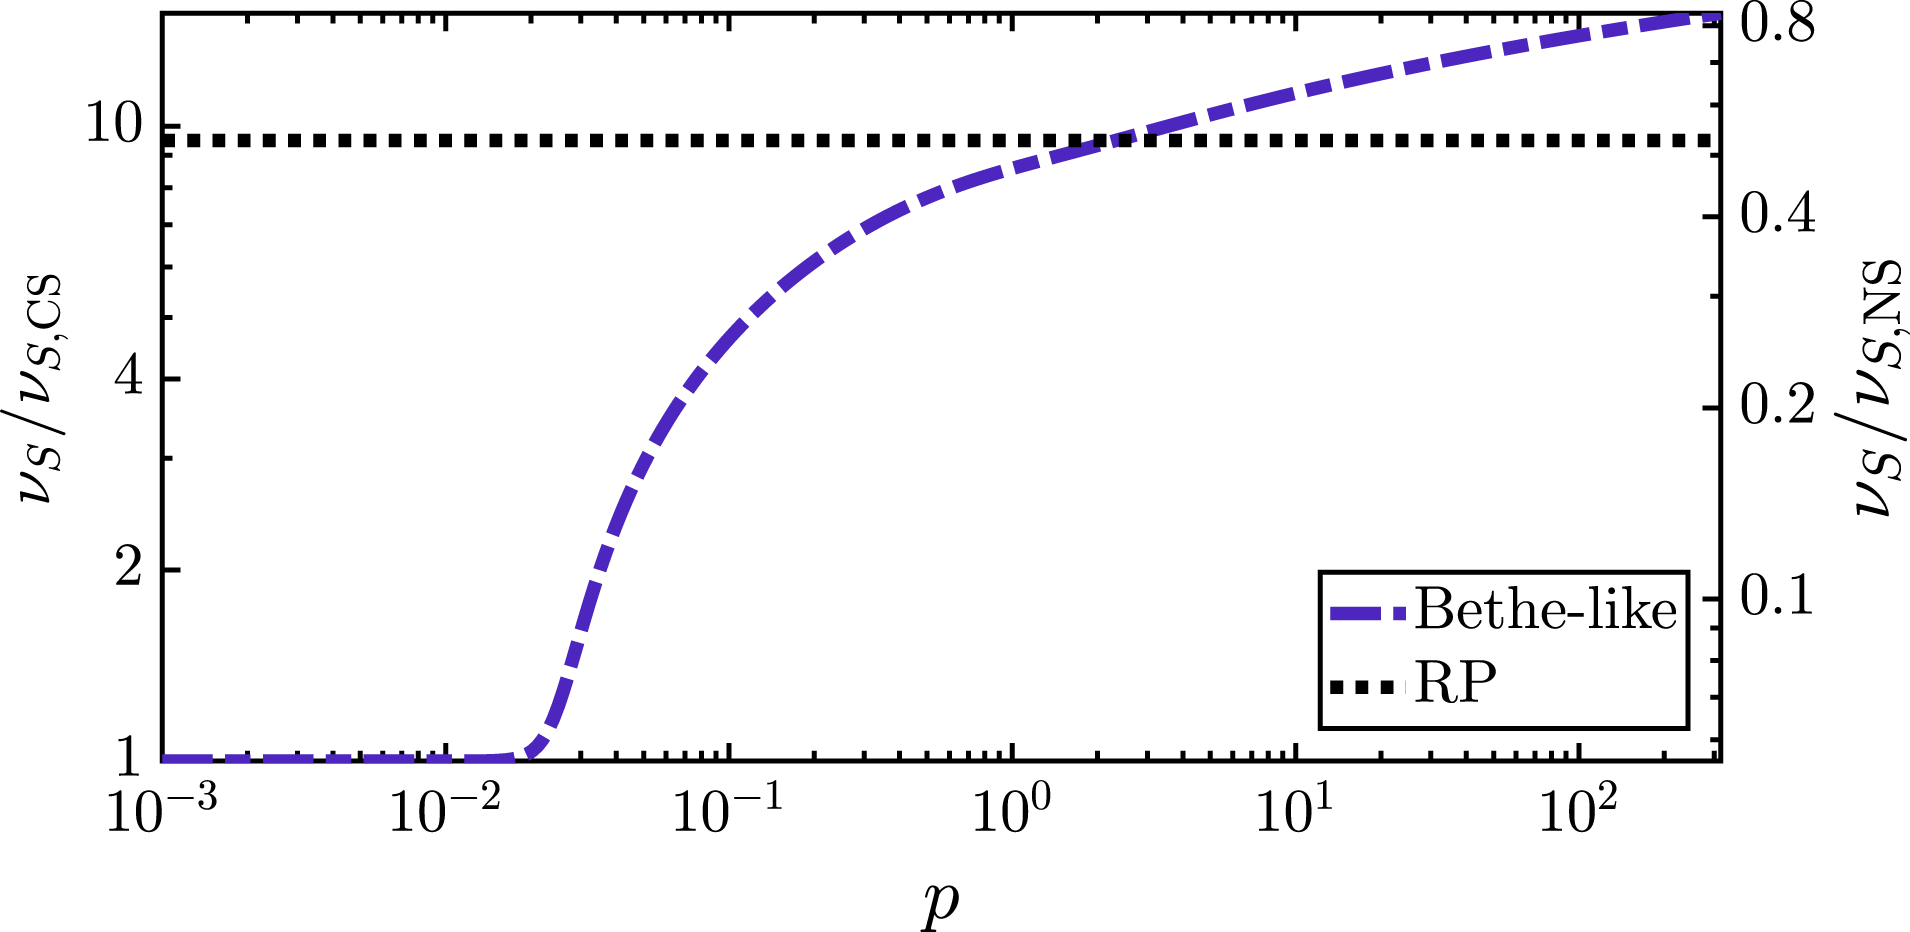
. This is plotted as a function of momentum in figure 4, and compared to the completely screened limit on the left
 $y$
-axis, and the limit of no screening on the right
 $y$
-axis. Unlike the deflection frequency, equation (2.31) will exceed the limit of no screening in the limit of infinite momentum, since it increases by a power of
 $p^{3/2}$
compared to a power of
 $p^{1/2}$
for
 $\ln \unicode[STIX]{x1D6EC}^{\text{ee}}$
in (2.8). For fusion-like densities, this will however happen around
 $p\sim 10^{4}$
(
 ${\sim}10~\text{GeV}$
), which is well above realistic runaway energies. At these ultra-large momentum scales, the so-called density effect (Jackson Reference Jackson1999; Solodov & Betti Reference Solodov and Betti2008) would ensure that the logarithmic term smoothly approaches the Coulomb logarithm.
We also compare the Bethe-like model to the Rosenbluth–Putvinski (RP) model (Rosenbluth & Putvinski Reference Rosenbluth and Putvinski1997), which includes half of the bound electron density
 $n_{\text{b}}=\sum _{j}n_{j}N_{\text{e},j}$
:
 $$\begin{eqnarray}\unicode[STIX]{x1D708}_{S}^{\text{ee}}\approx 4\unicode[STIX]{x03C0}cr_{0}^{2}\frac{\unicode[STIX]{x1D6FE}^{2}}{p^{3}}\ln \unicode[STIX]{x1D6EC}\left(n_{\text{e}}+\frac{n_{\text{b}}}{2}\right).\end{eqnarray}$$
Figure 4 shows that this estimate coincides with the Bethe-like model at
 $p\approx 1$
, but results in a notable overestimation at mildly relativistic momenta and a significant underestimation at ultra-relativistic momenta.
The partially screened slowing-down frequency for the Bethe-like model in (2.31) and the RP model from (2.32), for singly ionized argon. The collision frequency is normalized to the completely screened (CS), low-energy limit on the left
 $y$
-axis, and to the limit of no screening (NS) on the right
 $y$
-axis. The figure is for
 $\text{Ar}^{1+}$
, and the Coulomb logarithm was determined by setting
 $T=10~\text{eV}$
and
 $n_{\text{e}}=10^{20}~\text{m}^{-3}$
.

Note that (2.31) ensures that the enhancement of
 $\unicode[STIX]{x1D708}_{S}^{\text{ee}}$
does not extend into the bulk electron population, which means that the first term
 $4\unicode[STIX]{x03C0}cr_{0}^{2}(\unicode[STIX]{x1D6FE}^{2}/p^{3})n_{\text{e}}\ln \unicode[STIX]{x1D6EC}^{\text{ee}}$
can be replaced by the complete expression for
 $\unicode[STIX]{x1D708}_{S,{\rm \small{cs}}}^{\text{ee}}$
accounting for a finite bulk temperature (Braams & Karney Reference Braams and Karney1989). This is because
 $I_{j}$
is greater than the temperature
 $T$
at which a certain ion species
 $j$
would be present in equilibrium. Since the ions can always be treated as stationary (at rest), the same issue does not arise for
 $\unicode[STIX]{x1D708}_{\text{D}}^{\text{ei}}$
. This means that the generalization of the Fokker–Planck operator to a partially ionized plasma can be expressed as modifications to
 $\unicode[STIX]{x1D708}_{\text{D}}^{\text{ei}}$
and
 $\unicode[STIX]{x1D708}_{S}^{\text{ee}}$
in the collision operator (2.5), according to (2.22), with
 $g_{j}(p)$
defined in (2.25) and
 $\bar{a}_{j}$
given in table 1, as well as (2.31), with
 $I_{j}$
from Sauer et al. (Reference Sauer, Oddershede and Sabin2015).
3 Effect on avalanche growth rate and runaway distribution
The presence of partially ionized atoms has a peculiar effect on the avalanche growth rate at high electric fields: as will be shown in the present section, the partial-screening effect can increase the avalanche growth rate despite the increased collisional damping and in contrast to previous predictions (Putvinski et al. Reference Putvinski, Fujisawa, Post, Putvinskaya, Rosenbluth and Wesley1997). Moreover, the quasi-steady-state runaway distribution acquires an electric field-dependent average energy since the growth rate no longer depends linearly on the electric field.
The avalanche growth rate is defined as
 $$\begin{eqnarray}\unicode[STIX]{x1D6E4}=\frac{1}{n_{\text{RE}}}\frac{\text{d}n_{\text{RE}}}{\text{d}t}.\end{eqnarray}$$
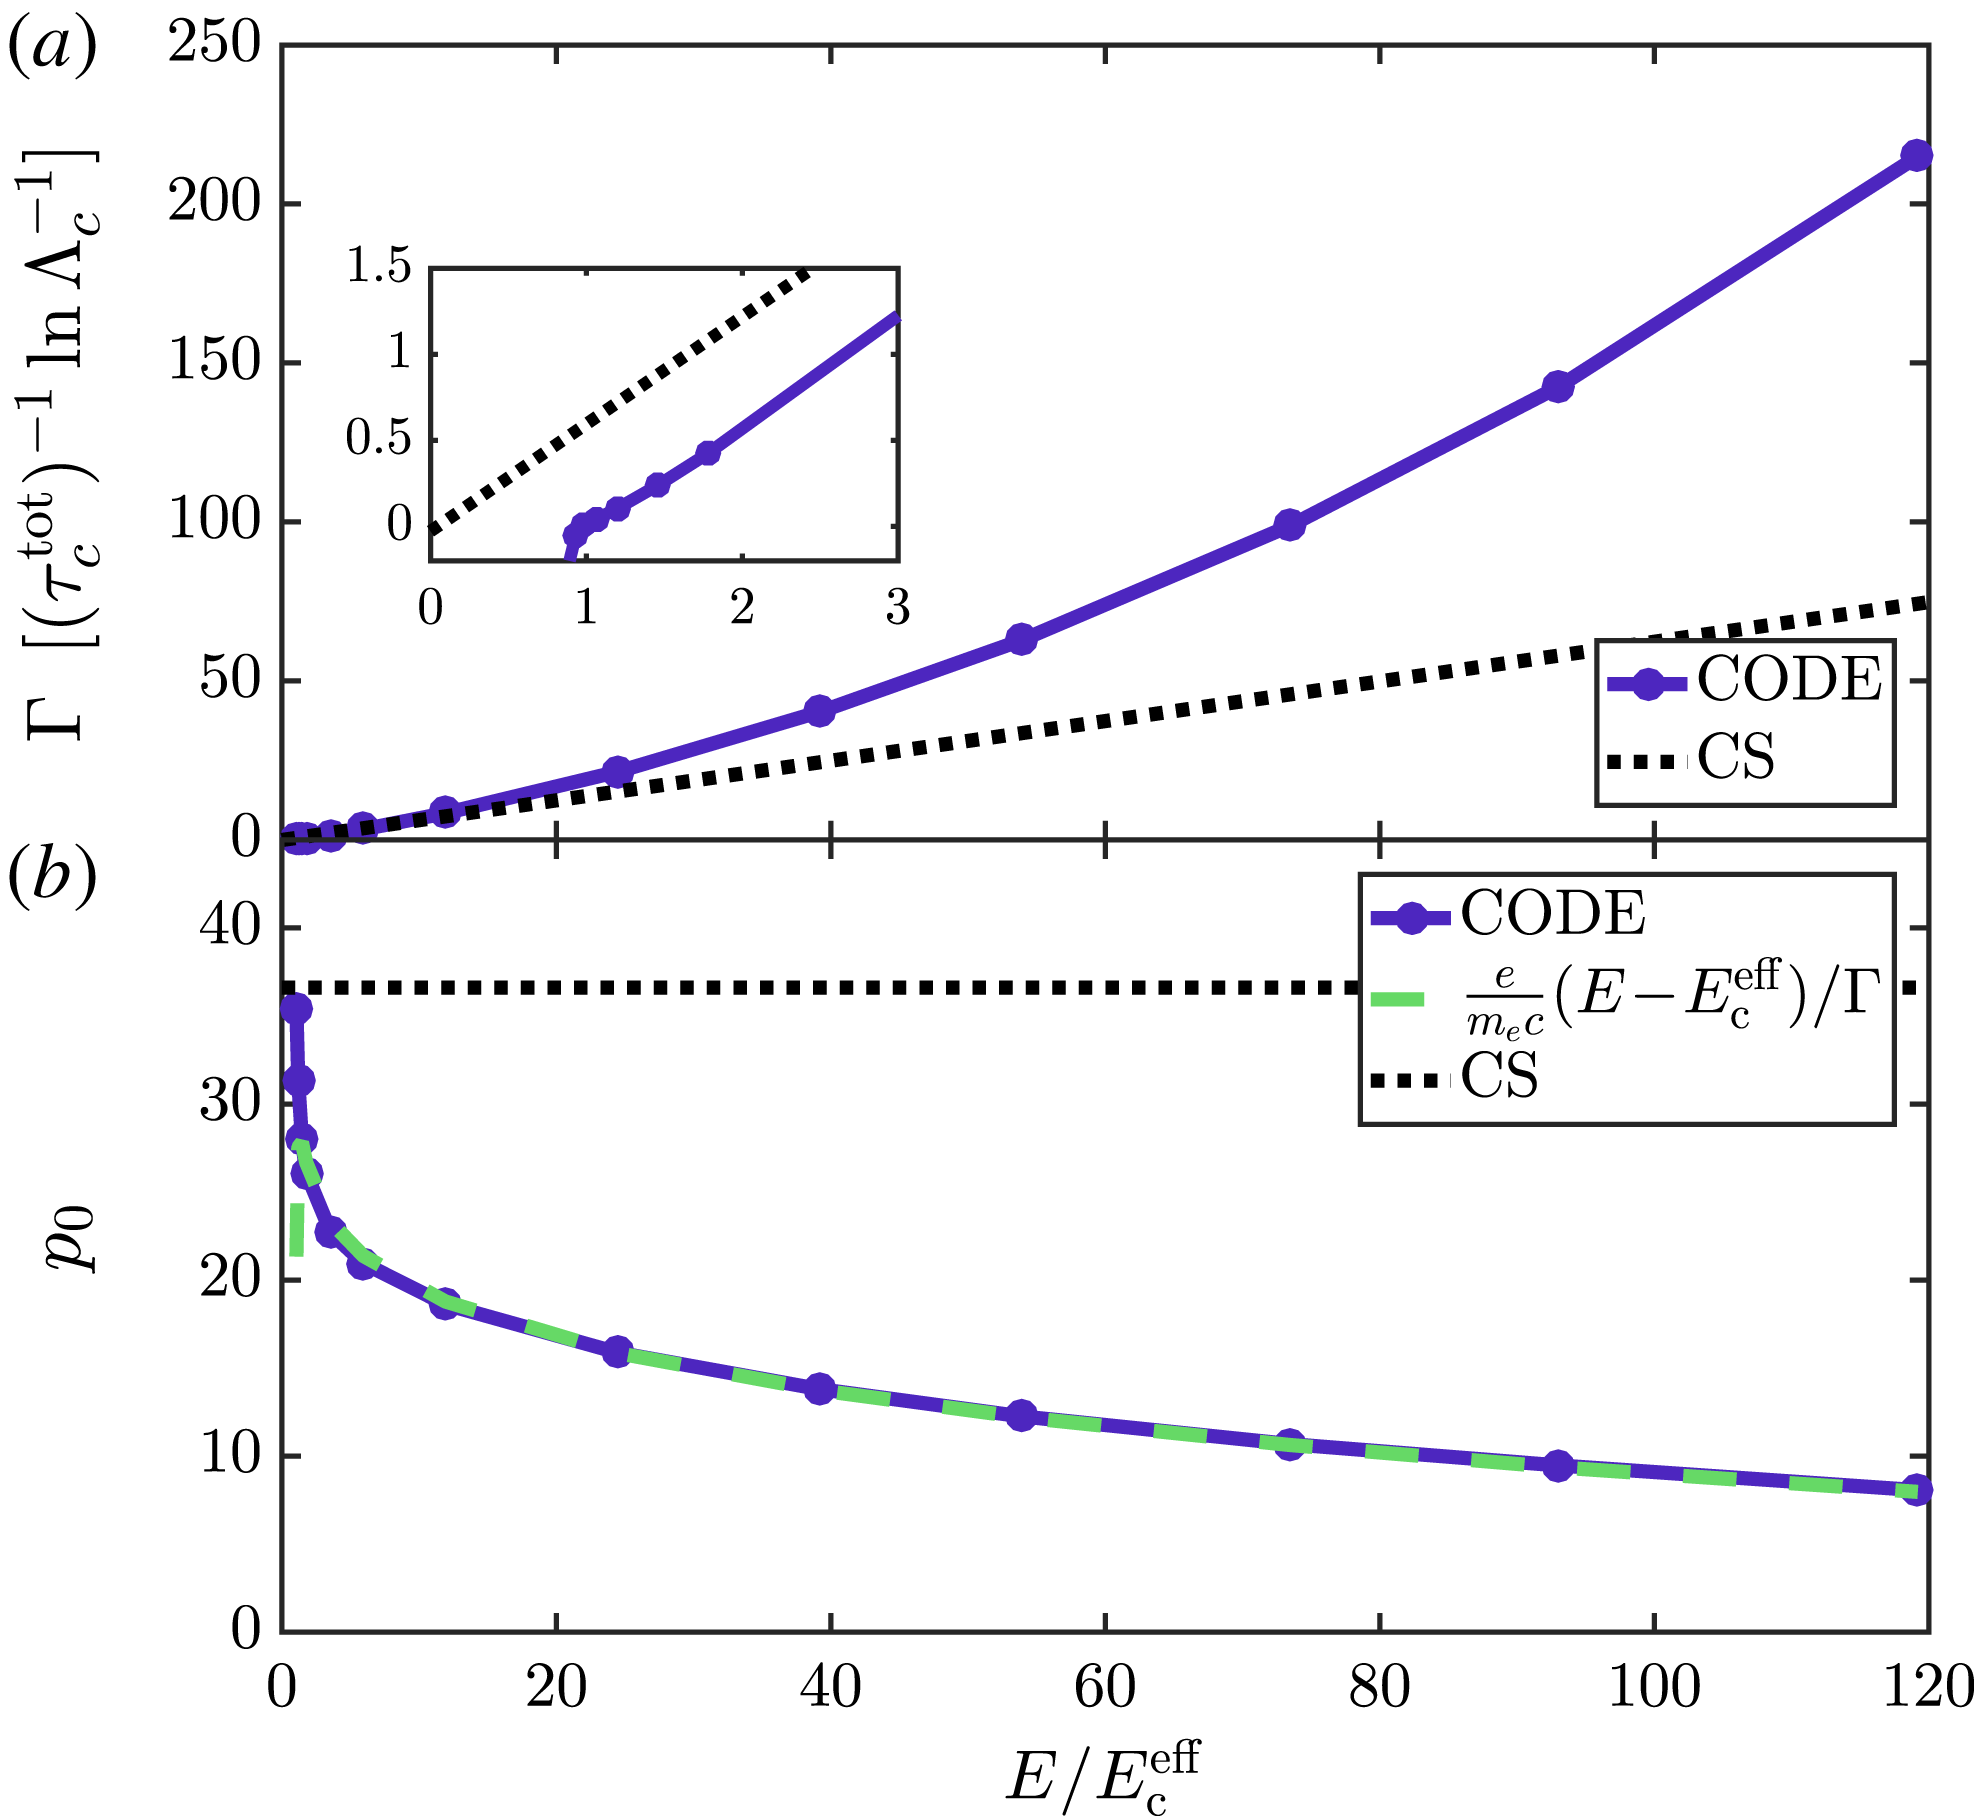
With constant background parameters, the runaway distribution reaches a quasi-steady state and the avalanche growth rate approaches a constant value. This quasi-steady-state growth rate is shown in the presence of singly ionized argon impurities in figure 5(a). Here, the growth rate is plotted against
 $E/E_{\text{c}}^{\text{eff}}$
, where the effective critical electric field
 $E_{\text{c}}^{\text{eff}}\gtrsim E_{\text{c}}^{\text{tot}}=E_{\text{c}}n_{\text{e}}^{\text{tot}}/n_{\text{e}}$
is given in Hesslow et al. (Reference Hesslow, Embréus, Wilkie, Papp and Fülöp2018). These results were obtained by solving the kinetic equation using the numerical solver code (Landreman, Stahl & Fülöp Reference Landreman, Stahl and Fülöp2014; Stahl et al.
Reference Stahl, Embréus, Papp, Landreman and Fülöp2016), including avalanche generation using the field particle Boltzmann operator given in equation (2.17) of Embréus, Stahl & Fülöp (Reference Embréus, Stahl and Fülöp2018), which was also studied by Chiu et al. (Reference Chiu, Rosenbluth, Harvey and Chan1998). Since we here focus on electric fields well above the critical electric field, which are associated with low critical momenta, synchrotron and bremsstrahlung radiation losses are neglected as they are important only at highly relativistic energies; Hesslow et al. (Reference Hesslow, Embréus, Wilkie, Papp and Fülöp2018) demonstrated that radiation losses only have an appreciable effect near the effective critical electric field. The parameters are characteristic of a post-disruption tokamak plasma: temperature
 $T=10~\text{eV}$
, and density of singly ionized argon
 $n_{\text{Ar}}=4n_{\text{D}}$
with
 $n_{\text{D}}=10^{20}~\text{m}^{-3}$
.
(a) Steady-state runaway growth rate as a function of normalized electric field. The partially screened growth rate (solid line) exceeds the completely screened limit (dotted line) at high electric fields, but is significantly lower in the near-critical electric-field region, which is shown in the inset. (b) With partial screening (solid line), the average momentum
 $p_{0}$
decreases with electric field, as predicted by the green dashed line, and is lower than in the completely screened limit (dotted line). The simulation was done at
 $T=10~\text{eV}$
with a plasma composition of D and
 $\text{Ar}^{1+}$
, where
 $n_{\text{D}}=10^{20}~\text{m}^{-3}$
and
 $n_{\text{Ar}}=4n_{\text{D}}$
.

As shown in figure 5(a), the partially screened avalanche growth rate is nonlinear in the electric field. We attribute this nonlinearity to the energy-dependent enhancement of the collision frequencies. At weak electric fields, the critical momentum is large, and therefore also the enhancement of the collision frequencies; however, at larger electric fields, the critical momentum is reduced and the collision frequencies approach the completely screened value. This leads to an avalanche growth which increases faster than
 $\unicode[STIX]{x1D6E4}\propto E-E_{\text{c}}^{\text{eff}}$
.
Interestingly, this nonlinearity of the growth rate causes the partially screened avalanche growth rate to exceed the completely screened limit at large electric fields. For the completely screened limit, we use the Rosenbluth–Putvinski growth-rate formula (Rosenbluth & Putvinski Reference Rosenbluth and Putvinski1997), which has been shown to be accurate to around 10 % in the fully ionized case (Embréus et al. Reference Embréus, Stahl and Fülöp2018) and is given by
 $$\begin{eqnarray}\displaystyle \unicode[STIX]{x1D6E4}_{{\rm \small{rp}},{\rm \small{cs}}} & = & \displaystyle \frac{1}{\unicode[STIX]{x1D70F}_{c}\ln \unicode[STIX]{x1D6EC}_{\text{c}}}\sqrt{\frac{\unicode[STIX]{x03C0}}{3(Z_{\text{eff}}+5)}}\left(\frac{E}{E_{\text{c}}}-1\right)\left(1-\frac{E_{\text{c}}}{E}+\frac{4\unicode[STIX]{x03C0}(Z_{\text{eff}}+1)^{2}}{3(Z_{\text{eff}}+5)(E^{2}/E_{\text{c}}^{2}+3)}\right)^{-1/2}\quad\end{eqnarray}$$
 $$\begin{eqnarray}\displaystyle & {\approx} & \displaystyle \frac{1}{\unicode[STIX]{x1D70F}_{c}\ln \unicode[STIX]{x1D6EC}_{\text{c}}}\sqrt{\frac{\unicode[STIX]{x03C0}}{3(Z_{\text{eff}}+5)}}\left(\frac{E}{E_{\text{c}}}-1\right),\quad E/E_{\text{c}}\gg 2\sqrt{Z_{\text{eff}}+1}.\quad\end{eqnarray}$$
In figure 5(a), it is shown that the partially ionized growth rate is considerably higher than the completely screened value at large electric fields, even though it is significantly lower close to the critical electric field which is illustrated in the zoomed inset.
The enhancement of the avalanche growth rate in the presence of partially ionized atoms originates from the increased number of possible runaway electrons: since the binding energy is negligible compared to the critical runaway energy, the free and the bound electrons have equal probability of becoming runaways through close collisions. At high electric fields, this large enhancement by a factor of
 $n_{\text{e}}^{\text{tot}}/n_{\text{e}}$
dominates over the increased rate of collisional losses, which sets the threshold energy for an electron to become a runaway.
The fact that partially screened impurities can lead to a reduction of the avalanche growth at low electric fields, but an enhancement at larger electric fields, is not captured by the partially screened Rosenbluth–Putvinski formula (Putvinski et al. Reference Putvinski, Fujisawa, Post, Putvinskaya, Rosenbluth and Wesley1997; Rosenbluth & Putvinski Reference Rosenbluth and Putvinski1997)
 $$\begin{eqnarray}\unicode[STIX]{x1D6E4}_{{\rm \small{rp}}}=\frac{1}{\unicode[STIX]{x1D70F}_{c}\ln \unicode[STIX]{x1D6EC}_{\text{c}}}\frac{n_{\text{e}}^{\text{tot}}}{n_{\text{e}}}\sqrt{\frac{\unicode[STIX]{x03C0}}{3(Z_{\text{eff}}^{{\rm \small{rp}}}+5)}}\left(\frac{E}{E_{\text{c}}^{{\rm \small{rp}}}}-1\right),\end{eqnarray}$$
where the effective field includes half of the bound electron density
 $n_{\text{b}}$
, originating from the same factor in
 $\unicode[STIX]{x1D708}_{S}^{\text{ee}}$
from (2.32):
 $$\begin{eqnarray}E_{\text{c}}^{{\rm \small{rp}}}=\left(1+\frac{n_{\text{b}}}{2n_{\text{e}}}\right)E_{\text{c}},\end{eqnarray}$$
and the partially ionized effective charge
 $Z_{\text{eff}}^{{\rm \small{rp}}}$
is taken from Parks–Rosenbluth–Putvinski (Parks, Rosenbluth & Putvinski Reference Parks, Rosenbluth and Putvinski1999):
 $$\begin{eqnarray}Z_{\text{eff}}^{{\rm \small{ rp}}}=\mathop{\sum }_{\substack{ j\,\,\text{part.} \\ \text{ionized}}}\frac{n_{j}}{n_{\text{e}}}\frac{Z_{j}^{2}}{2}+\mathop{\sum }_{\substack{ j\,\,\text{fully} \\ \text{ionized}}}\frac{n_{j}}{n_{\text{e}}}Z_{j}^{2}.\end{eqnarray}$$
For large electric fields,
 $E\gg E_{\text{c}}^{{\rm \small{rp}}}$
, and if the plasma is dominated by a weakly ionized, high-
 $Z$
impurity such as
 $\text{Ar}^{1+}$
, one obtains
 $$\begin{eqnarray}\frac{\unicode[STIX]{x1D6E4}_{{\rm \small{rp}}}}{\unicode[STIX]{x1D6E4}_{{\rm \small{rp}},{\rm \small{cs}}}}\approx \frac{n_{\text{e}}+n_{\text{b}}}{n_{\text{e}}+\frac{1}{2}n_{\text{b}}}\sqrt{\frac{Z_{\text{eff}}+5}{Z_{\text{eff}}^{{\rm \small{rp}}}+5}}<1.\end{eqnarray}$$
In this case, partially ionized impurities decrease the avalanche growth rate significantly, although we find the opposite behaviour with our more accurate kinetic model:
 $$\begin{eqnarray}\unicode[STIX]{x1D6E4}>\unicode[STIX]{x1D6E4}_{{\rm \small{rp}},{\rm \small{cs}}}>\unicode[STIX]{x1D6E4}_{{\rm \small{rp}}},\quad E\gg E_{\text{c}}^{\text{eff}}.\end{eqnarray}$$
Finally, we note that the avalanche growth rate in figure 5(a) may be approximated by a second-order polynomial. This behaviour is somewhat similar to the quadratic behaviour of the full Rosenbluth–Putvinski formula (3.2) in the limit
 $2\sqrt{Z_{\text{eff}}+1}\gg E/E_{\text{c}}\gg 1$
. However, evaluating this criterion with
 $Z_{\text{eff}}^{{\rm \small{rp}}}$
and
 $E_{\text{c}}^{{\rm \small{rp}}}$
predicts that this quadratic regime should only occur if
 $E\lesssim 9E_{\text{c}}^{\text{eff}}$
for the range of parameters in figure 5. Consequently, the Rosenbluth–Putvinski formula cannot easily be modified to accurately capture the effect of screening on the avalanche growth rate.
The increased growth rate has direct implications for the avalanche multiplication factor, which determines the maximum amplification of a small seed due to avalanche multiplication. To estimate this effect we consider the example of a tokamak disruption, where a part of the initial current is converted to runaways via avalanching. We follow the calculation of Helander, Eriksson & Andersson (Reference Helander, Eriksson and Andersson2002) under the approximation
 $\unicode[STIX]{x1D6E4}\approx \unicode[STIX]{x1D6E4}_{0}E/E_{\text{c}}^{\text{eff}}$
where
 $\unicode[STIX]{x1D6E4}_{0}$
is independent of the electric field. Neglecting electric-field diffusion – which may however significantly affect the final runaway current profile (Eriksson et al.
Reference Eriksson, Helander, Andersson, Anderson and Lisak2004; Smith et al.
Reference Smith, Helander, Eriksson, Anderson, Lisak and Andersson2006) – the zero-dimensional induction equation is
 $$\begin{eqnarray}E=-\frac{L}{2\unicode[STIX]{x03C0}R}\frac{\text{d}I}{\text{d}t},\end{eqnarray}$$
where
 $L\sim \unicode[STIX]{x1D707}_{0}R$
is the self-inductance and
 $R$
is the major radius of the tokamak. Then, equation (3.1) can be written
 $$\begin{eqnarray}\frac{\text{d}}{\text{d}t}\ln n_{\text{RE}}\approx -\frac{\text{d}}{\text{d}t}\frac{IL\unicode[STIX]{x1D6E4}_{0}}{2\unicode[STIX]{x03C0}RE_{\text{c}}^{\text{eff}}},\end{eqnarray}$$
and therefore an initial seed
 $n_{0}$
can be multiplied by up to a factor of
 $$\begin{eqnarray}\frac{n_{\text{RE}}}{n_{0}}=\exp \left(\frac{I_{0}L\unicode[STIX]{x1D6E4}_{0}}{2\unicode[STIX]{x03C0}RE_{\text{c}}^{\text{eff}}}\right).\end{eqnarray}$$
The exponent can be large in high-current devices (Rosenbluth & Putvinski Reference Rosenbluth and Putvinski1997). Consequently, if the induced electric field is much larger than
 $E_{\text{c}}^{\text{eff}}$
, heavy-impurity injection can increase the avalanche multiplication factor significantly. However, to fully understand runaway beam formation in the presence of partially ionized impurities, the combined effect of avalanche multiplication and seed generation must be accounted for, as the seed formation is also sensitive to the injected impurities (Aleynikov & Breizman Reference Aleynikov and Breizman2017).
The nonlinear avalanche growth rate also manifests itself in the quasi-steady-state avalanche distribution, which can be seen by following the derivation of the avalanching distribution in the limit
 $E\gg E_{\text{c}}$
by Fülöp et al. (Reference Fülöp, Pokol, Helander and Lisak2006), which we detail in appendix C. Analogously to Fülöp et al. (Reference Fülöp, Pokol, Helander and Lisak2006), the resulting energy dependence of the distribution function
 $F(p,t)\approx 2\unicode[STIX]{x03C0}p^{2}\int _{-1}^{1}f\,\text{d}\unicode[STIX]{x1D709}$
is given by
 $$\begin{eqnarray}F(p,t)=n_{\text{RE}}(t)\frac{1}{p_{0}}\text{e}^{-p/p_{0}},\end{eqnarray}$$
where the average momentum is given by
 $$\begin{eqnarray}p_{0}=\frac{e}{m_{\text{e}}c}\frac{E-E_{\text{c}}^{\text{eff}}}{\unicode[STIX]{x1D6E4}(E)}.\end{eqnarray}$$
In contrast to the fully ionized result
 $p_{0}=\sqrt{Z+5}\ln \unicode[STIX]{x1D6EC}_{\text{c}}$
, the average momentum acquires a significant electric-field dependence in the presence of partially screened ions. This momentum dependence is shown in figure 5(b), where we find
 $p_{0}$
from fitting the high-energy part of the electron distribution to an exponential decay. This average energy obtained in the code simulation agrees well with the prediction in (3.12) in the region where it is valid, i.e.
 $E\gg E_{\text{c}}^{\text{eff}}$
. Note that the average energy is well below the complete-screening limit shown in dotted line, where
 $p_{0}\approx \sqrt{6}\ln \unicode[STIX]{x1D6EC}_{\text{c}}$
.
4 Effect of partial screening on the validity of the Fokker–Planck operator
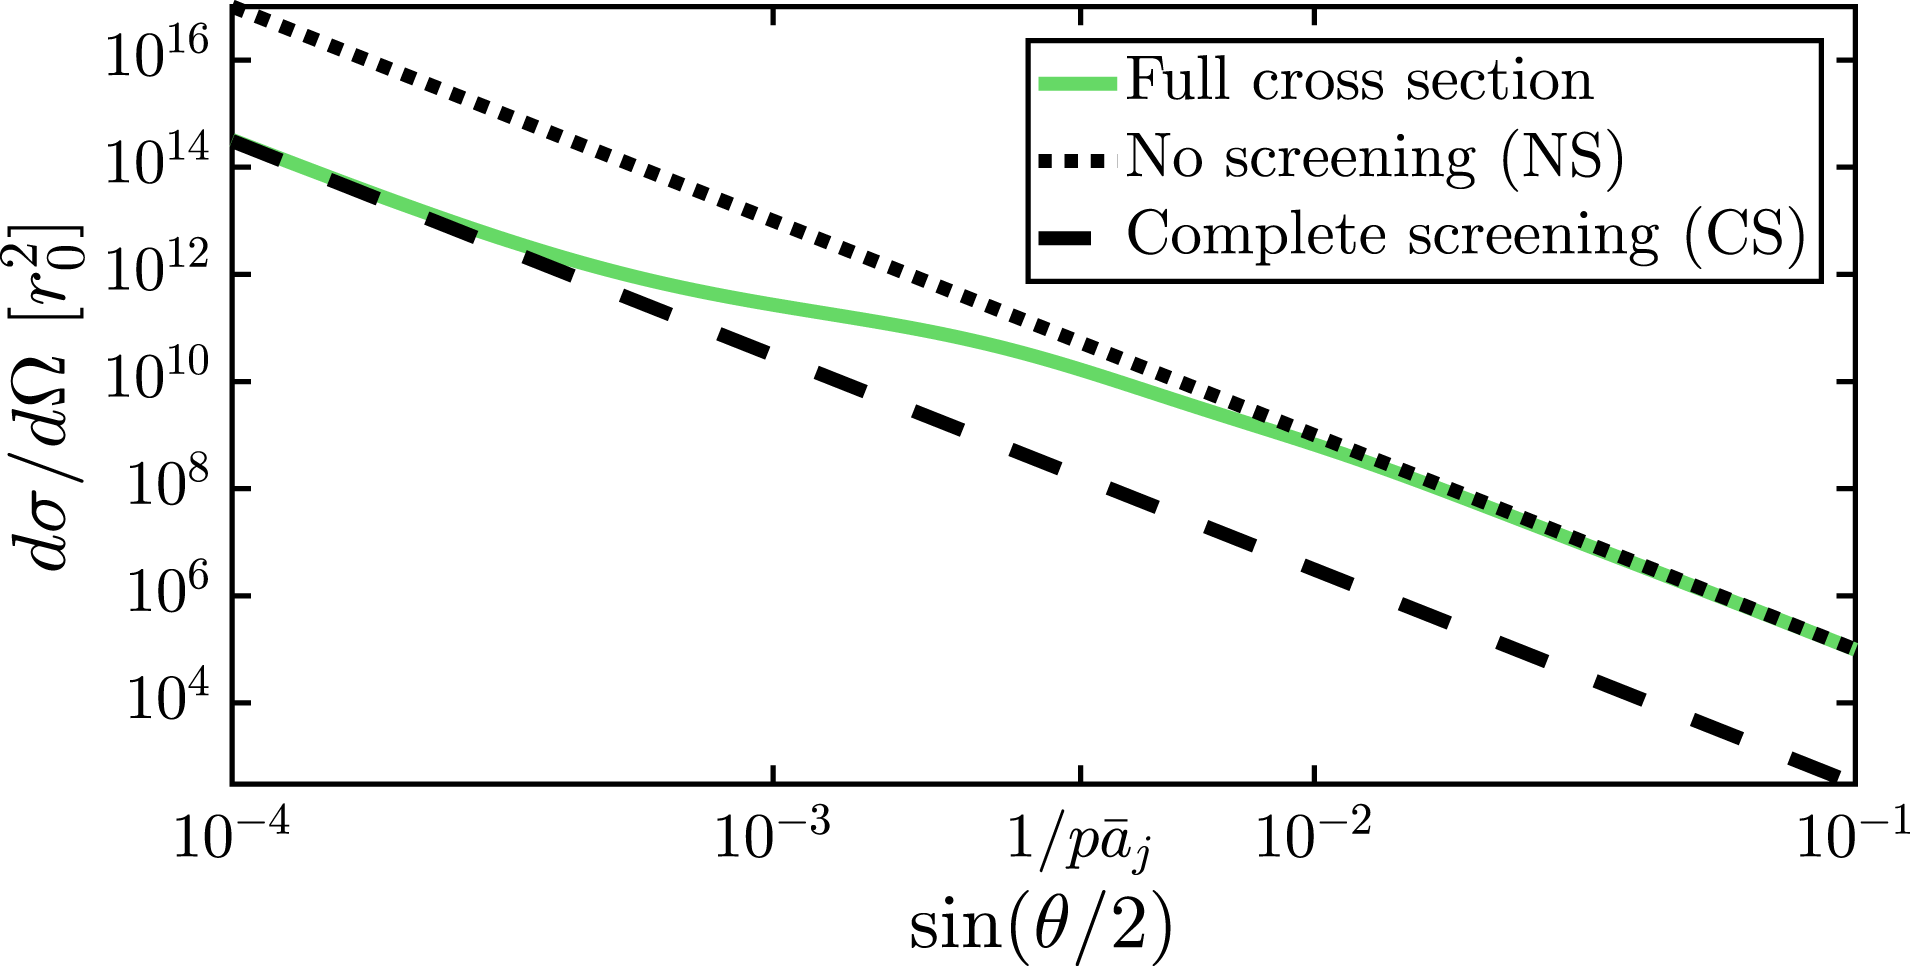
Scenarios where small-angle collisions dominate can be accurately modelled by the Fokker–Planck collision operator, whereas the more complicated Boltzmann operator must be used if large-angle collisions are significant. Partial screening enhances the elastic electron–ion scattering cross-section for large momentum transfers while leaving it unaltered for small momentum transfers (see figure 6). Thus, large-angle collisions are expected to be relatively more important in the partially screened collision operator than in the limit of complete screening. In this section we will show that even though the two collision operators produce slightly different distribution functions, this difference has a negligible effect on the key runaway quantities, such as the runaway density and current.
Here, we consider the full Boltzmann operator for collisions between runaway electrons and the background plasma. For electron–ion collisions, we use the full operator, whereas for electron–electron collisions, we follow the method developed by Embréus et al. (Reference Embréus, Stahl and Fülöp2018) and only consider collisions with a momentum transfer larger than a cutoff
 $p_{m}$
. Note that in modelling collisions with the bound electrons, for which the full differential cross-section is unknown, the Møller cross-section can still be used since the energy transfer corresponding to the cutoff is typically chosen to be significantly larger than the binding energy.
The differential cross-section for elastic electron–ion collisions as a function of deflection angle using the full DFT density to calculate the form factor (solid green), which exhibits a smooth transition from complete screening (dashed black line) to the larger cross-section with no screening (dotted black line). The cross-section falls off as
 $\sin ^{4}(\unicode[STIX]{x1D703}/2)$
; however the curve is flatter in the transition region around
 $\sin (\unicode[STIX]{x1D703}/2)p\bar{a}_{j}\sim 1$
. The cross-section was evaluated for singly ionized argon at
 $p=3$
.

The general form of the Boltzmann operator is (Cercignani & Kremer Reference Cercignani and Kremer2002)

where  is the Møller relative speed and
 $\text{d}\unicode[STIX]{x1D70E}_{\mathit{ab}}$
is the differential cross-section for collisions in which the momentum of species
 $a$
changes from
 $\boldsymbol{p}$
to
 $\boldsymbol{p}_{1}$
, while
 $\boldsymbol{p}^{\prime }\rightarrow \boldsymbol{p}_{2}$
for species
 $b$
. The collision operator can be understood as the rate at which species
 $a$
scatters from
 $\boldsymbol{p}_{1}$
into
 $\boldsymbol{p}$
, minus the rate of the opposite scattering process. Elastic electron–ion collisions are particularly convenient to model with the Boltzmann operator, since the ions can be modelled as stationary, infinitely heavy target particles and the cross-section only depends on
 $p$
,
 $p_{1}$
and
 $\unicode[STIX]{x1D703}$
. When expanded in Legendre polynomials,
 $$\begin{eqnarray}\displaystyle & \displaystyle C^{\text{B},\text{ei}}=\mathop{\sum }_{j}\mathop{\sum }_{L}C_{L}^{\text{B},\text{e}j}P_{L}(\unicode[STIX]{x1D709}) & \displaystyle\end{eqnarray}$$
 $$\begin{eqnarray}\displaystyle & \displaystyle f_{\text{e}}(p,\unicode[STIX]{x1D703},t)=\mathop{\sum }_{L}f_{L}(p,t)P_{L}(\unicode[STIX]{x1D709}), & \displaystyle\end{eqnarray}$$
the Boltzmann operator takes the following form:
 $$\begin{eqnarray}\displaystyle C_{L}^{\text{B},\text{e}j} & = & \displaystyle -n_{j}vf_{L}\int _{\unicode[STIX]{x1D703}_{\text{min}}}^{\unicode[STIX]{x03C0}}[1-P_{L}(\cos \unicode[STIX]{x1D703})]\frac{\unicode[STIX]{x2202}\unicode[STIX]{x1D70E}_{\text{e}j}}{\unicode[STIX]{x2202}\unicode[STIX]{x1D6FA}}\,\text{d}\unicode[STIX]{x1D6FA}\end{eqnarray}$$
 $$\begin{eqnarray}\displaystyle & = & \displaystyle -2\unicode[STIX]{x03C0}n_{j}cr_{0}^{2}f_{L}\frac{\unicode[STIX]{x1D6FE}}{p^{3}}\int _{1/\unicode[STIX]{x1D6EC}}^{1}\frac{|Z_{j}-F_{j}(q)|^{2}}{x}\frac{1-P_{L}(1-2x^{2})}{x^{2}}\frac{(1-x^{2})p^{2}+1}{p^{2}+1}\,\text{d}x,\quad\end{eqnarray}$$
where we again introduced
 $x=\sin (\unicode[STIX]{x1D703}/2)$
and inserted the differential cross-section in (2.11). Using
 ${\mathcal{L}}\{f_{\text{e}}\}=-(1/2)\sum _{L}L(L+1)P_{L}(\unicode[STIX]{x1D709})f_{L}$
, we arrive at the following ratio between the Boltzmann operator and the Fokker–Planck electron–ion collision operator in (2.21):
 $$\begin{eqnarray}\frac{C_{L}^{\text{B},\text{e}j}}{C_{L}^{\text{FP},\text{e}j}}=\left(\int _{1/\unicode[STIX]{x1D6EC}}^{1}\frac{[Z_{j}-F_{j}(q)]^{2}}{x}\,\text{d}x\right)^{-1}\int _{1/\unicode[STIX]{x1D6EC}}^{1}\frac{[Z_{j}-F_{j}(q)]^{2}}{x}\frac{1-P_{L}(1-2x^{2})}{L(L+1)x^{2}}\frac{(1-x^{2})p^{2}+1}{p^{2}+1}\,\text{d}x.\end{eqnarray}$$
Since
 $P_{1}(x)=x$
, equation (4.6) evaluates to unity for
 $L=1$
and
 $p=0$
. Note that the same is true for the integrand when
 $x\ll 1\;\forall L,p$
.
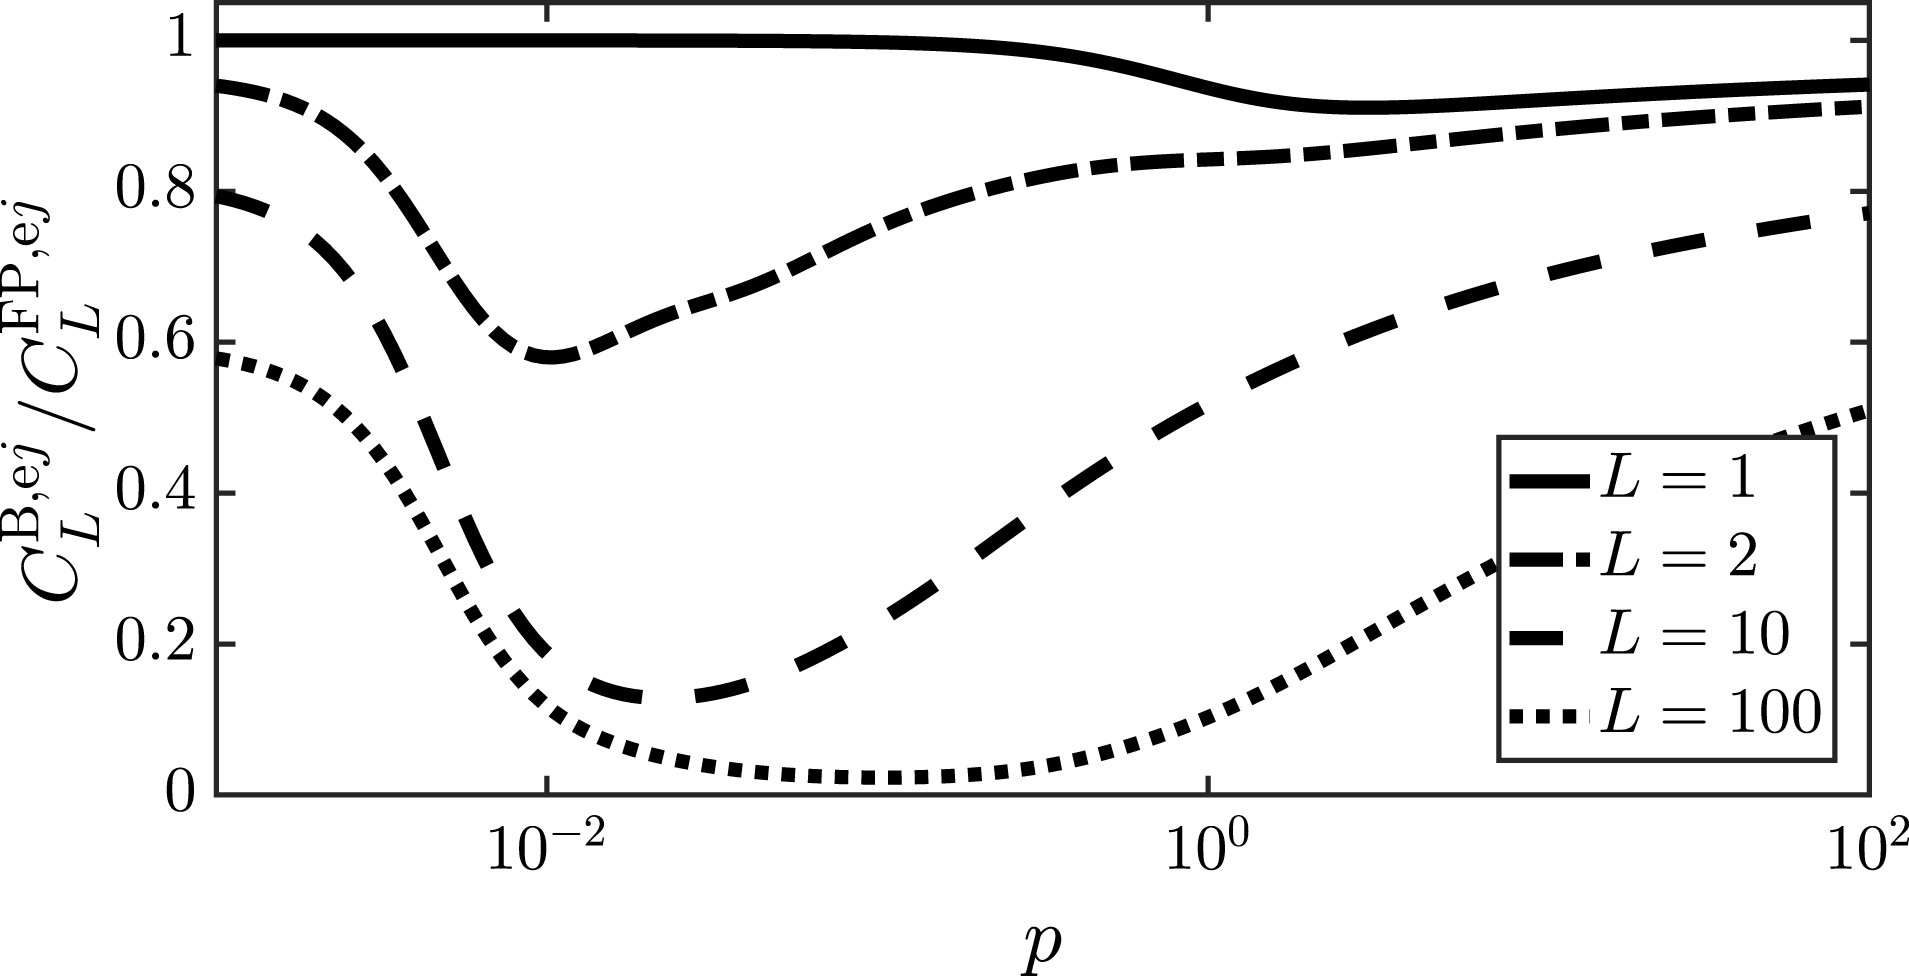
Ratio of the Legendre modes of the Boltzmann and Fokker–Planck operators for singly ionized argon. The full DFT model was used in the figure, but the results are similar if the TF-DFT model is used instead.

Like the Fokker–Planck operator, the Boltzmann operator drives the distribution towards spherical symmetry, which can be seen by noting that
 $C_{L}^{\text{B},\text{e}j}$
is negative and proportional to
 $f_{L}$
, while
 $C_{0}^{\text{B},\text{e}j}=0$
. Effectively, the Boltzmann operator takes the form of a generalized
 $\unicode[STIX]{x1D708}_{\text{D}}^{\text{ei}}$
which depends on the Legendre mode number
 $L$
. The ratios of the Legendre modes of the Boltzmann and Fokker–Planck operators are shown in figure 7 for four different values of
 $L$
. As expected from (4.6), the Boltzmann operator produces the same result as the Fokker–Planck operator for
 $L=1$
and
 $p\ll 1$
, and only differs by a factor of order
 $1/\ln \unicode[STIX]{x1D6EC}$
at higher energies. In contrast, the ratio between the Boltzmann operator and the Fokker–Planck operator decreases rapidly with
 $L$
, and the diffusion rates are significantly reduced for
 $L\geqslant 10$
for a large range of momenta. High-
 $L$
-structure will therefore be suppressed too quickly by the Fokker–Planck operator compared to the more accurate Boltzmann operator. This means that the two operators can be expected to produce different pitch-angle distributions in scenarios where the average pitch angle is small.
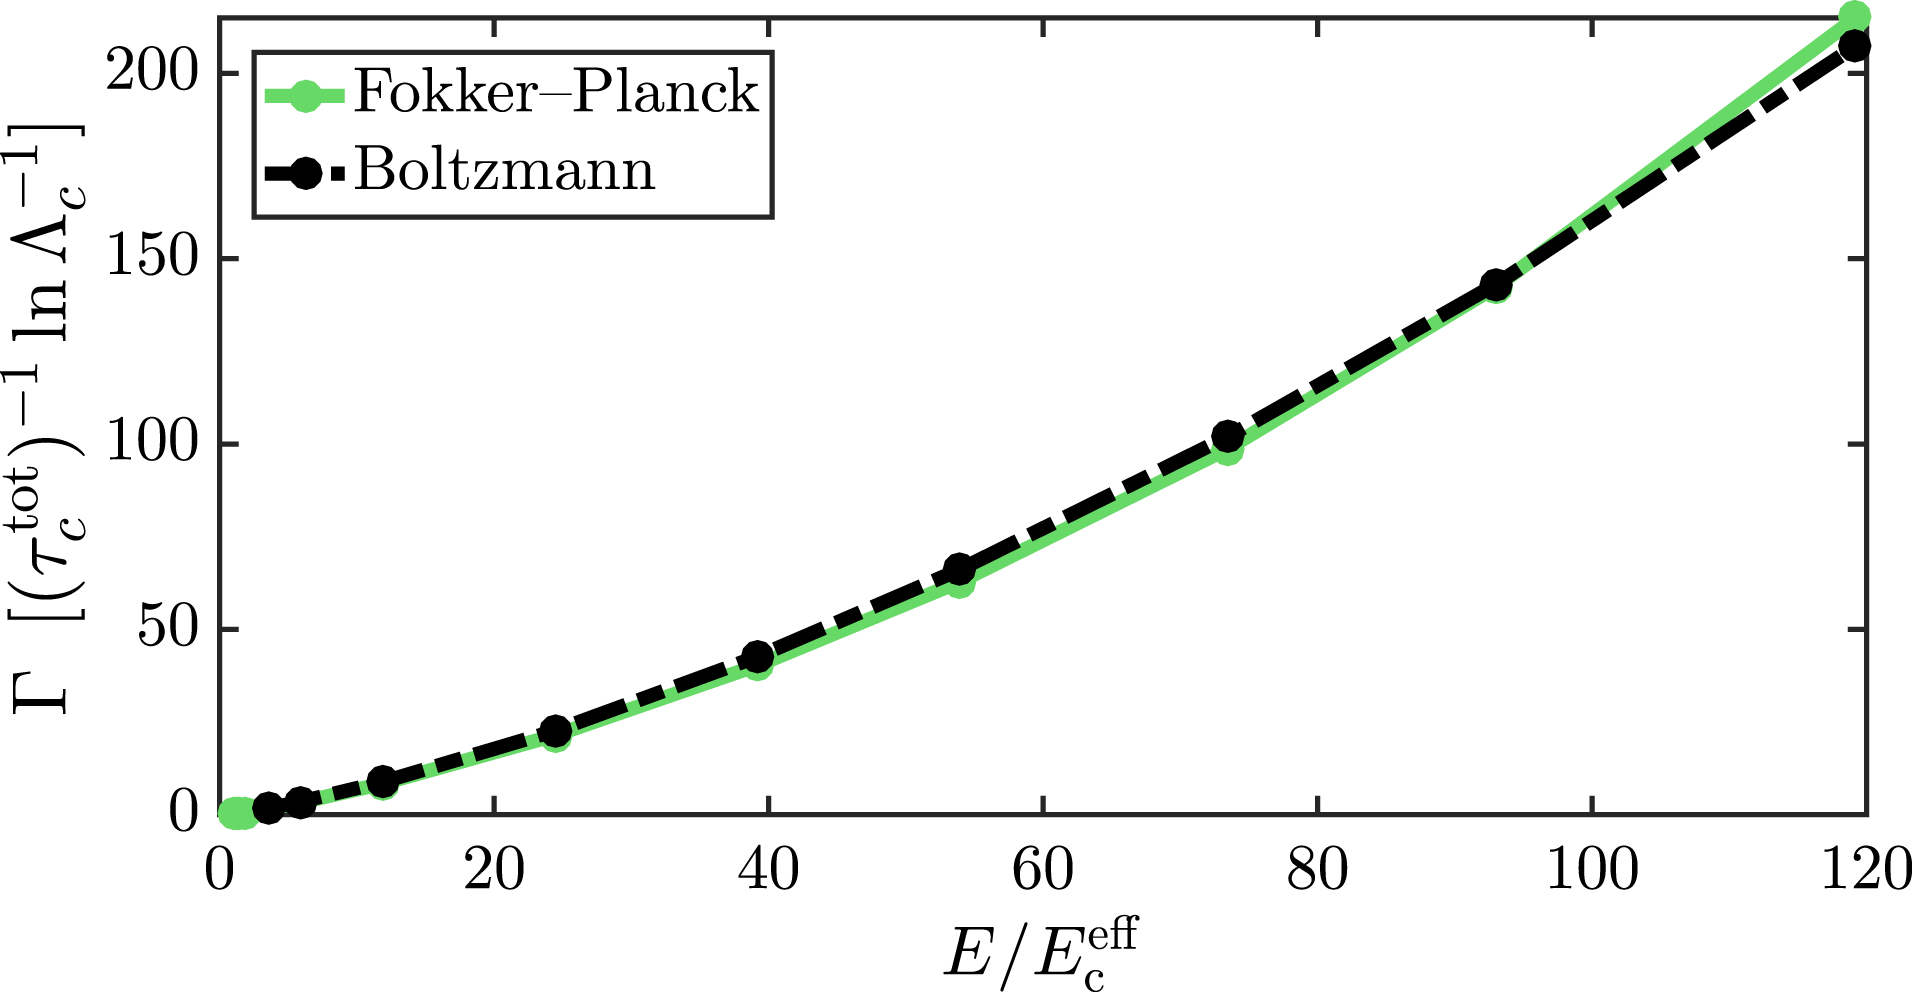
A suitable scenario to study the effect of the Boltzmann operator is the avalanche growth rate at high electric fields, which gives a narrow distribution function and thus requires a large number of Legendre modes to describe the distribution. Figure 8 shows the steady-state runaway growth rate as a function of
 $E/E_{\text{c}}^{\text{eff}}$
where
 $E_{\text{c}}^{\text{eff}}$
is the effective critical field given by Hesslow et al. (Reference Hesslow, Embréus, Wilkie, Papp and Fülöp2018). These growth rates were obtained by solving the kinetic equation using code with the same parameters as in figure 5, with both the Fokker–Planck operator and the Boltzmann operator. As we show in figure 8, the difference in the runaway growth rate between the Fokker–Planck operator and the Boltzmann operator is relatively small. This result may appear surprising, since the avalanche growth rate formula (3.3) depends on
 $Z$
, indicating a sensitivity to the pitch-angle dynamics. We speculate that the similarity can be attributed to the agreement in the zeroth and first Legendre modes of the Fokker–Planck and Boltzmann operators as shown in figure 7. This may be sufficient since the essential runaway quantities are most sensitive to the behaviour of these modes, with the runaway density and energy fully contained in
 $f_{0}$
, and the current in
 $f_{1}$
.
Steady-state avalanche growth rate as a function of normalized electric field. The Fokker–Planck and Boltzmann operators give almost identical results. The simulation was done at
 $T=10~\text{eV}$
with a plasma composition of D and
 $\text{Ar}^{1+}$
, where
 $n_{\text{D}}=10^{20}~\text{m}^{-3}$
and
 $n_{\text{Ar}}=4n_{\text{D}}$
.

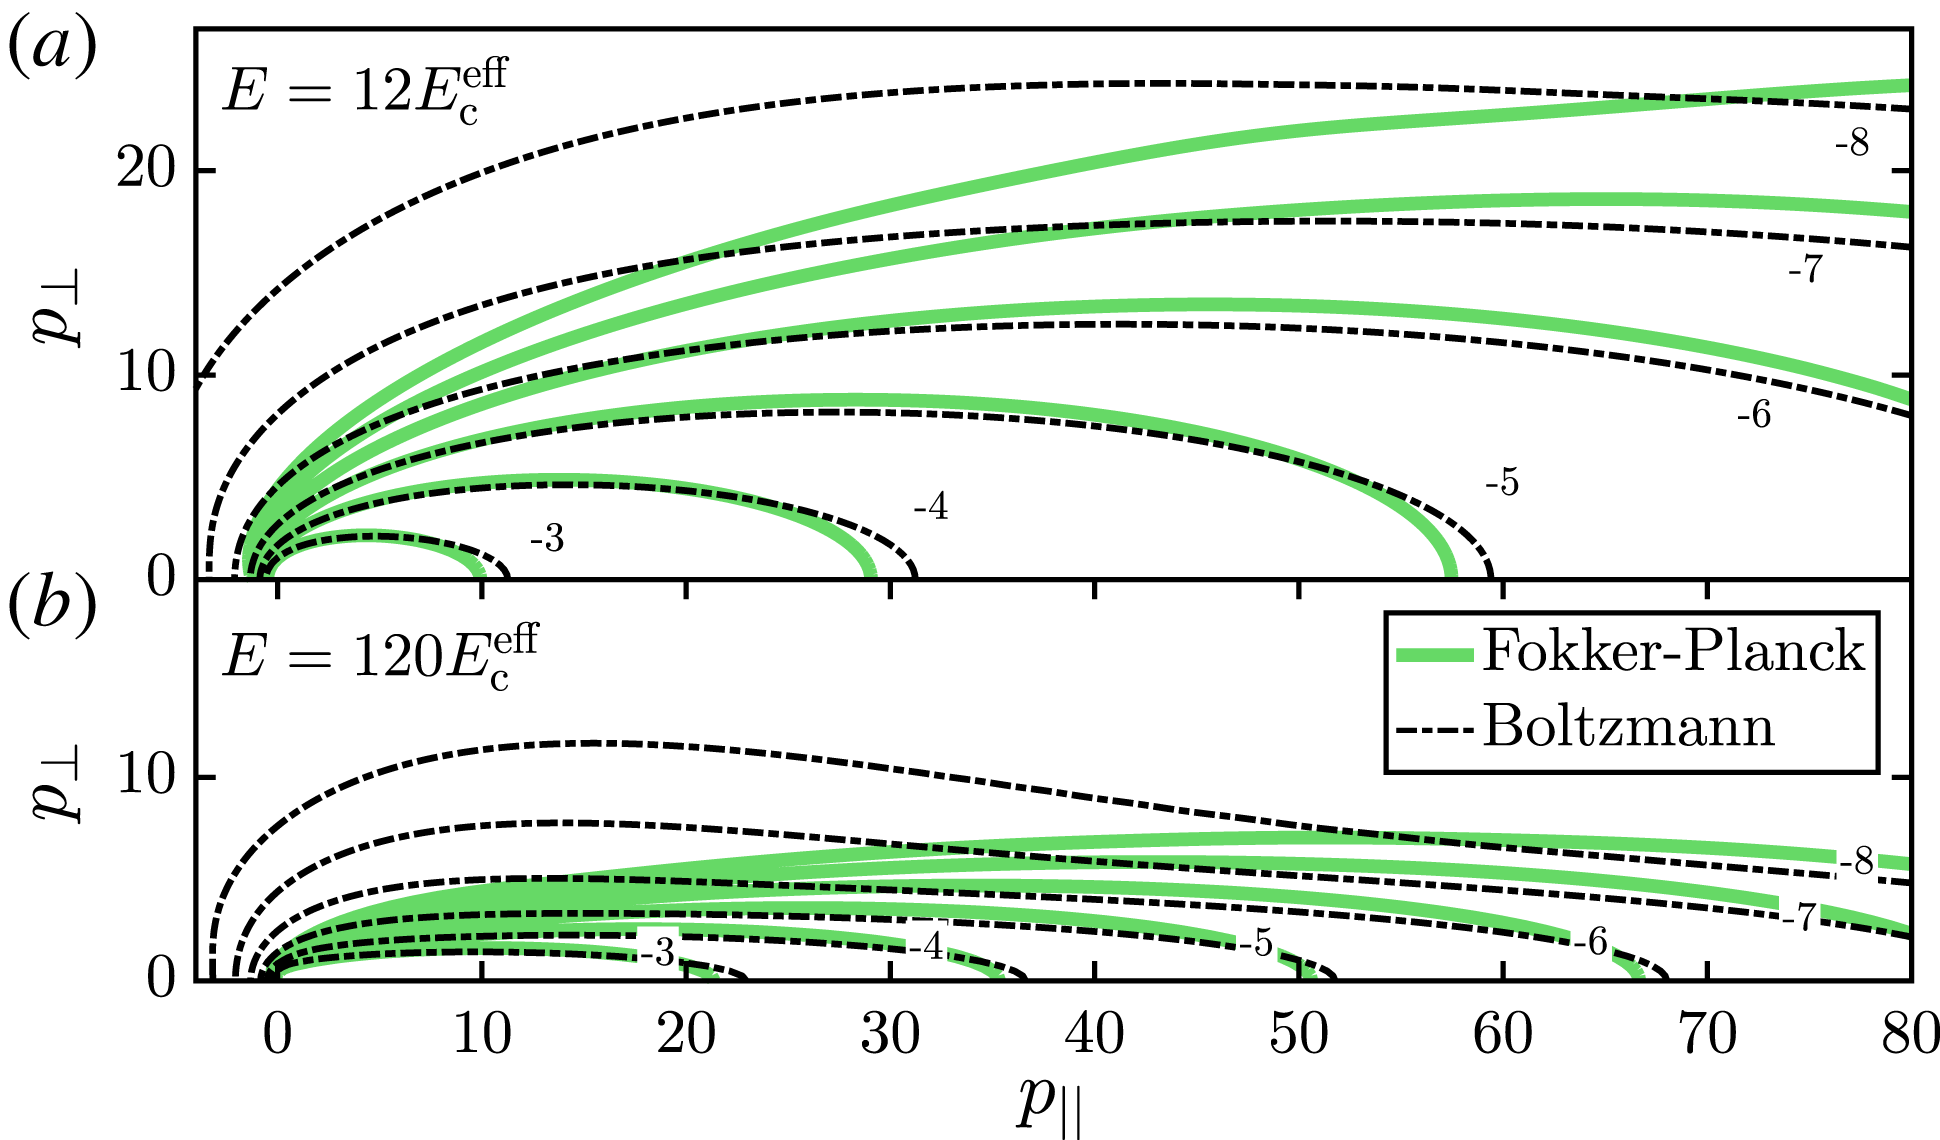
Contour plots of the quasi-steady-state runaway electron distribution function obtained using the Fokker–Planck operator (solid green) and the Boltzmann operator (dash-dotted, thin black), respectively. The contours show
 $\log _{10}(F)=(-8,-7,\ldots ,-3)$
as indicated in the figure, where
 $F=m_{\text{e}}^{3}c^{3}f_{\text{e}}/n_{\text{RE}}$
, so that
 $\int 2\unicode[STIX]{x03C0}p_{\bot }F\,\text{d}p_{\bot }\,\text{d}p_{\Vert }=1$
when integrated over the runaway population. The distributions are taken from the data points (a)
 $E=12E_{\text{c}}^{\text{eff}}$
and (b)
 $E=120E_{\text{c}}^{\text{eff}}$
in figure 8.

Figure 9 shows contour plots of the runaway electron distribution function using the Fokker–Planck and Boltzmann operators respectively. While the overall shape and energy of the distributions are similar, the Boltzmann operator leads to a pitch-angle distribution which develops ‘wings’ consisting of a small runaway population with significantly enhanced perpendicular momentum. This effect is particularly pronounced at high electric fields where the average pitch angle is small and at moderate energies, which is consistent with our expectation based on figure 7. This indicates that using the Boltzmann operator could affect quantities that are particularly sensitive to the angular distribution, such as the emitted synchrotron radiation (Finken et al. Reference Finken, Watkins, Rusbüldt, Corbett, Dippel, Goebel and Moyer1990; Hoppe et al. Reference Hoppe, Embréus, Paz-Soldan, Moyer and Fülöp2018a ,Reference Hoppe, Embréus, Tinguely, Granetz, Stahl and Fülöp b ). In order to quantify the differences we used the syrup code (Stahl et al. Reference Stahl, Landreman, Papp, Hollmann and Fülöp2013) to calculate synchrotron spectra from the runaway electron distributions using the Fokker–Planck and Boltzmann operators, respectively, with a 5 T magnetic field. Figure 10 shows that in comparison with the Fokker–Planck operator, the Boltzmann collision operator leads to a spectrum with peak at a shorter wavelength. Again, we see that the difference is more pronounced at larger electric fields.
Synchrotron radiation spectra from the runaway electron distribution function, comparing the Boltzmann collision operator with the Fokker–Planck collision operator, in a magnetic field with strength
 $B=5~\text{T}$
. Both are normalized to the maximum value of the Fokker–Planck spectrum in the chosen wavelength interval. As in figure 9, the distributions are taken from
 $E=12E_{\text{c}}^{\text{eff}}$
and
 $E=120E_{\text{c}}^{\text{eff}}$
in figure 8. The Boltzmann collision operator causes significantly stronger synchrotron emission than the Fokker–Planck operator, although the shape of the spectra are similar.

Steady-state primary growth rate as a function of the electric field normalized to the Dreicer field (calculated with the free electron density). Screening effects lead to significantly lower growth rates than the completely screened dotted blue line, but the Fokker–Planck operator (solid green) and Boltzmann operator (dash-dotted black) show a qualitatively similar behaviour. The simulation was done at
 $T=10~\text{eV}$
with a plasma composed of D and
 $\text{Ar}^{1+}$
, where
 $n_{\text{D}}=10^{20}~\text{m}^{-3}$
and
 $n_{\text{Ar}}=4n_{\text{D}}$
.

Another quantity which is highly sensitive to input parameters is the primary (Dreicer) growth rate, which in a fully ionized plasma varies exponentially with both the electric field normalized to the Dreicer field
 $E_{\text{D}}$
and the effective charge (Connor & Hastie Reference Connor and Hastie1975). One may therefore expect that the differences between the Fokker–Planck and the Boltzmann operator are amplified in the Dreicer growth rate, which is verified in figure 11. Most notably, the partially screened collision operator reduces the Dreicer growth rate by several orders of magnitude compared to the completely screened case. In contrast, the Fokker–Planck and the Boltzmann operator exhibit a similar qualitative behaviour, with differences around tens of per cent in most of the interval. Although significant, this growth rate difference between the two collision operators is small compared to uncertainties in both experimental parameters and the collision operator. As discussed in § 2, the latter is because the validity of the Born approximation breaks down at the low critical momenta obtained with the electric fields in figure 11. Consequently, the differences between the Fokker–Planck and the Boltzmann operator cannot be regarded as practically relevant.
5 Conclusions
Collisions between fast electrons and partially ionized atoms are sensitive to the effect of screening. In this paper, we derived a collision operator accounting for the effect of partial screening. This generalization of the Fokker–Planck operator in a fully ionized plasma can be expressed as modifications to the deflection and slowing-down frequencies. To obtain these collision frequencies, we treated the interaction between fast electrons and partially ionized impurities quantum mechanically in the Born approximation. We used DFT calculations to obtain the electron-density distribution of the impurity ions, which determined the differential cross-sections for elastic scattering. This allowed us to define an effective ion length scale, and we display these results in table 1 for the ion species that are most common in fusion experiments: helium, beryllium, carbon, nitrogen, neon, argon, xenon and tungsten. The results showed that a formula for this length scale based on the Thomas–Fermi model usually suffices for an accurate description of screening effects. However, the length scales derived from DFT give higher accuracy, especially for low electron momenta. Combined with a stopping-power description of inelastic scattering, this forms the generalized collision operator for fast electrons interacting with partially ionized impurities.
Using the generalized collision operator, the runaway growth rate and energy spectrum were calculated. Unlike the completely screened description, screening effects lead to a stronger-than-linear electric-field dependence causing a significantly enhanced avalanche growth rate at high electric fields. This behaviour contrasts previous results (Putvinski et al. Reference Putvinski, Fujisawa, Post, Putvinskaya, Rosenbluth and Wesley1997), which predicted the growth rate to always be reduced compared to the completely screened limit. At weak electric fields, partial screening however reduces the avalanche growth rate by significantly enhancing the threshold field. In addition, we found that the exponentially decaying avalanche-dominated energy spectrum has an average energy that depends on the electric field. This energy is significantly lower than with complete screening, which is equivalent to a fully ionized plasma having the same effective charge.
Finally, we showed that the validity of the Fokker–Planck equation is less clearly satisfied for partially screened collisions than in the pure Coulomb case, due to the enhancement of large momentum transfers. Despite this, we found that the runaway energy and growth rate are well captured by a treatment based on the Fokker–Planck operator. The overall shape of the fast-electron distribution is somewhat different in the more precise Boltzmann approach, but this has negligible effect on the integrated quantities such as the energy spectrum and runaway current. However, quantities which are highly sensitive to the angular distribution, such as synchrotron radiation, can be moderately affected in high-electric-field cases.
Acknowledgements
The authors are grateful to S. Newton, G. Wilkie and I. Pusztai for fruitful discussions. This work was supported by the Swedish Research Council (Dnr. 2014-5510), the Knut and Alice Wallenberg Foundation and the European Research Council (ERC-2014-CoG grant 647121). The work has been carried out within the framework of the EUROfusion Consortium and has received funding from the Euratom research and training programme 2014–2018 under grant agreement no. 633053. The views and opinions expressed herein do not necessarily reflect those of the European Commission.
Appendix A. Evaluating the terms in the collision operator with covariant notation
To obtain an explicit form of the collision operator in spherical coordinates
 $\{p,\unicode[STIX]{x1D703},\unicode[STIX]{x1D719}\}$
where
 $\boldsymbol{p}=(p,0,0)$
, we transform the expressions in (2.16) into an arbitrary coordinate system
 $\{\boldsymbol{e}^{\unicode[STIX]{x1D707}}\}$
, where the moments are
 $$\begin{eqnarray}\left.\begin{array}{@{}rcl@{}}\langle \unicode[STIX]{x0394}p^{\unicode[STIX]{x1D707}}\rangle _{\text{e}j}\ & =\ & (\boldsymbol{e}^{\unicode[STIX]{x1D707}}\boldsymbol{\cdot }\boldsymbol{e}_{L,j})\unicode[STIX]{x0394}p_{L}^{\unicode[STIX]{x1D708}}\\ \ & =\ & \displaystyle \frac{p^{\unicode[STIX]{x1D707}}}{p}\langle \unicode[STIX]{x0394}p_{L}^{1}\rangle ,\\ \langle \unicode[STIX]{x0394}p^{\unicode[STIX]{x1D707}}\unicode[STIX]{x0394}p^{\unicode[STIX]{x1D708}}\rangle _{\text{e}j}\ & =\ & (\boldsymbol{e}^{\unicode[STIX]{x1D707}}\boldsymbol{\cdot }\boldsymbol{e}_{L,\unicode[STIX]{x1D70C}})(\boldsymbol{e}^{\unicode[STIX]{x1D708}}\boldsymbol{\cdot }\boldsymbol{e}_{L,\unicode[STIX]{x1D70E}})\unicode[STIX]{x0394}u_{L}^{\unicode[STIX]{x1D70C}}\unicode[STIX]{x0394}u_{L}^{l}\\ \ & =\ & \displaystyle \left[\unicode[STIX]{x1D6FF}^{\unicode[STIX]{x1D707}\unicode[STIX]{x1D708}}-\frac{p^{\unicode[STIX]{x1D707}}p^{\unicode[STIX]{x1D708}}}{p^{2}}\right]\langle \unicode[STIX]{x0394}p_{L}^{2}\unicode[STIX]{x0394}p_{L}^{2}\rangle .\end{array}\right\}\end{eqnarray}$$
We now wish to convert the expressions (A 1) into the coordinate basis
 $\{p,\unicode[STIX]{x1D703},\unicode[STIX]{x1D719}\}$
. In this system, the three-dimensional metric is
 $$\begin{eqnarray}g_{\unicode[STIX]{x1D707}\unicode[STIX]{x1D708}}=\left(\begin{array}{@{}ccc@{}}1 & 0 & 0\\ 0 & p^{2} & 0\\ 0 & 0 & p^{2}\sin ^{2}\unicode[STIX]{x1D703}\end{array}\right).\end{eqnarray}$$
Note that to convert the expressions in (A 1) from a normalized basis into a coordinate basis, any contravector
 $V^{\unicode[STIX]{x1D707}}$
must be multiplied by a factor of the square root of the inverse metric: ‘
 $\sqrt{g^{\unicode[STIX]{x1D707}\unicode[STIX]{x1D707}}}$
’
 $=$
 $[1,1/p,1/(p\sin \unicode[STIX]{x1D703})]^{\unicode[STIX]{x1D707}}$
and similarly for tensors. In covariant notation, the divergence can be written elegantly as
 $$\begin{eqnarray}\unicode[STIX]{x1D735}_{\unicode[STIX]{x1D707}}V^{\unicode[STIX]{x1D707}}=\frac{1}{\sqrt{g}}\unicode[STIX]{x2202}_{\unicode[STIX]{x1D707}}(\sqrt{g}V^{\unicode[STIX]{x1D707}}),\end{eqnarray}$$
where
 $\sqrt{g}=\sqrt{|\text{det}(g_{\unicode[STIX]{x1D707}\unicode[STIX]{x1D708}})|}=p^{2}\sin \unicode[STIX]{x1D703}$
, while the second-order differential operator in the Fokker–Planck terms requires Christoffel symbols
 $\unicode[STIX]{x1D6E4}_{\unicode[STIX]{x1D707}\unicode[STIX]{x1D708}}^{\unicode[STIX]{x1D70C}}=(1/2)g^{\unicode[STIX]{x1D70C}\unicode[STIX]{x1D70E}}(\unicode[STIX]{x2202}_{\unicode[STIX]{x1D708}}g_{\unicode[STIX]{x1D70E}\unicode[STIX]{x1D707}}+\unicode[STIX]{x2202}_{\unicode[STIX]{x1D707}}g_{\unicode[STIX]{x1D70E}\unicode[STIX]{x1D708}}-\unicode[STIX]{x2202}_{\unicode[STIX]{x1D70E}}g_{\unicode[STIX]{x1D707}\unicode[STIX]{x1D708}})$
, according to
 $$\begin{eqnarray}\unicode[STIX]{x1D735}_{\unicode[STIX]{x1D708}}T^{\unicode[STIX]{x1D707}\unicode[STIX]{x1D708}}=\unicode[STIX]{x2202}_{\unicode[STIX]{x1D708}}T^{\unicode[STIX]{x1D707}\unicode[STIX]{x1D708}}+\unicode[STIX]{x1D6E4}_{\unicode[STIX]{x1D708}\unicode[STIX]{x1D70C}}^{\unicode[STIX]{x1D707}}T^{\unicode[STIX]{x1D70C}\unicode[STIX]{x1D708}}+\unicode[STIX]{x1D6E4}_{\unicode[STIX]{x1D708}\unicode[STIX]{x1D70C}}^{\unicode[STIX]{x1D708}}T^{\unicode[STIX]{x1D707}\unicode[STIX]{x1D70C}}.\end{eqnarray}$$
Thus,
 $$\begin{eqnarray}\displaystyle & \displaystyle C^{\text{e}j}=\frac{1}{\sqrt{g}}\unicode[STIX]{x2202}_{\unicode[STIX]{x1D707}}(\sqrt{g}V^{\unicode[STIX]{x1D707}}), & \displaystyle\end{eqnarray}$$
 $$\begin{eqnarray}\displaystyle & V^{\unicode[STIX]{x1D707}}=-f_{\text{e}}\langle \unicode[STIX]{x0394}p^{\unicode[STIX]{x1D707}}\rangle _{\text{e}j}+{\textstyle \frac{1}{2}}[\unicode[STIX]{x2202}_{\unicode[STIX]{x1D708}}(f_{\text{e}}\langle \unicode[STIX]{x0394}p^{\unicode[STIX]{x1D707}}\unicode[STIX]{x0394}p^{\unicode[STIX]{x1D708}}\rangle _{\text{e}j})+\unicode[STIX]{x1D6E4}_{\unicode[STIX]{x1D708}\unicode[STIX]{x1D70C}}^{\unicode[STIX]{x1D707}}(f_{\text{e}}\langle \unicode[STIX]{x0394}p^{\unicode[STIX]{x1D70C}}\unicode[STIX]{x0394}p^{\unicode[STIX]{x1D708}}\rangle _{\text{e}j})+\unicode[STIX]{x1D6E4}_{\unicode[STIX]{x1D708}\unicode[STIX]{x1D70C}}^{\unicode[STIX]{x1D708}}f_{\text{e}}\langle \unicode[STIX]{x0394}p^{\unicode[STIX]{x1D707}}\unicode[STIX]{x0394}p^{\unicode[STIX]{x1D70C}}\rangle _{\text{e}j}], & \displaystyle \nonumber\\ \displaystyle & & \displaystyle\end{eqnarray}$$
and
 $\unicode[STIX]{x1D6E4}_{\unicode[STIX]{x1D707}\unicode[STIX]{x1D708}}^{\unicode[STIX]{x1D70C}}$
has the following non-zero components:
 $$\begin{eqnarray}\unicode[STIX]{x1D6E4}_{22}^{1}=-p,\quad \unicode[STIX]{x1D6E4}_{33}^{1}=-p\sin ^{2}\unicode[STIX]{x1D703},\end{eqnarray}$$
 $$\begin{eqnarray}\unicode[STIX]{x1D6E4}_{21}^{2}=1/p,\quad \unicode[STIX]{x1D6E4}_{33}^{2}=-\cos \unicode[STIX]{x1D703}\sin \unicode[STIX]{x1D703},\end{eqnarray}$$
 $$\begin{eqnarray}\unicode[STIX]{x1D6E4}_{31}^{3}=1/p,\quad \unicode[STIX]{x1D6E4}_{32}^{3}=\cot \unicode[STIX]{x1D703}.\end{eqnarray}$$
This yields
 $$\begin{eqnarray}\displaystyle & \displaystyle V^{1}=-\left[\langle \unicode[STIX]{x0394}p_{L}^{1}\rangle _{\text{e}j}+\frac{1}{p}\langle \unicode[STIX]{x0394}p_{L}^{2}\unicode[STIX]{x0394}p_{L}^{2}\rangle _{\text{e}j}\right]f_{\text{e}}=0, & \displaystyle\end{eqnarray}$$
 $$\begin{eqnarray}\displaystyle & \displaystyle V^{2}=\frac{1}{2p^{2}}\langle \unicode[STIX]{x0394}p_{L}^{2}\unicode[STIX]{x0394}p_{L}^{2}\rangle _{\text{e}j}\unicode[STIX]{x2202}_{\unicode[STIX]{x1D703}}\,f_{\text{e}}, & \displaystyle\end{eqnarray}$$
 $$\begin{eqnarray}\displaystyle & \displaystyle V^{3}=\frac{1}{2p^{2}\sin ^{2}\unicode[STIX]{x1D703}}\langle \unicode[STIX]{x0394}p_{L}^{2}\unicode[STIX]{x0394}p_{L}^{2}\rangle _{\text{e}j}\unicode[STIX]{x2202}_{\unicode[STIX]{x1D719}}\,f_{\text{e}}. & \displaystyle\end{eqnarray}$$
Appendix B. General properties of the screening function: high-energy behaviour
Utilizing the fact that
 $F_{j}(q)\rightarrow 0$
for
 $q\gg 1$
and
 $F_{j}(q)\rightarrow N_{\text{e},j}$
for
 $q\ll 1$
, we can find a closed expression for
 $g_{j}(p)$
in the limit of large
 $y=2p/\unicode[STIX]{x1D6FC}=q/x$
which is then valid from mildly relativistic energies (if the transition from complete screening to full screening in the form factor is located around
 $y\sim 1\Leftrightarrow p\sim 10^{-2}$
). The screening function is defined as
 $$\begin{eqnarray}\displaystyle g_{j}(p) & = & \displaystyle \int _{1/\unicode[STIX]{x1D6EC}}^{1}[|Z_{j}-F_{j}(q)|^{2}-Z_{0,j}^{2}]\frac{\text{d}x}{x}\nonumber\\ \displaystyle & {\approx} & \displaystyle \lim _{\unicode[STIX]{x1D6EC}\rightarrow \infty }\int _{y/\unicode[STIX]{x1D6EC}}^{y}\{2Z_{j}[N_{\text{e},j}-F_{j}(q)]+F_{j}^{2}(q)-N_{\text{e},j}^{2}\}\frac{\text{d}q}{q}.\end{eqnarray}$$
For simplicity, we normalize the radial coordinate to the Bohr radius
 $a_{0}$
and the density such that
 $N_{\text{e},j}=4\unicode[STIX]{x03C0}\int r^{2}\unicode[STIX]{x1D70C}_{\text{e},j}(r)\,\text{d}r$
. The form factor (for a spherically averaged charge distribution) is then determined by
 $$\begin{eqnarray}F_{j}(q)=4\unicode[STIX]{x03C0}\int _{0}^{\infty }\unicode[STIX]{x1D70C}_{\text{e},j}(r)\frac{r}{q}\sin (qr)\,\text{d}r.\end{eqnarray}$$
The first term of (B 1) can be simplified using partial integration, and extending the remaining integral to infinity:
 $$\begin{eqnarray}\displaystyle I_{1,j} & \equiv & \displaystyle 2Z_{j}\int _{y/\unicode[STIX]{x1D6EC}}^{y}[N_{\text{e},j}-F_{j}(q)]\frac{\text{d}q}{q}\nonumber\\ \displaystyle & = & \displaystyle 2Z_{j}\left([\ln q[N_{\text{e},j}-F_{j}(q)]]_{y/\unicode[STIX]{x1D6EC}}^{y}-\int _{0}^{\infty }\ln qF_{j}^{\prime }(q)\,\text{d}q\right).\end{eqnarray}$$
Note that if the atom has a spherically symmetric potential, the mean dipole moment (
 $\propto \int \text{d}^{3}r\boldsymbol{r}n(\boldsymbol{r})$
) vanishes (Landau & Lifshitz Reference Landau and Lifshitz1958), in which case the first derivative of the form factor vanishes identically for small arguments. Utilizing this fact for
 $F(y/\unicode[STIX]{x1D6EC}\ll 1)=N_{\text{e},j}$
and
 $F_{j}(y\gg 1)=0$
, we obtain
 $$\begin{eqnarray}\displaystyle I_{1,j} & = & \displaystyle 2Z_{j}N_{\text{e},j}\ln y+8Z_{j}\unicode[STIX]{x03C0}\int _{0}^{\infty }\unicode[STIX]{x1D70C}_{\text{e},j}(r)r^{2}\,\text{d}r\underbrace{\int _{0}^{\infty }\frac{\ln q}{q}\left(\cos (qr)-\frac{\sin (qr)}{rq}\right)\text{d}q}_{=\unicode[STIX]{x1D6FE}_{E}-1+\ln r}\nonumber\\ \displaystyle & = & \displaystyle 2Z_{j}N_{\text{e},j}(\ln y-1+\unicode[STIX]{x1D6FE}_{E}+\hat{I} _{1,j}),\end{eqnarray}$$
where we used
 $4\unicode[STIX]{x03C0}\int r^{2}\unicode[STIX]{x1D70C}_{\text{e},j}(r)\,\text{d}r=N_{\text{e},j}$
and
 $$\begin{eqnarray}\hat{I} _{1,j}\equiv \frac{4\unicode[STIX]{x03C0}}{N_{\text{e},j}}\int _{0}^{\infty }\unicode[STIX]{x1D70C}_{\text{e},j}(r)r^{2}\ln r\,\text{d}r.\end{eqnarray}$$
Similarly, for the second term,
 $$\begin{eqnarray}\displaystyle I_{2,j} & \equiv & \displaystyle \int _{1/\unicode[STIX]{x1D6EC}}^{1}\{F_{j}^{2}(q)-N_{\text{e},j}^{2}\}\frac{\text{d}x}{x}\nonumber\\ \displaystyle & = & \displaystyle [\ln q[F_{j}(q)^{2}-N_{\text{e},j}^{2}]]_{y/\unicode[STIX]{x1D6EC}}^{y}-2\int _{0}^{\infty }\ln qF_{j}(q)F_{j}^{\prime }(q)\,\text{d}q\nonumber\\ \displaystyle & = & \displaystyle -N_{\text{e},j}^{2}\ln y-(4\unicode[STIX]{x03C0})^{2}\int _{0}^{\infty }\unicode[STIX]{x1D70C}_{\text{e},j}(r)r^{2}\,\text{d}r\int _{0}^{\infty }\unicode[STIX]{x1D70C}_{\text{e},j}(r_{2})r_{2}^{2}\,\text{d}r_{2}\nonumber\\ \displaystyle & & \displaystyle \times \int _{0}^{\infty }2\frac{\ln q}{q}\frac{\sin (qr_{2})}{qr_{2}}\left(\cos (qr)-\frac{\sin (qr)}{qr}\right)\nonumber\\ \displaystyle & = & \displaystyle -N_{\text{e},j}^{2}\ln y-(4\unicode[STIX]{x03C0})^{2}\int _{0}^{\infty }\unicode[STIX]{x1D70C}_{\text{e},j}(r)r^{2}\,\text{d}r\int _{0}^{\infty }\unicode[STIX]{x1D70C}_{\text{e},j}(r_{2})r_{2}^{2}\,\text{d}r_{2}\nonumber\\ \displaystyle & & \displaystyle \times \left[\unicode[STIX]{x1D6FE}_{E}-\frac{3}{2}+\frac{(r+r_{2})^{2}}{4rr_{2}}\ln (r+r_{2})-\frac{(r-r_{2})^{2}}{4rr_{2}}\ln |r-r_{2}|\right.\nonumber\\ \displaystyle & & \displaystyle +\left.\frac{(r^{2}-r_{2}^{2})}{4rr_{2}}\ln \left(\frac{r+r_{2}}{|r-r_{2}|}\right)[\ln (r^{2}-r_{2}^{2})+2(\unicode[STIX]{x1D6FE}_{E}-1)]\right].\end{eqnarray}$$
In the integrand, the first term is straightforward to integrate with
 $4\unicode[STIX]{x03C0}\int r^{2}\unicode[STIX]{x1D70C}_{\text{e},j}(r)\,\text{d}r=N_{\text{e},j}$
, while the last term must vanish upon integration since it is antisymmetric in
 $r-r_{2}$
, leaving
 $$\begin{eqnarray}I_{2,j}=-N_{\text{e},j}^{2}(\ln y-{\textstyle \frac{3}{2}}+\unicode[STIX]{x1D6FE}_{E}+\hat{I} _{2,j}),\end{eqnarray}$$
where
 $$\begin{eqnarray}\displaystyle \hat{I} _{2,j} & \equiv & \displaystyle \frac{(4\unicode[STIX]{x03C0})^{2}}{4N_{\text{e},j}^{2}}\int _{0}^{\infty }\int _{0}^{\infty }\unicode[STIX]{x1D70C}_{\text{e},j}(r)r\unicode[STIX]{x1D70C}_{\text{e},j}(r_{2})r_{2}[(r+r_{2})^{2}\ln (r+r_{2})-(r-r_{2})^{2}\ln |r-r_{2}|]\,\text{d}r_{2}\,\text{d}r\nonumber\\ \displaystyle & = & \displaystyle \frac{(4\unicode[STIX]{x03C0})^{2}}{16N_{\text{e},j}^{2}}\int _{0}^{\infty }\,\text{d}s\int _{0}^{s}\,\text{d}t(s^{2}-t^{2})\unicode[STIX]{x1D70C}_{\text{e},j}\left(\frac{s+t}{2}\right)\unicode[STIX]{x1D70C}_{\text{e},j}\left(\frac{s-t}{2}\right)[s^{2}\ln s-t^{2}\ln t].\end{eqnarray}$$
Adding the terms of (B 1) together yields (using
 $2ZN_{\text{e}}-N_{\text{e}}^{2}=Z^{2}-Z_{0}^{2}$
)
 $$\begin{eqnarray}\displaystyle g_{j}(p) & = & \displaystyle I_{1,j}+I_{2,j}\nonumber\\ \displaystyle & = & \displaystyle (Z_{j}^{2}-Z_{0,j}^{2})[\ln (2p/\unicode[STIX]{x1D6FC})-1+\unicode[STIX]{x1D6FE}_{E}]+2Z_{j}N_{\text{e},j}\hat{I} _{1,j}+N_{\text{e},j}^{2}({\textstyle \frac{1}{2}}-\hat{I} _{2,j}).\end{eqnarray}$$
Hence, the screening function
 $g_{j}(p)$
grows logarithmically with momentum at high electron energies. This allows us to determine
 $a_{j}$
so that the deflection frequency exactly matches the high-energy asymptote of the DFT results. Matching (B 9) with the high-energy asymptote of
 $g_{j}(p)$
from (2.25),
 $$\begin{eqnarray}g_{j}(p)\sim (Z_{j}^{2}-Z_{0,j}^{2})\ln (p\bar{a}_{j})-{\textstyle \frac{2}{3}}N_{\text{e},j}^{2},\quad p\bar{a}_{j}\gg 1,\end{eqnarray}$$
we obtain
 $$\begin{eqnarray}\bar{a}_{j}=\frac{2}{\unicode[STIX]{x1D6FC}}\exp \left[\unicode[STIX]{x1D6FE}_{E}-1+\frac{2Z_{j}\hat{I} _{1,j}+N_{\text{e},j}(7/6-\hat{I} _{2,j})}{Z_{j}+Z_{0,j}}\right].\end{eqnarray}$$
The values of
 $\bar{a}_{j}$
are given for many of the fusion-relevant ion species in table 1, of which the constants for argon and neon are illustrated in figure 2 as a function of
 $Z_{0}$
in solid line.
Appendix C. Partially screened avalanche-dominated runaway energy spectrum
We here generalize the derivation of the high electric field, avalanche-dominated distribution by Fülöp et al. (Reference Fülöp, Pokol, Helander and Lisak2006) to account for partially ionized impurities. In Fülöp et al. (Reference Fülöp, Pokol, Helander and Lisak2006), the kinetic equation is specialized to the case where
 $E\gg E_{\text{c}}$
, which gives a narrow pitch-angle distribution where the majority of the runaway electrons populate the region
 $1-\unicode[STIX]{x1D709}\ll 1$
, which is used as an expansion parameter. Note however, that assuming fast pitch-angle dynamics (Lehtinen et al.
Reference Lehtinen, Bell and Inan1999; Aleynikov & Breizman Reference Aleynikov and Breizman2015) is invalid when
 $E\gg E_{\text{c}}^{\text{eff}}$
, where
 $E_{\text{c}}^{\text{eff}}$
is the effective critical field (Hesslow et al.
Reference Hesslow, Embréus, Wilkie, Papp and Fülöp2018).
Neglecting how the avalanche source term affects the shape of the distribution, we solve the coupled equations given by the avalanche growth rate (3.1) and the kinetic equation. In the kinetic equation, we utilize
 $E\gg E_{\text{c}}^{\text{eff}}$
to replace the friction terms by
 $E_{\text{c}}^{\text{eff}}$
in order to match the near-critical behaviour (Hesslow et al.
Reference Hesslow, Embréus, Wilkie, Papp and Fülöp2018):
 $$\begin{eqnarray}\displaystyle \unicode[STIX]{x1D70F}_{c}\frac{\unicode[STIX]{x2202}\bar{f}}{\unicode[STIX]{x2202}t} & = & \displaystyle \frac{\unicode[STIX]{x2202}}{\unicode[STIX]{x2202}p}\left[\vphantom{\frac{1}{2}}\!\right.\!\left(\vphantom{\frac{1}{2}}\!\right.\!-\frac{\unicode[STIX]{x1D709}E}{E_{\text{c}}}+\underbrace{p\unicode[STIX]{x1D708}_{\text{s}}+F_{\text{br}}+\frac{p\unicode[STIX]{x1D6FE}}{\unicode[STIX]{x1D70F}_{\text{syn}}}(1-\unicode[STIX]{x1D709}^{2})}_{{\sim}E_{\text{c}}^{\text{eff}}/E_{\text{c}}}\!\left.\!\vphantom{\frac{1}{2}}\right)\bar{f}\,\!\left.\!\vphantom{\frac{1}{2}}\right]\nonumber\\ \displaystyle & & \displaystyle +\,\frac{\unicode[STIX]{x2202}}{\unicode[STIX]{x2202}\unicode[STIX]{x1D709}}\left[\vphantom{\frac{1}{2}}\!\right.\!(1-\unicode[STIX]{x1D709}^{2})\left(\vphantom{\frac{1}{2}}\!\right.\!-\frac{1}{p}\frac{E}{E_{\text{c}}}\bar{f}+\frac{1}{2}\unicode[STIX]{x1D708}_{\text{D}}\frac{\unicode[STIX]{x2202}\bar{f}}{\unicode[STIX]{x2202}\unicode[STIX]{x1D709}}\!\left.\!\vphantom{\frac{1}{2}}\right)-\underbrace{\frac{\unicode[STIX]{x1D709}(1-\unicode[STIX]{x1D709}^{2})}{\unicode[STIX]{x1D70F}_{\text{syn}}\unicode[STIX]{x1D6FE}}}_{\text{neglect}}\bar{f}\,\!\left.\!\vphantom{\frac{1}{2}}\right].\end{eqnarray}$$
Here,
 $\bar{f}=p^{2}f$
,
 $F_{\text{br}}$
describes bremsstrahlung losses and
 $\unicode[STIX]{x1D70F}_{\text{syn}}$
is a measure of the synchrotron losses. Assuming that the distribution is narrow,
 $p_{\bot }\ll p_{\Vert }\simeq p$
, so that
 $1-\unicode[STIX]{x1D709}\ll 1$
, we integrate (C 1) over
 $\unicode[STIX]{x1D709}$
. Together with (3.1), we obtain
 $$\begin{eqnarray}\unicode[STIX]{x1D70F}_{c}\unicode[STIX]{x1D6E4}(E)F+\frac{E-E_{\text{c}}^{\text{eff}}}{E_{\text{c}}}\frac{\unicode[STIX]{x2202}F}{\unicode[STIX]{x2202}p}=0,\end{eqnarray}$$
which has the solution
 $$\begin{eqnarray}F(p,t)=n_{\text{RE}}(t)\frac{1}{p_{0}}\text{e}^{-p/p_{0}},\end{eqnarray}$$
where
 $$\begin{eqnarray}p_{0}=\frac{E-E_{\text{c}}^{\text{eff}}}{E_{\text{c}}\unicode[STIX]{x1D70F}_{c}\unicode[STIX]{x1D6E4}(E)}=\frac{e}{m_{\text{e}}c}\frac{E-E_{\text{c}}^{\text{eff}}}{\unicode[STIX]{x1D6E4}(E)}.\end{eqnarray}$$
Since
 $\unicode[STIX]{x1D6E4}\propto E-E_{\text{c}}^{\text{eff}}$
for
 $E/E_{\text{c}}^{\text{eff}}-1\ll 1$
, the term
 $E_{\text{c}}^{\text{eff}}$
ensures that
 $p_{0}<\infty$
in the limit
 $E\rightarrow E_{\text{c}}^{\text{eff}}$
. The average runaway momentum
 $p_{0}$
can alternatively be interpreted as an average energy since
 $p_{0}\gg 1$
typically. Although
 $p_{0}$
only depends on the effective charge in the fully ionized case, the average momentum acquires a significant
 $E$
-dependence in the presence of partially screened ions, as shown in figure 5.