

Introduction
Tilapia is a family of omnivorous fish that originated in Africa. They are favoured in aquaculture because of their characteristics of rapid growth, high fecundity and high stress resistance. Since being introduced to China in the 1950s, it has become the major commercial freshwater fish. However, due to the tendency for overbreeding in tilapia, high stocking densities and low yield are often problems. One of the ideal ways to overcome such problems is to increase the male offspring through intercrossing of different tilapia species. In the 1970s, researchers in Taiwan intercrossed Oreochromis mossambicus (Mozambique tilapia) females and Oreochromis niloticus (Nile tilapia) males, producing a new species, Fushou, which grows faster than both parents (Liang and Dai, 1983; Tang et al., Reference Tang, Zeng, Qi, Xu and Zhao2006). Fushou became the most important tilapia in aquaculture at the time. One decade later, more new tilapia species were produced through interbreeding, e.g. Auni was produced through the hybridization of O. aureus males and O. niloticus females; Mohe was produced through the hybridization of O. mossambicus females and O. niloticus males (Yang et al., Reference Yang, Ye, Lu, Huang and Bai2006). All these hybrid fish species are beneficial for the fish industry as they grow faster than parental species or have a higher percentage of male offspring. The parent purity and quality were found to greatly affect the male offspring ratio and culture performance (Li and Cai, Reference Li and Cai1995; Xie, Reference Xie1995). Since a majority of the hybrid tilapia are fertile and some have a similar body shape to their parents (Zhu et al., Reference Zhu, Huang, Lu and Liu2003), it is easy to mix a pure parent species with a hybrid during intercrossing and it is hard to determine the purity of a fish. Therefore, it is necessary to develop a reliable and convenient method to determine the purity of tilapia.
Detailed morphological and biochemical studies have been performed to determine the quality of tilapia. Li et al. (Reference Li, Li, Li, Wang and Zhu1999) established a morphological method to distinguish O. niloticus, O. aureus and Auni. Pan et al. (Reference Pan, Hu and Wang1993) discovered the specific isozyme and protein fingerprints of O. aureus, which distinguished it from O. niloticus and O. mossambicus. Li et al. (Reference Li, Wu and Yang2000) examined the differences of malate dehydrogenase (MDH) isozymes within and among the species of O. aureus and O. niloticus, and discovered genetic markers for their identification. However, all methods have their pitfalls. The morphological method tends to be affected by environmental changes. Tilapia of the same genotype could display a different morphology when grown in different environments; while tilapia with the same morphology could be from different genotypes. Isozymes are the translated genetic products, instead of the gene itself. Additionally, the isozyme methods could only detect a few loci of the gene, which made it impossible to identify genotypes with close or complicated genetic relationships. Finally, none of these methods could accurately determine the degree of introgression between parents and hybrid offspring.
In recent years, molecular markers have emerged as accurate means to identify species based on genetic differences. Microsatellite markers, also known as simple sequence repeats (SSR), have demonstrated great significance in applications such as seed quality determination and genetic purity analysis. Li et al. (Reference Li, Li, Li, Wang and Zhu2001) have successfully utilized microsatellite DNA to differentiate eight inbreeding rat groups. Liu et al. (Reference Liu, Bai and Li2007) analysed 49 loci of microsatellites in swordfish RR-B and non-breeding populations, and discovered seven microsatellite markers that could distinguish the two. In this study, we screened 77 possible tilapia microsatellite markers and identified markers that are specific to O. niloticus, O. aureus and O. mossambicus. The collected data provide a solid technical foundation for tilapia species identification using molecular approaches.
Materials and methods
Experimental fish
O. aureus (110 total) were obtained from Pearl River Fisheries Research Institute (Gaoyao, Guangdong, China) (60 fish), Guangdong National Tilapia Seed Farm (Panyu, Guangdong, China) (20 fish) and Xiamen Luye National Tilapia Seed Farm (Luye, Fujian, China) (30 fish). O. niloticus (80 total) were also purchased from the above three locations, with the numbers from Gaoyao, Panyu and Luye being 30, 20 and 30 respectively. O. mossambicus (30) were all obtained from Pearl River Fisheries Research Institute in Gaoyao.
Synthesis of microsatellite primers
Based on the data published by the Hubbard Center for Genome Studies (University of New Hampshire, USA; http://hcgs.unh.edu) and by Carleton et al. (Reference Carleton, Streelman, Lee, Garnhart, Kidd and Kocher2002), 77 microsatellite loci were selected from O. niloticus species. These loci were: UNH968, UNH919, UNH971, UNH211, UNH990, UNH932, UNH178, UNH222, UNH856, UNH899, UNH853, UNH980, UNH214, UNH190, UNH933, UNH906, UNH988, UNH876, UNH874, UNH855, UNH878, UNH106, UNH 911, UNH880, UNH999, UNH208, UNH954, UNH989, UNH1004, UNH998, UNH159, UNH197, UNH176, UNH1009, UNH201, UNH773, UNH997, UNH927, UNH901, UNH974, UNH914, UNH985, UNH166, GM354, UNH 231, UNH913, GM636, UNH958, UNH908, UNH879, UNH940, UNH719, GM633, GM566, GM558, GM677, GM117, GM509, UNH213, GM041, UNH909, UNH957, GM024, UNH183, UNH868, UNH104, UNH995, UNH907, UNH898, UNH860, UNH848, UNH846, UNH172, UNH890, UNH896, UNH982 and UNH216. Primers were designed for each locus and synthesized by Shanghai Bioengineering Technology Company Ltd (Shanghai, China).
Preparation of tilapia genomic DNA
Blood was drawn using a syringe from the tail vein of each fish. Acid citrate dextrase anticoagulant was then added to the blood sample with a ratio of 6:1 and followed the protocols in Sambrook and Russell (Reference Sambrook and Russell2002). Whole blood genomic DNA was extracted from fresh blood samples according to kit protocols from the manufacturer (Tianwei Co. Ltd, China) and dissolved in deionized distilled water. The integrity and purity of the DNA samples were examined on a 0.8% agarose gel by electrophoresis. DNA concentrations were determined with a UV spectrophotometer. All DNA samples were stored at 4°C until use.
PCR amplification and gel electrophoresis
Polymerase chain reactions (PCR) were performed in a total volume of 20 μl, containing 10×buffer (2.0 μl), MgCl2 (25 mmol/l, 0. 8–1.0 μl), dNTPs (10 mmol/l, 0.3 μl), forward and reverse primers (20 pmol/l, 0.5 μl each), Taq polymerase (1 unit), template DNA (~60 ng) and an appropriate amount of PCR-grade water. The reaction conditions were heat activation at 94°C for 4 min, followed by 25 cycles of denaturation at 94°C for 30 s, annealing at 45–60°C for 30 s, elongation at 72°C for 30 s and a final elongation at 72°C for 7 min. The amplified PCR product was electrophoresed on an 80 mg/ml (8%) non-denaturing polyacrylamide gel. Each lane was loaded with 3 μl of the product and 1 μl of loading dye. After electrophoresis, the gel was stained with silver nitrate following a modified protocol developed by Huo et al. (Reference Huo, Zeng and Pan2005).
Preliminary selection of microsatellite loci
The genomic DNA of 40 O. aureus (20 from Gaoyao, 10 from Panyu and 10 from Luye), 30 O. niloticus (10 from each of the three locations) and 10 O. mossambicus tilapias were used as templates for screening of genotype-specific microsatellite primers. The primer sets that produced bright, repeatable and characteristic band patterns were finally selected as microsatellite markers for identification of the three tilapia species.
Data analysis and statistics
Genotype of the fish was determined based on the band patterns produced by microsatellite PCR. Size of the microsatellite band was measured with the Alpha Ease FC software (Alphainnotech Corporation, San Leandro, Canada). The number of alleles (E) at each microsatellite locus, the allele frequency (P) and gene heterozygocity (H) were analyzed with the POPGEN32 program (University of Alberta, Edmonton, Alberta, Canada). Polymorphism information content (PIC) of each microsatellite locus was calculated based on the equation published by Botstein et al. (Reference Botstein, White and Skolnick1980) :

P i and P j represent the frequency of the ith and jth alleles in the population, respectively; n represents the number of alleles.
The genetic similarity index and genetic distance between two different populations were calculated by the unweighted pair group method using arithmetic average (UPGMA) (Quan et al., Reference Quan, Sun and Liang2005). Based on these data, a phylogenetic tree representing eight populations of the three tilapia species was built.
Results and analysis
Screening of microsatellite loci
Seventy-seven microsatellite loci primer sets were initially tested on the genomic DNA from 80 individual fish. In O. aureus, 32 loci demonstrated polymorphism; in O. niloticus, all showed polymorphism; in O. mossambicus, 43 loci exhibited polymorphism and there was a pair of missing loci. A total of 563 alleles were found from the 77 studied loci. On average, each locus contained 7.31 alleles with a size of 98–338 bp. Figure 1 shows a representative PCR amplification result from this study.
PCR amplification results of locus UNH223 in three tilapia species. Lanes: 1–4, Oreochromis aureus from Gaoyao, China; 5–14, Mozambique tilapias from Gaoyao; 15–24, Nile tilapias from Gaoyao; 25–34, Nile tilapias from Panyu, China; 35–44, Nile tilapias from Luye, China; M, simple sequence repeats marker II (Dingguo Inc., Beijing, China). (See online for a colour version of this figure.)

Identification of three tilapia genotypes
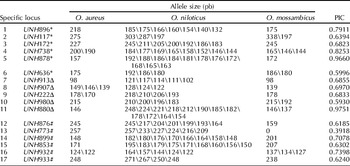
From the screening of 77 microsatellite loci in O. aureus, O. niloticus and O. mossambicus, 17 loci were found to contain special fingerprint band patterns for different species. PCR analysis of the 220 fish samples using primers for these 17 loci revealed that O. aureus has specific loci at UNH636, UNH117, UNH172, UNH878, UNH738 and UNH896; O. niloticus has specific loci at UNH913, UNH907, UNH222, UNH980 and UNH880; and O. mossambicus has specific loci at UNH876, UNH773, UNH899, UNH853, UNH932 and UNH933. Detailed results are summarized in Table 1.
Signature microsatellite loci, the size of alleles and their polymorphism information content (PIC) in three tilapia genotypes

* Loci containing O. aureus specific alleles (1–6); Δ, loci containing O. niloticus specific alleles (7–11); #, loci containing O. mossambicus specific alleles (12–17).
As shown in Table 1, eight bands were amplified for the UNH896 locus in O. aureus, O. niloticus and O. mossambicus (218 bp, 185 bp, 175 bp, 166 bp, 160 bp, 154 bp, 140 bp and 132 bp). Among these bands, the one at 175 bp was found in both O. mossambicus and O. niloticus, while the band at 218 bp was specific to O. aureus. Therefore, the marker at UNH896 locus could clearly distinguish O. aureus from the other two tilapia species. The PCR gel electrophoresis result of this locus is shown in Fig. 2, with an arrow pointing to the band specific to O. aureus.
Signature PCR amplification band patterns of Oreochromis aureus in locus UNH896. Lanes: 1–10, Oreochromis aureus from Gaoyao, China; 11–20, O. mossambicus from Gaoyao; 21–30, O. niloticus from Gaoyao; 31–40, O. niloticus from Panyu, China; 41–50, O. niloticus from Luye, China; M, SSR marker II (Dingguo Inc., Beijing, China). (See online for a colour version of this figure.)

Similarly, both O. niloticus and O. mossambicus have characteristic bands on specific loci. By utilizing the combination of these specific band patterns on different loci, e.g., the combination of one locus from each of the three species' specific loci (UNH896, UNH913 and UNH876), it is easy to completely differentiate the three tilapia species.
Genetic structure of the three tilapia species
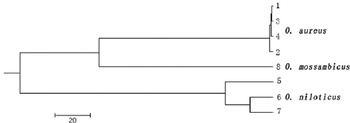
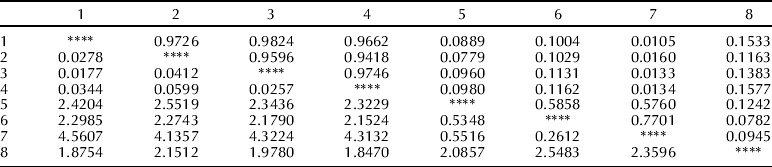
Polymorphism analysis was performed utilizing the 17 selected primer sets in a total population of 220 fish. The number of alleles detected in the three tilapia species, the observed mean heterozygosity, the expected mean heterozygosity and the average polymorphism information content, calculated using the equation described earlier, are summarized in Table 2. Data also showed that Oreochromis aureus and O. mossambicus had the highest genetic similarity, followed by O. mossambicus and O. niloticus, and O. niloticus and O. aureus (Table 2 and Table 3). Therefore, it is predicted that O. aureus and O. mossambicus are evolutionarily closer. The cluster graph plotted using the MEGA4 program (University of Alberta, Edmonton, Alberta, Canada) demonstrated that O. aureus and O. mossambicus are closely related, while O. niloticus has its own branch (Fig. 3). These data are in agreement with the genetic similarity result.
Cluster analysis of the eight populations of three tilapia genotypes based on Nei's unweighted pair-group method with arithmetic mean (UPGMA).

Statistical summary of allele number, heterozygosity and polymorphism information content (PIC) of 17 microsatellite markers in three tilapia species

Genetic distance (lower-left triangle) and genetic similarity index (upper-right triangle) among the eight populations of three tilapia species
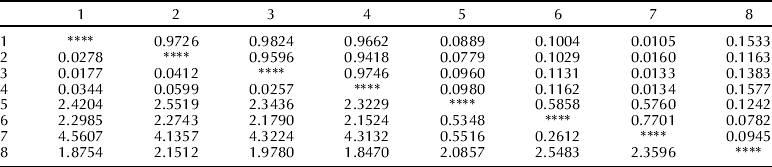
1, O. aureus (No. 83) from Gaoyao, China; 2. O. aureus (No. 02) from Gaoyao; 3, O. aureus from Panyu, China; 4, O. aureus from Luye, China; 5, O. niloticus from Luye; 6, O. niloticus from Gaoyao; 7, O. niloticus from Panyu; 8, O. mossambicus from Gaoyao.
Discussion
Identification of the three tilapia species using microsatellite loci
With the advancement of molecular biology, molecular markers have provided direct unbiased detection tools for identification of fish genotypes at the gene level. Among these markers, microsatellite marking has demonstrated great repeatability, stability, codominance and high polymorphism to effectively detect the differences between species and within species (Zhang et al., Reference Zhang, Yang, Chen, Yan, Luo and Zhang2005). In this study, 17 specific microsatellite loci were selected after screening to identify three tilapia species (O. aureus, O. niloticus and O. mossambicus). Primer sets targeting each of the 17 loci could amplify specific bands for one tilapia, but not the other two. With combined analysis of just a few loci, we can easily and accurately differentiate the three species. This approach also applies to the identification of parent and hybrid fish in tilapia culturing. In any of the codominant microsatellite loci, one allele of the offspring was obtained from the father and the other from the mother. This simple genetic mode made it possible for identification of fish genetic relationships. If two parents have identical alleles, however, it is impossible to accurately determine the root of one specific allele of the offspring. On the other hand, once we identify a specific microsatellite marker, i.e. a locus that does not contain identical alleles in both the parents, it becomes easy to accurately distinguish the parental and the hybrid populations. In this study, the 17 selected loci of tilapia each contained species-specific patterns. Since hybrid offspring demonstrated a combination of paternal and maternal band patterns due to the codominance of microsatellite markers, it was possible to directly differentiate the cross-bred offspring and the parents based on their genotypes. This research will lay a solid foundation for tilapia quality and purity screening in aquaculture.
Genetic structure analysis of the three tilapia species
The polymorphic levels of the microsatellite loci can be evaluated by a polymorphism information index (PIC). A locus with a PIC>0.5 is normally considered to have high polymorphism; a locus with 0.25<PIC<0.5 is considered to have medium polymorphism; and a locus with PIC<0.25 is deemed as a low polymorphic locus (Zhan et al., Reference Zhan, Bao, Lu, Wang and Hu2006). Heterozygosity level reflects the genetic mutations of a population on multiple alleles, and it is the best parameter for evaluating genetic mutations (Li et al., Reference Li, Sun, Yang, Chang and Yang2006). A population with high heterozygosity can better adapt to changes of environment, therefore benefiting the stability and continuation of the species. In this study, genetic structure analysis based on the 17 selected microsatellite loci in O. aureus, O. niloticus and O. mossambicus revealed that the PICs of the three species were 0.0869, 0.7149 and 0.1643, respectively. Data clearly showed that both O. aureus and O. mossambicus populations are of low polymorphism with limited genetic information, suggesting that this method, in itself, is not sufficient enough for analysis of genetic structures of these two tilapia species. Since these 17 loci were selected for differentiation of the three tilapia species, based upon whether the locus contained species-specific band patterns rather than the levels of polymorphism, they cannot fully represent polymorphism of these three tilapia strains. However, it is interesting to note that O. niloticus showed significantly higher levels of polymorphism on the same loci when compared with the other two. O. niloticus has been imported to China many times, therefore, leading to a relatively larger population of different baseline genotypes. Data in this study showed that the average observed heterozygosities of O. niloticus from Gaoyao, Luye and Panyu were 0.5647, 0.5529 and 0.5294, respectively, while the average expected values were 0.6808, 0.6632 and 0.6180, respectively. Genetic parameters, such as the number of alleles, heterozygosity and polymorphism information content, suggested that the genetic diversity of O. niloticus was generally high in China. The cluster analysis indicated that O. aureus and O. mossambicus were genetically close, while they were relatively far from O. niloticus, in agreement with the genetic relationship findings from the random amplified polymorphic DNA (RAPD) analysis in the same three tilapia species by Bardakci and Skibinski (Reference Bardakci and Skibinski1994).
Acknowledgements
This research was supported by grants from the ‘948 Project’ of the Chinese Agriculture Ministry (2006-G55), National Science and Technology Pillar Program (2006BAD01 A1201), National Science and Technology Infrastructure Fund (2005DKA21103), Guangdong Province Science and Technology Plan Project (2006B20201057) and the Agriculture Ministry Public-Welfare Industrial Research Special Program (No. 3-49).