Implications
Having insufficient feed to meet livestock demands (i.e. a feed gap) is a critical factor that can limit productivity and induce land degradation in forage-dependent livestock systems in variable production environments. Our results show that livestock farms relying on only one forage source are prone to higher risk of feed gaps; using a wider range of forages can greatly reduce the frequency and size of feed gaps and thus allow farms to safely carry more livestock per unit of land.
Introduction
Year-to-year variability and seasonality in forage supply is a major challenge for rain-fed livestock production systems because it causes a mismatch between forage supply and animal feed demand (Moore et al., Reference Moore, Bell and Revell2009). This induces inefficiencies in production due to excess feed that is wasted or to unmet feed demand that reduces livestock production. In many cases, livestock managers adopt conservative stocking rates (SR) to ensure the risk of feed gaps (i.e. when feed demand exceeds feed supply) and the associated costs (e.g. supplementary feeding) remain low (Hall et al., Reference Hall, Knight, Coble, Baquet and Patrick2003; Moore et al., Reference Moore, Bell and Revell2009). Feeding with grain concentrates and/or conserved forage is an expensive and time-consuming option to overcome deficits in on-farm forage supply. In intensive dryland livestock systems (e.g. dairy) farm feed systems that maximise consumption of farm-grown forage are those that maximise operating profit (Chapman et al., Reference Chapman, Kenny, Beca and Johnson2008). Hence, strategies and tactics that can be employed by farmers to provide feed at times when forage quantity and quality are low can enable better utilisation of their forage resources and reduce risk and costs of production (Moore et al., Reference Moore, Bell and Revell2009).
Although the capacity to make large interventions in the feedbase is limited in extensive low-intensity livestock systems (e.g. rangeland grazing), there are a range of opportunities to sustainably intensify production in mixed crop-livestock systems (Herrero et al., Reference Herrero, Thornton, Notenbaert, Wood, Msangi, Freeman, Bossio, Dixon, Peters, van de Steeg, Lynam, Parthasarathy Rao, Macmillan, Gerard, McDermott, Seré and Rosegrant2010). Rain-fed mixed crop-livestock systems produce nearly half of the world’s beef, a third of its sheep-meat and half of its milk (Steinfeld et al., Reference Steinfeld, Gerber, Wassenaar, Castel, Rosales and de Haan2006). In these systems a variety of forage sources can contribute to the farm feedbase, including sown pastures, crop residues, forage crops, dual-purpose crops and shrub-based pastures. Hence, the opportunity exists to use complementary forage sources which provide forage at different periods of the year to design a farm feedbase that improves continuity of feed supply and resilience against climate variability (Martin and Magne, Reference Martin and Magne2015). However, it is difficult for livestock producers to strategically design their feed systems to achieve this target and also explore how their livestock enterprise could be modified to capitalise on this improved forage supply.
Modelling approaches have often been used to examine interactions between different forage management options and livestock production (Gouttenoire et al., Reference Gouttenoire, Cournut and Ingrand2011). Many have used static approaches involving average or representative forage supply curves over an annual cycle (e.g. Monjardino et al., Reference Monjardino, Revell and Pannell2010; Martin et al., Reference Martin, Felten and Duru2011), but these do not capture the influence of climate variability on feed supply. Alternatively complex dynamic simulation models capture the interactions of livestock and forage feed supply over time (e.g. GRAZPLAN, Moore et al., Reference Moore1997), but these are highly complex, require a large amount of input information, and so are difficult to specify to explore large numbers of feed-base combinations. There is a need for approaches to feedbase analysis of intermediate complexity that are easy to specify, but can integrate forage inputs from a range of potential elements of the feedbase with the demand of the whole livestock enterprise (Bell et al., Reference Bell, Dove, McDonald and Kirkegaard2008; Martin et al., Reference Martin, Felten and Duru2011). This can then draw upon a range of available simulation models to predict long-term variability in forage production from many of the key feed-base elements contributing to the feedbase.
This paper demonstrates a simple approach that can be used to estimate the whole-farm balance of forage supply and demand where a variety of forages might be used, or livestock classes are present, and enable strategic changes to these to be explored over a range of climate conditions. We achieved the desired simplicity by first, focussing only on the supply of, and demand for, energy; and second, by pre-computing and summarising simulations that predict long-term variability in forage production from key feedbase elements contributing to the farms forage energy supply. We have then used our approach to explore how utilising a diversity of common feed sources impacts on the timing, likelihood and severity of feed gaps across a diversity of mixed crop-livestock farming contexts in Australia which vary in their environmental conditions and production systems. The analysis focusses on improving on-farm forage supply with the target of reducing the reliance on feeding of grain or conserved forages to fill these feed gaps which often comes at greater cost.
Material and methods
Estimates of whole-farm feed balance
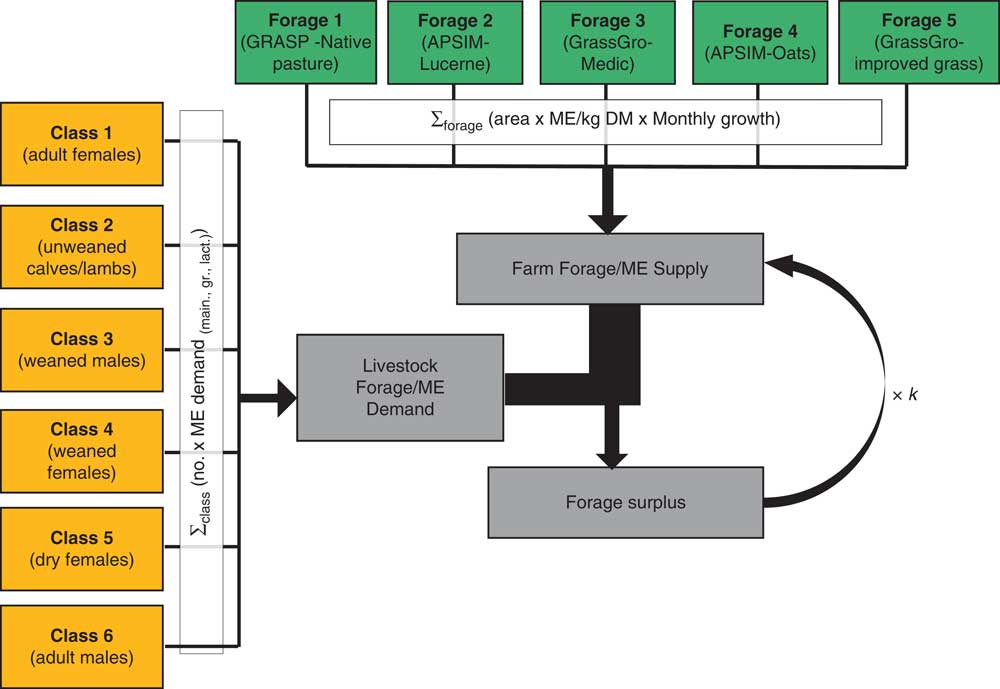
A spreadsheet analysis tool (the Farm Feedbase Risk Calculator) was developed to compare estimates of whole-farm forage supply and livestock demand over a wide range of seasonal conditions. This tool is not intended to be predictive of animal performance or farm productivity but simply used to compute the frequency, timing and size of feed gaps with different combinations of forage sources and livestock enterprise. This tool used a database of long-term (1957–2010) simulated monthly production and quality of the most commonly used forage sources at each location that was derived from a combination of well validated forage and pasture simulation models in APSIM (Holzworth et al., Reference Holzworth, Huth, deVoil, Zurcher, Herrmann, McLean, Chenu, van Oosterom, Snow, Murphy, Moore, Brown, Whish, Verrall, Fainges, Bell, Peake, Poulton, Hochman, Thorburn, Gaydon, Dalgliesh, Rodriguez, Cox, Chapman, Doherty, Teixeira, Sharp, Cichota, Vogeler, Li, Wang, Hammer, Robertson, Dimes, Carberry, Hargreaves, MacLeod, McDonald, Harsdorf, Wedgwood and Keating2014), GrassGro (Moore et al., Reference Moore1997) and GRASP (McKeon et al., Reference McKeon, Day, Howden, Mott, Orr, Scattini and Weston1990). Whole-farm feedbases derived from combinations of the livestock-available energy supply from these various forages were then compared against the monthly feed demand for typical livestock enterprises in each district on a metabolisable energy (ME) basis (Figure 1). Protein and other nutrients were not included to keep the approach simple and focus on the main nutritional limitation of livestock system productivity in the target regions. Monthly livestock demands were calculated based on widely used calculations of animal energy requirements for each class of stock accounting for annual growth, lactation and pregnancy cycles for the livestock system and forage quality (Freer et al., Reference Freer, Moore and Donnelly1997) . Hence, by comparing these two, the surplus or deficit of feed grown on the whole farm supporting a range of feed sources could be estimated on a monthly basis. To account for carry-over of feed from one month to the next, any monthly surplus forage was carried forward to the subsequent month. To account for senescence, detachment and breakdown of forage biomass over time we assumed a constant proportion (k) of any monthly forage surplus was transferred to the next month. To avoid the need to track multiple forage pools through time, any forage carried forward was assumed to have the same forage quality as the weighted whole-farm average in that month (annual changes in quality of forages were captured). Because feed balance was not calculated for each feedbase component individually but on a whole-farm basis, utilisation of forages was assumed to be proportional to their relative contribution to farm forage supply in a given month, except that sources with a limited period of availability would be utilised first. For example, forage options only available for a particular period would be preferentially used as they became available, leaving other forage sources to carry-over into later months.
(colour online) Diagrammatical representation of the inputs and calculations required to compute the monthly farm forage and metabolisable energy (ME) balance integrating farm forage supply from multiple simulated forage sources and forage/ME demand from the whole livestock enterprise including diverse animal classes. k =carry-over rate of surplus forage from one month to the next; assumed to be 0.66 here; DM=dry matter.

Feed gaps were quantified using two complementary statistics. The likelihood of short-term feed gaps was assessed using the frequency of months (presented as a proportion, 0.0 to 1.0) when growth of fresh feed was less than livestock demand, that is there was a monthly deficit in fresh feed supply. This statistic indicates periods when fresh high quality forage is unavailable and when carry-over forage with lower or reduced nutritive value will be needed. The prevalence of longer-term feed gaps was assessed by computing the frequency of periods when the farm feed balance was negative (presented as a proportion, 0.0 to 1.0), that is months when there was insufficient forage available, including that carried forward from previous months, to meet livestock demand for that month. This statistic indicates periods when supplementary feeding or reductions in stock numbers would be necessary to avoid losses in livestock condition and/or risks of land degradation due to high forage utilisation and low ground cover.
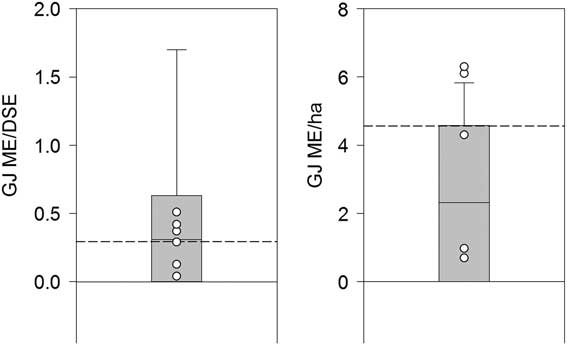
Our calculations rely on the accuracy of predictions of forage supply or demand from widely tested component models. It is very rare, and difficult, to obtain longitudinal farm data with sufficient detail that could be used to test the validity of our approach against real farms over time. However, to demonstrate the sensibility of these predictions, data on supplementary feed provision across a collective group of farms from the Livestock Farm Monitoring Project in south-west Victoria (www.agriculture.vic.gov.au/livestock/farm-monitor-project) were compared against long-term predictions of farm deficits for a simulated location in this region (i.e. Hamilton). This showed that long-term predictions of farm feed deficits corresponded well with supplementary feed used per animal unit over several different seasonal years (Figure 2). There was some tendency for higher use of supplementary feed per farm ha than was estimated; this is expected as the forage simulations were designed to approximate production under best management practice, whereas this is unlikely to be achieved on-farm.
Long-term (50 years) predicted farm feed deficits (GJ metabolisable energy (ME) per dry sheep equivalent (DSE) and GJ ME/ha) at Hamilton, Victoria (indicated by box plots) compared with the average supplementary feed used across a sample of prime-lamb producing farms in the south-west region of Victoria (n 16 to 27) over six seperately reported years (2009, 2010, 2012–2015) (indicated by points, and 6-year average by the dotted line). Supplementary feed reported as used on each farm was converted into metabolisable energy (hay and silage – 9.5 MJ ME/kg, cereal grains – 13.0 MJ ME/kg).

Estimates of livestock enterprise demand
Monthly ME requirements for maintenance, pregnancy, lactation and growth across a range of forage qualities (from 6 to 12 MJ ME/kg) were derived for each class of livestock (sheep and cattle) and aggregated by the number of animals in each to estimate the enterprise energy demand using the approaches described by Freer et al. (Reference Freer, Moore and Donnelly1997) (see Figure 1). The energy equations of the Australian feeding standard (Commonwealth Scientific and Industrial Research Organisation (CSIRO), 2007) were algebraically manipulated to derive equations for the ME requirements of animals as a function of their reproductive status, age, weight, rate of weight change and the ME content of their diet (see the Supplementary Material Part S1). For simplicity, the average ME content of forage available to livestock each month over the whole farm was used to calculate the forage and energy demand for the entire livestock enterprise. This was done using the area weighted average of the ME content (MEforage) of the all forage sources in that month and adjusting to the ME content of intake MEintake to account for the selection of higher quality forage by grazing livestock (equation (1)). The selectivity of intake constant (a) differed between cattle (2.75) and sheep (3.27):
 $$\Delta {\rm ME}_{{{\rm intake}}} \,{\equals}\,a{\times}\left( {{{{\rm ME}_{{{\rm forage}}} {\minus}3.5} \over {12.1{\minus}3.5}}} \right)^{{0.3}} {\times}\left( {{{12.1{\minus}{\rm ME}_{{{\rm forage}}} } \over {12.1{\minus}3.5}}} \right)^{{0.7}} $$
The approach enables a range of different livestock enterprises to be represented, including combinations of sheep and cattle, and breeding and/or trading enterprises. The specified livestock enterprises are stationary: while livestock numbers and classes vary from month to month in response to the annual management cycle, the calculations do not allow for tactical adjustments to numbers in response to seasonal conditions. Although livestock trading or flexible SR are response options available to farmers, the intention here was to investigate risk of feed gaps for a core livestock production enterprise and how these might be managed through forage supply interventions.
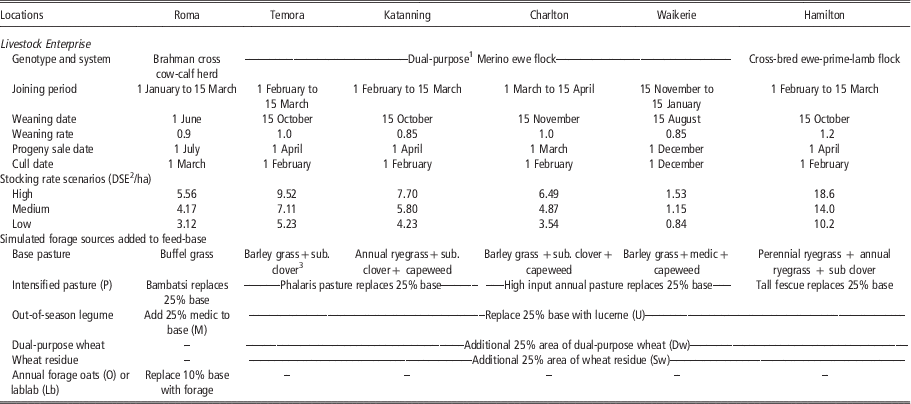
The information in Table 1 was used to infer representative proportions and ages of livestock in different age classes and stages of reproduction during each month for a range of locations (Supplementary Material Tables S1 to S4). Location- and animal-specific schedules of monthly weight changes were provided as input (Supplementary Material Table S5) and from this information the average weight of each class of stock present in each month was computed. In the analyses presented here, all livestock enterprises were based on a self-replacing breeding enterprise where progeny were sold, and sufficient replacements were kept to replace a female replacement cull of 1/8 cows each year and 1/6 ewes each year. In the breeding enterprises rams were included at a ratio of 1/80 ewes or bulls at 1/40 cows.
Key parameters distinguishing amongst different livestock enterprises including the breed and species of the enterprise, their associated joining date, weaning date, weaning rate and sale dates for progeny and cull stock, different stocking rates and forage sources contributing to the feed-base in scenarios tested at six locations across Australia

DSE=dry sheep equivalents.
1 A ‘dual-purpose’ ewe flock is one in which the production of wool and prime lambs are of roughly equal financial importance. Often a proportion of ewes are mated to a terminal sire for prime-lamb production.
2 DSE is the maintenance requirement for a 50-kg wether/dry ewe (8.3 MJ ME/day).
3 Subterranean clover (Trifolium subterraneum). Other species referenced in the table are barley grass (Hordeum leporinum), annual ryegrass (Lolium rigidum), capeweed (Arctotheca calendula) and perennial ryegrass (Lolium perenne).
Forage supply-demand scenarios
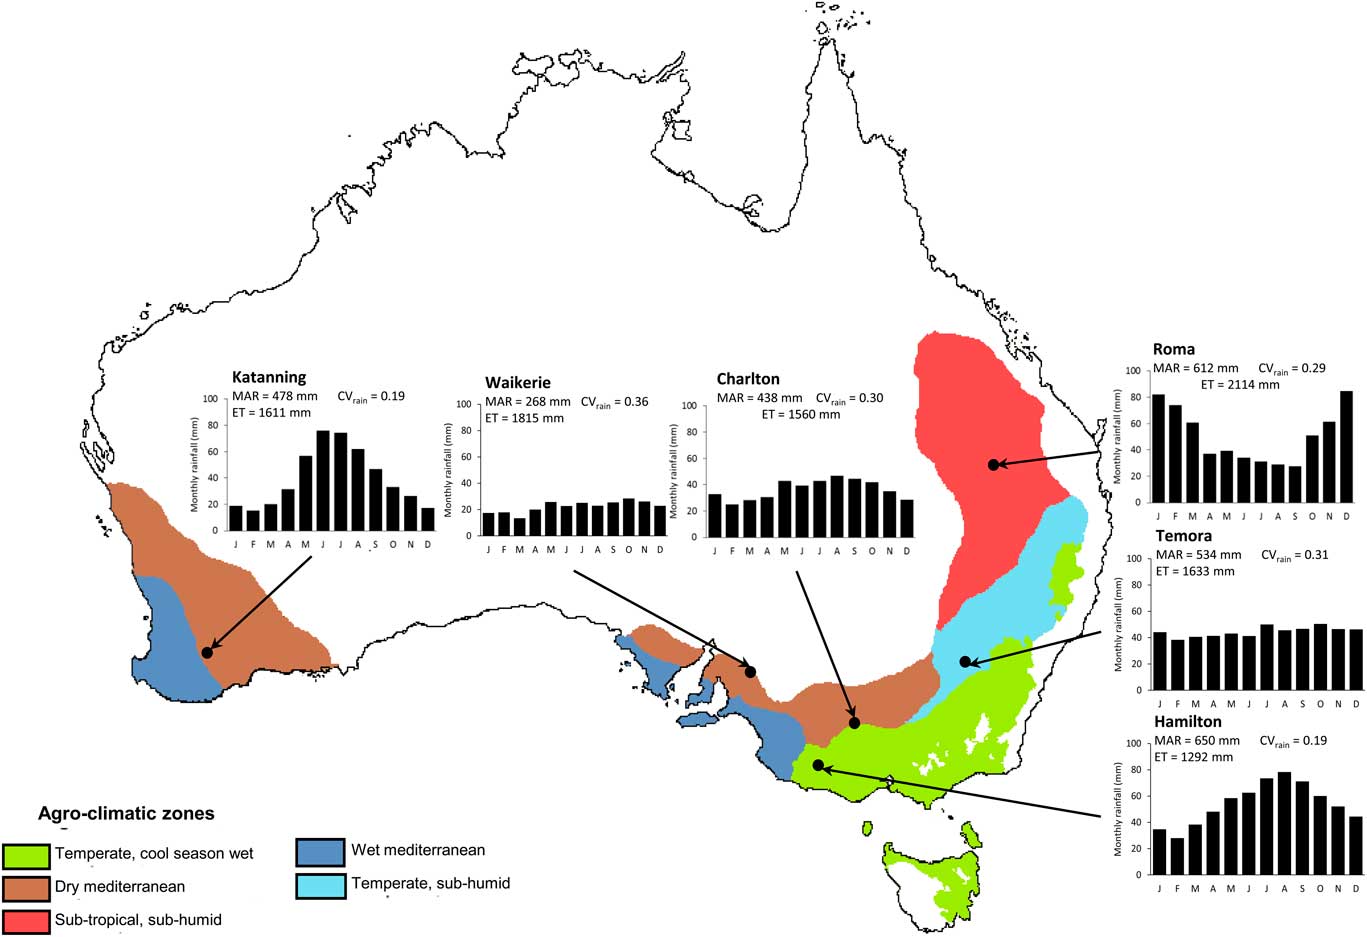
The Farm Feed-base Risk Calculator was used to examine the risk of feed gaps in livestock systems if they were to rely entirely on a permanent pasture alone or where a greater diversity of forage options available on mixed crop-livestock farms can contribute to the feedbase. A factorial design of different farm SR and forage feedbase combinations was examined across six diverse locations representing different agro-climatic zones and production systems spanning Australia’s crop-livestock zone (Figure 3). At each site scenarios examined a set of three SR representing high (resulting in a whole-farm feed deficit in 18% of months), moderate (75% of the high SR) and low SR (75% of the moderate SR) (Table 1). Then for each location×SR a set of feedbase scenarios of increasing complexity (i.e. with an increasing number of forage sources) was analysed by adding to the permanent pasture combinations of four additional forage sources commonly used in each region (Table 1). This resulted in 16 different combinations making up the farm feedbase: the baseline permanent pasture only, four with two feed sources (each added alone to the baseline), six with three feed sources (unique combinations involving two additional sources with the baseline), four with four feed sources (combinations of three additional sources with the baseline) and one where all feed sources were combined. The additional four feedbase interventions broadly included: A. intensification of base pasture production either through increased inputs or adding an improved perennial grass (P); B. adding a legume which provides out-of-season forage; C. allowing grazing of dual-purpose wheat (Dw); D. allowing grazing of wheat crop residues (Sw); or E. providing either a high quality summer (lablab; Lb) or winter (oats; O) annual forage crop. In the cases of the dual-purpose crop grazing and wheat residue grazing, these were assumed not to replace the area of other forages and were entirely additive to the feedbase. That is, when 25% of land was sourced from a dual-purpose crop and/or crop residue grazing this did not reduce the supply of forage from the baseline pasture or other forage sources.
(colour online) Mean annual rainfall (MAR) and its co-efficient of variation (CVrain), rainfall distribution throughout the year, mean potential evapotranspiration (ET) between 1956 and 2012, and their location across Australia’s agro-climatic zones (Hutchinson et al., Reference Hutchinson, McIntyre, Hobbs, Stein, Garnett and Kinloch2005) of six locations subjected to analysis of livestock-feed system.

Simulations of monthly growth of forages
For all forages cumulative monthly growth (i.e. net primary production or the sum of total growth not including losses to senescence) was simulated using validated growth models in APSIM (Holzworth et al., Reference Holzworth, Huth, deVoil, Zurcher, Herrmann, McLean, Chenu, van Oosterom, Snow, Murphy, Moore, Brown, Whish, Verrall, Fainges, Bell, Peake, Poulton, Hochman, Thorburn, Gaydon, Dalgliesh, Rodriguez, Cox, Chapman, Doherty, Teixeira, Sharp, Cichota, Vogeler, Li, Wang, Hammer, Robertson, Dimes, Carberry, Hargreaves, MacLeod, McDonald, Harsdorf, Wedgwood and Keating2014) and GrassGro (Moore et al., Reference Moore1997). To ensure sensibility of these predictions they were compared with reported or expert opinion of potential forage yields in each region. Forage digestibility (or ME content) for each forage throughout the year was obtained from these models where this was predicted or from locally reported data. Several iterations of preliminary simulations of different forage management were run to derive management rules that reasonably predicted water and nutrient limited potential biomass production from each forage source at each location. Climate files were obtained from the SILO database for each location and simulations undertaken from 1956 to 2010. Characterised soils from the APSoil database (www.apsim.info/Products/APSoil.aspx) which corresponded to each region and forage source were used in simulations (see Supplementary Table S6).
At each location a baseline permanent pasture was simulated using either GrassGro software (Moore et al., Reference Moore1997, www.grazplan.csiro.au) for temperate annual and perennial pastures, or GRASP (McKeon et al., Reference McKeon, Day, Howden, Mott, Orr, Scattini and Weston1990) run within the APSIM framework for a tropical buffel grass (Cenchrus ciliaris) pasture at the Roma location (Table 1). An ‘intensified’ pasture (P) (Table 1) was simulated to represent higher input or improved pastures by either increasing the soil fertility scalar for annual temperate pastures at Charlton and Waikerie, or by adding or replacing the grasses in the base pasture with a perennial grass species with a deeper root system and a longer growing season, that is adding phalaris (Phalaris aquatica) at Temora and Katanning, tall fescue (Festuca arundinacea) at Hamilton, or bambatsi panic (Panicum coloratum var. makarikariense) at Roma. The high quality forage legumes providing forage outside the main pasture growing season simulated were a permanent lucerne (Medicago sativa) pasture (U) at the five southern locations, or the addition of an annual barrel medic (M, Medicago truncatula cv. Paraggio) added to the baseline grass pasture at Roma. All permanent pastures were simulated under grazing with moderate to high stocking densities and grazing or cutting management kept biomass within upper and lower thresholds (Supplementary Material Table S7).
Forage provided from annual forage crops at the Roma site, and dual-purpose wheat and wheat crop residues at the other sites were all simulated using APSIM. Oat (O, Avena sativa) and lablab (Lb, Lablab purpureus) forage crops were sown once rainfall and soil water conditions had been met in either autumn (1 April to 1 July) or spring (20 October to 15 December) and were terminated once maximum temperatures exceeded 35oC or minimum temperatures fell below 5oC, respectively. To approximate recommended grazing management in these crops, cutting was implemented once biomass exceeded a threshold level (3 t dry matter (DM)/ha in oats and 4 t DM/ha in lablab) and 50% of biomass above a residual of 1 t DM/ha was removed. Dual-purpose wheat (Dw) involves grazing during a crop’s vegetative stage up until floral initiation and typically uses a long-season varieties (e.g. cv. Wedgetail) sown earlier than normal (15 March to 15 May). If a sowing opportunity was not available (i.e. >25 mm over 5 days) for this early crop then a shorter-season grain-only variety was then sown in the normal window (15 May to 1 July), but this was also available for grazing. Crop growth up until floral initiation was simulated under grazing (see Supplementary Material Table S7). Wheat crop residues (Sw) available for grazing after grain harvest were simulated for ungrazed shorter-season grain-only crops at all locations, except Hamilton where dual-purpose long-season cultivars were also still included. Because of the complexity involved, spilt grain and fallow weeds were not included as a component of the forage provided in crop residues though they can be important for driving energy supply and animal performance when grazing crop residues.
In all simulations the 1st year of simulated forage growth was omitted to allow equilibrium to be reached and reduce the influence of initial conditions. To describe annual cycles in forage digestibility (and ME content) the long-term monthly average was either predicted using the forage simulation models or derived from data available in the literature (Supplementary Table S8).
Results
Frequency of fresh feed deficits
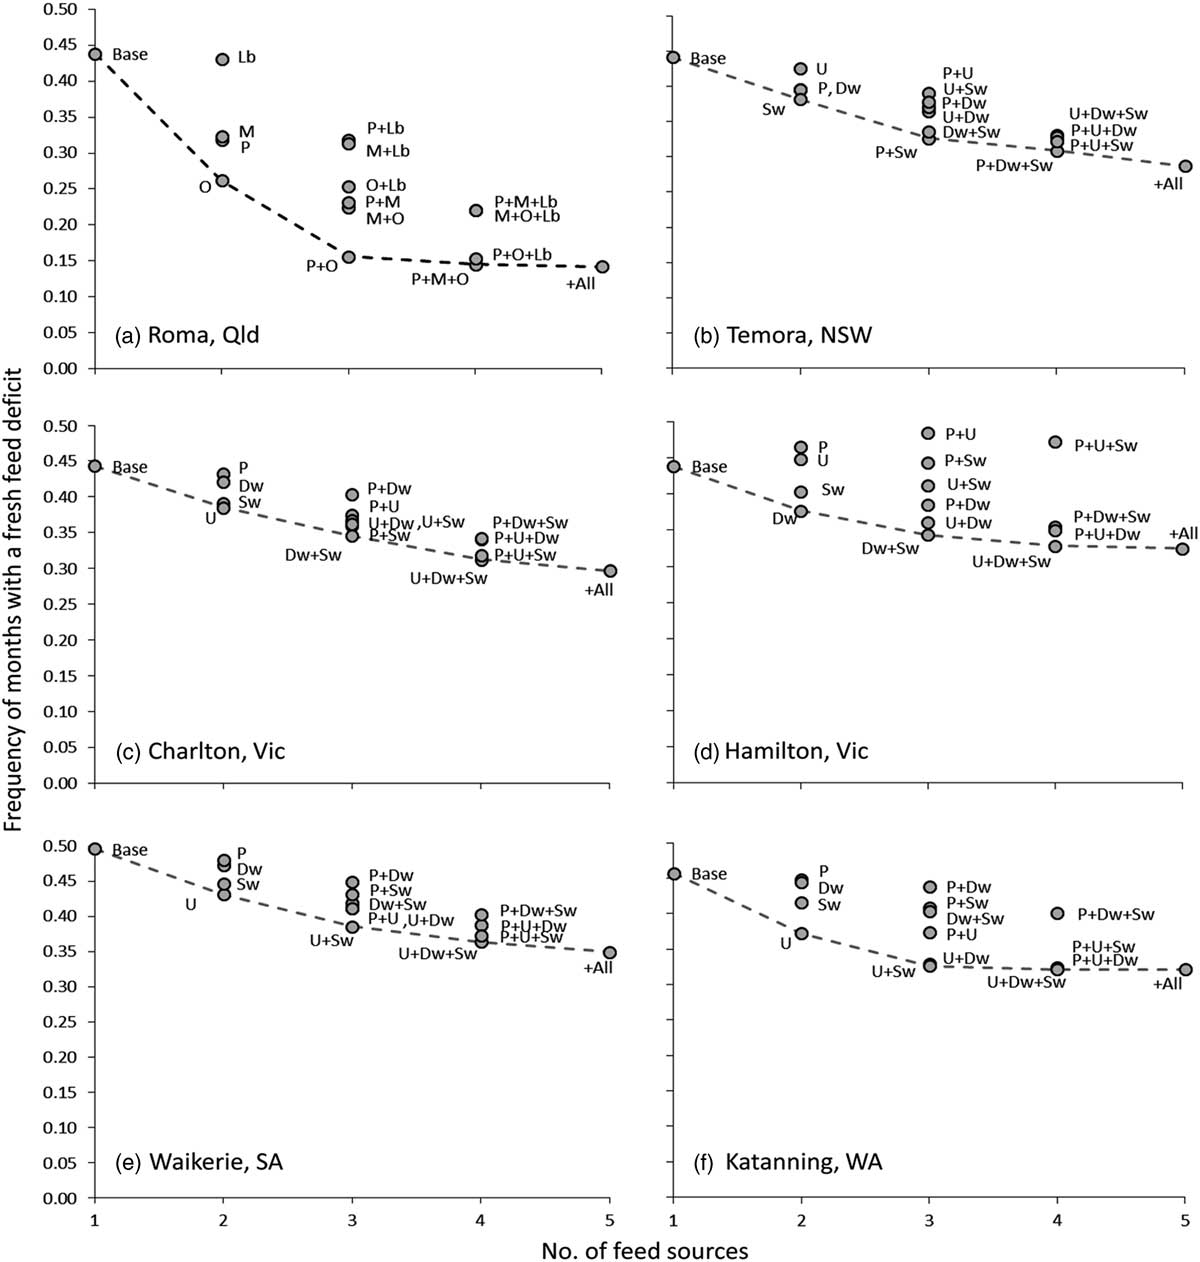
Across all locations, adding more feed sources to the feedbase effectively reduced the frequency of deficits in monthly fresh feed supply (Figure 4). The best combinations of forage sources reduced the frequency of months with a fresh feed deficit by 0.12 to 0.15 (Figure 4b-f), whereas in one case (Roma) they were reduced by 0.30 (Figure 4a). At 3 locations (Charlton, Waikerie and Temora), additional benefits were observed each time an additional forage was added to the feedbase until all five forage sources simulated were used in combination (Figure 4b, c and e). On the other hand, little further benefit was achieved once two to three additional forages were added to the feedbase at the other locations (Figure 4a, d and f). The additional feed sources that had the greatest impact on improving the continuity of fresh feed supply also differed between locations, but rarely did the addition of a particular feed source have a negative impact on farm fresh feed supply. Only in one case did adding an additional forage source increase the frequency of a fresh feed deficit (i.e. at Hamilton changing 25% of the feedbase from a ryegrass-annual pasture mix to tall fescue and/or lucerne; Figure 4d).
Frequency of months when monthly fresh feed supply is less than feed demand under a diversity of feedbase combinations at high stocking rates across six locations (a–f) in Australia’s mixed crop-livestock zone (see Figure 3). Dotted line indicates the lowest risk scenarios as the level of feedbase complexity increases. Codes indicate the combination of feed sources (see Table 1).

Predicted deficits in fresh feed supply throughout the year varied significantly, indicating the large differences in annual cycles of forage supply across the different regions (data not shown). Periods of fresh feed deficits still occurred in the majority of years (0.5 to 0.9) irrespective of the feed interventions that were put in place. In most cases feed sources that extended the fresh forage growth significantly reduced the frequency of deficits in fresh feed supply. The most effective feedbase diversification options tested for improving the continuity of fresh feed supply were lucerne in the regions with Mediterranean climates (Waikerie, Katanning, Charlton), dual-purpose wheat in the locations with temperate climates (Hamilton and Temora) and forage oats in the subtropical location (Roma).
Frequency of deficits in carry-over feed supply
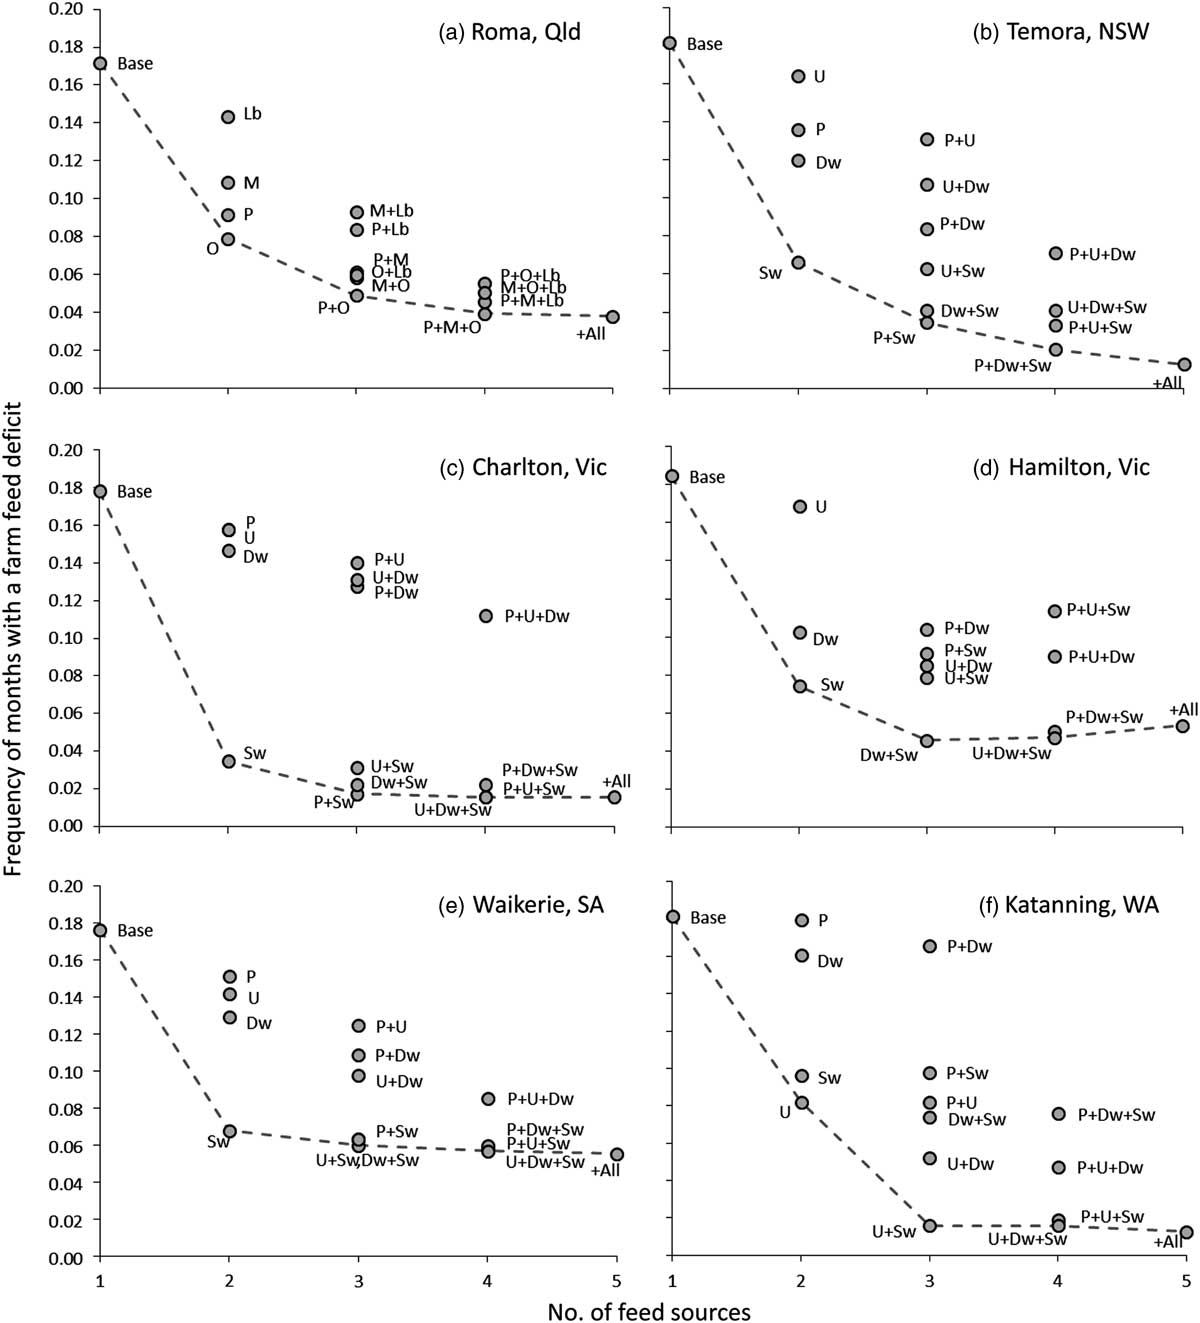
At all locations the high SR scenarios were selected to induce whole-farm feed deficits including carry-over in 0.18 of months over the 50-year evaluation period. Under the ‘base’ pasture system alone at all locations, lowering livestock SR and associated energy demand to moderate (25% lower) or low levels (45% lower) reduced the frequency of whole-farm feed deficits roughly proportionately: by 0.06 to 0.12 and 0.10 to 0.16, respectively. Meanwhile, under the high SR scenario a diversified feedbase was able to reduce the frequency of whole-farm feed deficits by 0.12 to 0.17 across all locations (Figure 5). In all cases the frequency of whole-farm feed deficits was less than 0.06 of months at all locations under the best feedbase combination and high SR (Figure 5). At Roma and Temora, additional benefits were observed each time additional forage sources were added to the feedbase until all five forages were used in combination (Figure 5a and b). However, at the other locations little further benefit was achieved once the most effective forage was added to the feedbase (Figure 5c to f).
Frequency of months when farm feed supply (including carry-over) is insufficient to meet livestock demand under a diversity of feedbase combinations under high stocking rate scenarios across six locations (a–f; see Figure 3). Dotted line indicates the lowest risk scenarios as the level of feedbase complexity increases. Codes indicate the combination of feed sources (see Table 1).

Whole-farm feed deficits were effectively mitigated by allowing use of wheat crop residues at all sites where they were included in the feedbase. Despite their low quality, crop residues provide a highly valuable feed source that can be utilised during summer periods when winter-active pastures are not available. The addition of either dual-purpose wheat, lucerne or perennial grass pastures in combination with crop residues further reduced the frequency of farm feed deficits at these locations (Figure 5b to 5f). At the subtropical location (Roma), whole-farm feed deficits were most effectively mitigated through the addition of oats, but additional benefits were observed by complementing oats with a range of other forage sources (Figure 5a).
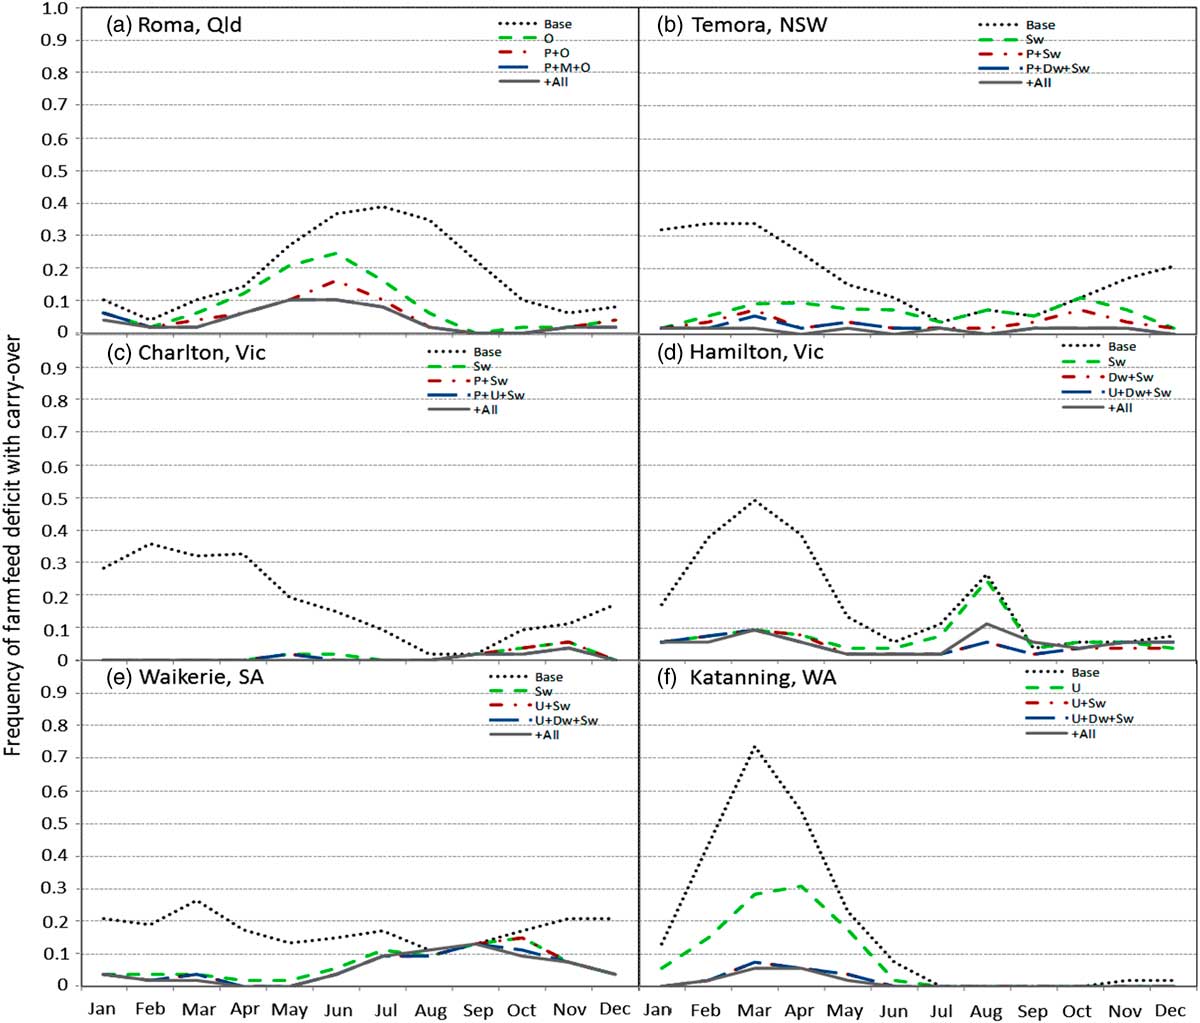
(colour online) Frequency of deficits in whole-farm feed supply (including carry over) occurring during the year under the best combination of feed sources for each level of feedbase complexity across 6 locations (a–f) in Australia’s mixed crop-livestock zone (see Figure 3). Codes indicate the combination of feed sources (see Table 1).

Despite calibration of scenarios across all sites to the same total frequency of whole-farm feed deficits, these occurred at quite different times of the year amongst the range of locations here, indicating the differences in the critical times of the year where the risk of feed gaps is much higher (Figure 6). A feedbase consisting of the base pasture only had high risk periods during June to September at Roma (Figure 6a), January to April at Temora (Figure 6b), January to May at Charlton (Figure 6c), February to April at Hamilton (Figure 6d), November to March at Waikerie (Figure 6e) and February to May at Katanning (Figure 6f). The addition of oats at Roma greatly reduced the frequency of farm feed deficits during winter and spring and provision of stubbles were highly effective for filling feed deficits during summer and autumn in southern locations.
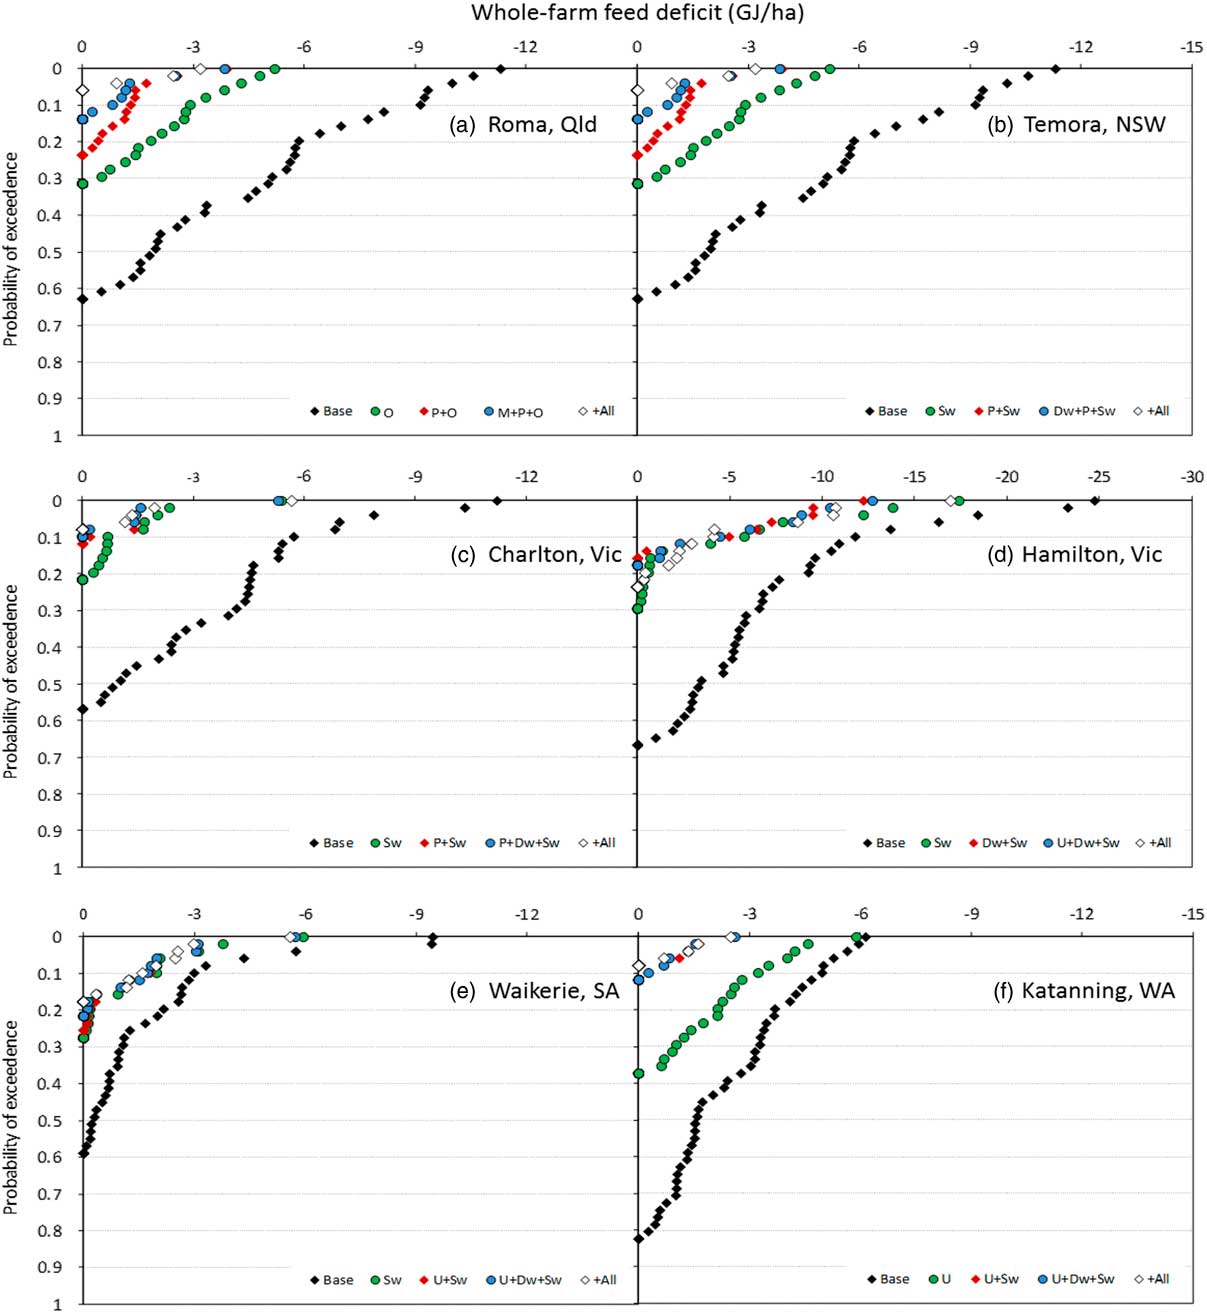
Diversification of the farm feedbase not only reduced the frequency but also substantially reduced the magnitude of the farm feed deficit (Figure 7). That is, when feed deficits did occur the amount of supplementary feed or reduction in stock numbers required was far less when more feed options were included in the feedbase. Figure 7 presents the predicted likelihood that the farm feed deficit (in GJ energy/ha) will exceed a certain size across the six different locations for the best feedbase combinations at the high SR. The farm feed deficit is calculated in GJ per hectare rather than per livestock equivalent, because the energy demand of each livestock enterprise (and hence livestock equivalents) varies over the cycle of the year. The addition of a single feed source to the feedbase was able to not only halve (or more) the frequency of a feed deficit but also halved the size of the feed deficit that occurred. At all locations except Waikerie, a feedbase of only the base pasture induced a farm feed deficit greater than 3 GJ/ha in 0.35 to 0.50 of months, but the addition of a single feed source reduced this to <0.10 at all sites (Figure 7). At Roma, Temora and Katanning there were further reductions in the magnitude and frequency of feed deficits as more diversity was added to the feedbase (Figure 7a, b and f), whereas at the other sites little additional benefit was achieved with further additions to the feedbase.
(colour online) Probability of exceedance for whole-farm feed deficits (i.e. negative balance of energy of feed supply including carry-over compared with livestock demand per hectare of non-cropped land) under the best combination of feed sources for each level of feedbase complexity under high stocking rate scenarios across six locations (a–f) in Australia’s mixed crop-livestock zone (see Figure 3). Codes indicate the combination of feed sources (see Table 1).

Feed gap risk – stocking rate trade-offs
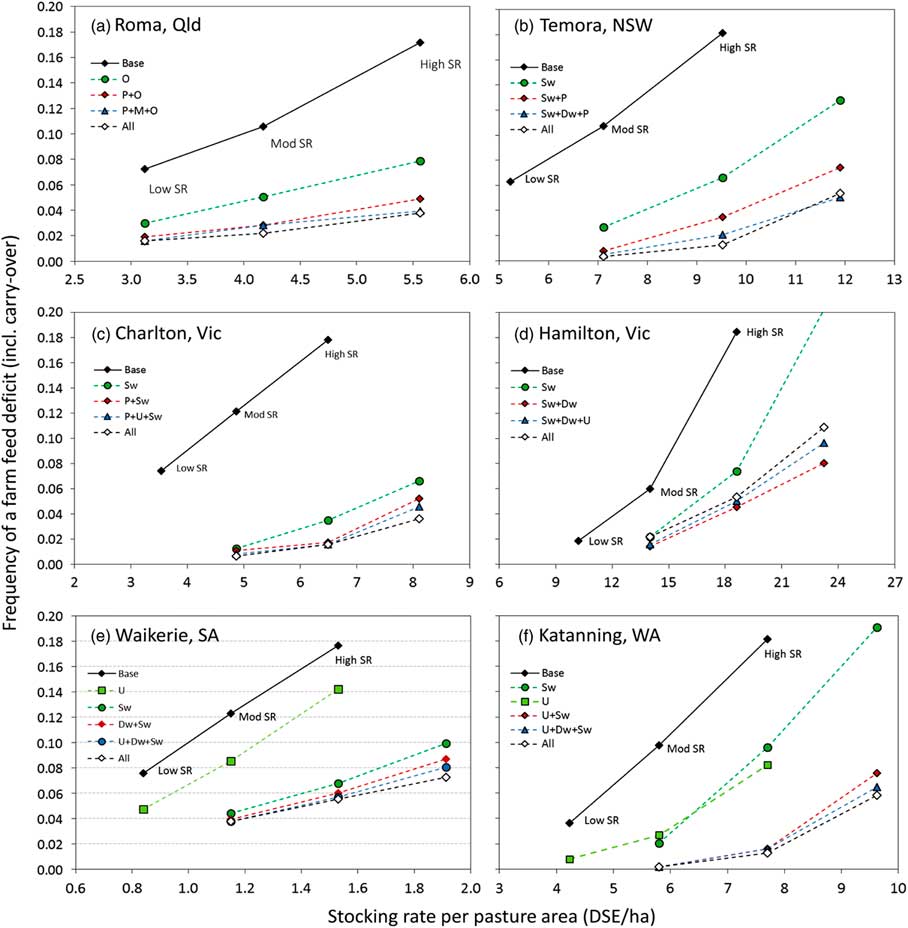
Here we examine the relationships between farm SR and the risk of a feed gap occurring for feed-base combinations with increasing diversity. This reveals that for a given SR, or risk of a feed gap, greater diversity in the farm feedbase improves the resilience and potential productivity of the livestock system. Across all sites, which vary greatly in their respective livestock carrying capacities, a significant trade-off between the average SR of the livestock enterprise and the frequency of feed gaps is clear (Figure 8). Under scenarios including the base pasture only, lower SR were required to reduce the frequency of feed deficits to acceptable levels (e.g. <0.10 of months). This clearly demonstrates the degree that risk of feed gaps can limit livestock productivity. Diversifying the feedbase to include combinations of improved pastures, crop residues and/or forage crop grazing demonstrates the capacity to increase SR significantly at the same time as reducing or maintaining the risk of feed gaps occurring on mixed farms (Figure 8). At all sites diversified feedbases were able to maintain these higher SR at the same time as mitigating the risk of feed deficits to levels than would be achieved under low SR (i.e. 45% of the high rate) on a feedbase consisting of a pasture only. For example, at Roma it was predicted that a similar risk of feed gaps would occur under a low SR (3 dry sheep equivalent (DSE)/ha) using a pasture only as would occur when integrating 10% of its area to oats under a high SR (>5 DSE/ha); further additions to the feedbase would reduce this risk of feed gaps further (Figure 8a). For a given level of risk, compared with the base pasture alone the diversified feedbases tested here could support SR of 2 to 3 times higher at all locations except the higher rainfall location, Hamilton; this was around 1.4 time higher.
(colour online) Relationship between frequency of a whole-farm feed deficit and farm stocking rate per pasture hectare (not including area of crop grazed) under the best combination of feed sources for each level of feedbase complexity across six locations (a–f) in Australia’s mixed crop-livestock zone (see Figure 3). Codes indicate the combination of feed sources (see Table 1).

Discussion
Benefits of feed-base diversification on crop-livestock farms
The risk of feed gaps is a critical factor that can limit the productivity of forage-dependent livestock systems in variable production environments. This paper clearly shows that integrating a diversity of forages available on crop-livestock farms can improve continuity in forage supply and reduce these risks and hence raise the potential livestock productivity and resilience of these systems. Systems relying on only one feed source were prone to higher risk of feed gaps and hence farm managers would have to reduce SR or purchase supplementary feed to mitigate these risks. Similarly, increasing diversity within livestock systems in France has also been shown to improve their resilience to climate variability and reduce animal supplementary feeding costs (Martin and Magne, Reference Martin and Magne2015).
At all locations examined here there were benefits for potential farm productivity and risk mitigation by increasing the diversity of forage sources available on mixed farms. Higher SR could be maintained while limiting risk when combinations of other feed sources were introduced into the feedbase. In all cases we found diminishing returns from making the feedbase more complex beyond combinations of two to three components; these typically achieved the maximum benefits in terms of reducing the risk of feed gaps. This is important because management requirements are likely to increase as the number of different feed sources contributing to the feed base increase. Hence, any additional benefits provided by adding more elements to the farming system may not be sufficient to balance the additional complexity involved (Pannell, Reference Pannell1999).
The importance of examining the impact of a forage option on the whole-farm feed-livestock system is also clear. For example, this analysis shows that a small area (10% of area) of forage oats at the Roma location can have a large benefit for mitigating feed deficits and hence provide opportunities to greatly increase livestock system productivity. This finding contrasts greatly with analysis using gross margin approaches at field level which find oats to be a less profitable forage option (Wylie, Reference Wylie2007). The same system benefits from dual-purpose crops have been predicted in southern Australia, where the impact of filling a winter feed gap by replacing 10% of pasture with dual-purpose crops can actually increase potential whole-farm grazing days by 10% to 15% and generate very high returns per unit of land allocated to this forage source (Bell et al., Reference Bell, Robertson, Revell, Lilley and Moore2015).
Although there are several examples of modelling analyses that have demonstrated the value of adding perennial forages that fill feed gaps in mixed farming systems in southern Australia (Byrne et al., Reference Byrne, Robertson, Bathgate and Hoque2010; Monjardino et al., Reference Monjardino, Revell and Pannell2010), few have examined this in a way that considers climate risk. The value of feed provision in dry seasons is likely to be far higher than in more favourable years. Most research has also tended to consider a forage option for filling a feed gap in isolation, whereas this assessment framework has the capacity to look at combinations of forages contributing to the feedbase. In long-term whole-farm simulations, Moore (Reference Moore, Donnelly and Freer2014) also found there were opportunities for perennial pastures of lucerne, temperate or tropical grasses to increase average farm profit and lower risk at several locations across southern Australia. The study here clearly shows that both temperate grasses and lucerne fill similar niches in the feedbase across these various locations. Although using them in combination reduced the frequency of feed gaps, this was less effective than when they were used in combination with other forage sources (such as dual-purpose crops). This finding demonstrates the value in considering the complementarity of the diversity of forage options available in a livestock production system in order to establish those with the greatest benefit for filling gaps in feed supply.
We demonstrated that crop residues are a particularly important forage resource for managing periods of low feed supply from other sources. Despite their low forage quality (<55% dry matter digestibility), crop residues were found to be highly valuable for avoiding whole-farm feed deficits where supplementary feeding or destocking would be necessary and/or reducing grazing pressure and the occurrence of low pasture availability on other parts of the farm. Furthermore, here we have probably underestimated the value of crop residues, as we have not considered the feed value of high quality spilt grain after harvest. In a more detailed modelling analysis, Thomas et al. (Reference Thomas, Finlayson, Moore and Robertson2010) also found that allowing grazing of cereal crop residues greatly enhanced farm water use efficiency due to lower supplementary feed requirements but the net economic value of crop residues varied greatly between years due to the supply of feed from other sources. These findings are particularly important with the growing adoption and promotion of residue retention in cropping systems in mixed farming regions across the globe, which discourage the grazing of livestock on crop residues (Kirkegaard et al., Reference Kirkegaard, Conyers, Hunt, Kirkby, Watt and Rebetzke2014). If this feed source is no longer used by farmers this is likely to greatly increase their susceptibility to feed deficits and have significant costs for the livestock enterprise on these farms.
Advantages and limitations of the analysis approach
The method used here also demonstrates that simple approaches can be used to examine the relative value and riskiness of different feedbase components within different farming systems. The approach applied here exchanges increased simplicity for reduced accuracy and means that some aspects of the system are ignored or simplified. First, the calculations are based entirely on the energy budget of livestock and so do not account for circumstances where protein or phosphorus supply limit animal intake or growth. These assumptions would break down in other environments, such as tropical savannas of northern Australia where protein deficiency is a critical limitation of livestock production (Poppi and McLennan, Reference Poppi and McLennan1995). Second, feedbacks between grazing management and forage production over time are ignored, which may induce lags in pasture/forage regrowth or degradation of the pasture resource that have longer-term productivity implications. Also, livestock performance and demand feedbacks are not incorporated, meaning that limitations in forage quantity or quality do not induce reductions in livestock growth and hence demand. In addition, effects on overall productivity associated with feed quality such as the reproductive performance of livestock need to be incorporated into the input data. The calculator ignores the allocation of livestock and classes of livestock within the farm or across the various forage sources. Instead, the whole-farm feedbase is aggregated into a single feed pool, which simplifies the complexity of a range of different fields in different states and effectively assumes perfect grazing management practices. Variation in the quality of feedbase items has also been simplified. For instance, the amount and quality of feed in stubbles will depend on factors such as the type of crop, seasonal conditions in which the crop was grown, and harvesting efficiency (e.g. how much grain is not harvested and left available for livestock). Analyses that require these higher level of sophistication are possible with research tools, but these require far more powerful and complex modelling approaches.
The example livestock production systems presented here only consider the potential forage production and livestock demand, rather than the reduced levels that would be observed in the real world due to management limitations. Hence, the pasture productivity levels and SR presented here are those that would be achieved under optimal management. A reduction factor could be incorporated into the forage simulations used here to scale the levels of production to those that are more realistic on farms. For example, farmers are likely to only achieve 80% of potential productivity in their pasture/forage and livestock enterprises due to economic and management limitations. When applied in combination in livestock-feed systems as a whole is likely to limit the attainable yield to <64% of the simulated potential here (Van der Linden et al., Reference Van der Linden, Oosting, van de Ven, de Boer and van Ittersum2015). Despite the fact that most of the feed-base options tested are used to varying degrees in the livestock systems being examined here, technical and socio-economic factors may limit their wider application. For example, compared with other off-farm options such as supplementary feeding with concentrates or by-products, using a more diverse mix of feed sources may be limited by their relative ease and skills required, relative profitability, up-front establishment costs, reluctance to graze crops or stubbles or operational efficiency and labour costs.
Adding financial aspects to the approach described here would also be very fruitful as it would allow for the economic trade-offs for various combinations for forage sources to be incorporated. This could be done simply by adding a cost of production per area of forage into the system, and likewise adding a simple annual return for the different livestock units in the farm. This approach might also then be able to add costs associated with supplementary feeding or forced livestock sales when feed gaps occur on the farm. Together these aspects would enable a greater focus on the potential economic gain that would occur from changing the combination of feed sources on the farm and/or adjustments to the livestock enterprise. This also potentially allows for the development of a predictive approach for the marginal value of feed at different times in different livestock-forage systems (Bell et al., Reference Bell, Dove, McDonald and Kirkegaard2008). The marginal value of feed is the economic response that would be expected from providing additional feed to the system. That is, it accounts for the fact that feed is very valuable when there is a shortage on the farm, but has little value when there is a surplus. Capacity to predict this in livestock systems with diverse feed systems can allow the critical costs of providing energy at different times or from different sources to be determined at the whole-of-enterprise level. In addition to being of value to on-farm decision-makers, a broad view of the marginal value of feed across Australia’s agricultural regions would be of assistance in prioritising R&D into evaluation of new forage germplasm and genetic improvement of existing pasture species.
Conclusions
Previous approaches often have explored the balance of feed supply and demand using average or synthetic seasons which failed to capture the temporal variability in feed supply that is critical in many farm decisions. Here we have demonstrated how a fairly simple approach to dealing with the need to understand temporal variability in the farm feed supply can yield useful insights into addressing the productivity and risk trade-offs within complex livestock systems. The analysis method embodied in our calculator demonstrates the value of diversifying the feedbase for improving the continuity of feed supply and reducing the frequency and magnitude of feed deficits across a range of production systems, and the calculator can readily be extended to evaluate additional farming scenarios and systems interventions. Similar approaches could also be useful in other environments that experience variable climates and forage supply. There is significant opportunity to build on this approach to incorporate further economic analyses and develop decision support tools that help farmers and advisors explore options for improvement in their livestock-feed systems.
Acknowledgements
This research was conducted as part of the Grain and Graze 2 program, funded by the Grains Research and Development Corporation. Derivation of the livestock energy demand equations used here was supported by Meat and Livestock Australia as part of the construction of the MLA Feed Demand Calculator.
Supplementary material
To view supplementary material for this article, please visit https://doi.org/10.1017/S1751731117003196