I. INTRODUCTION
It is well-known that many wide gap stoichiometric oxide materials, with high transparency in the visible and ultraviolet (UV) spectral ranges, operate as classic insulators at room temperature. The only way to obtain a good conductivity for these materials is by creating electron concentration degeneracy in the conduction band by the introduction of some nonstoichiometry and/or appropriate dopants.Reference Jarzebski1
These conditions are very conveniently obtained in thin films of materials, such as In2O3, SnO2, ZnO, and CdO. Among all the transparent conducting oxide (TCO) films, a special attention has been paid to tin-doped indium oxide (ITO) films, which are widely used for different optoelectronic applications as an integral part of computer screens, mobile telephones, low-energy window, and photovoltaic panel coatings.
Fluorine-doped tin oxide (FTO) also exhibits a good visible transparency because of its wide band gap, while retaining a low electrical resistivity due to the high electron concentration caused by both the oxygen vacancies as well as the fluorine atoms replacing atoms of oxygen in the crystal lattice. FTO films are mechanically and chemically more stable than ITO films and have numerous applications including thin solar cells, low emissivity coatings for windows, gas sensors, and transparent conducting layers in liquid crystal displays. Chemical vapor deposition (CVD) is one of the most commonly used techniques for the production of FTO films. This method involves the transport of gaseous precursors (inorganic or organic) to a reactor for their subsequent decomposition on the heated substrate. Hence, it is a relatively simple, versatile, and reproducible process that gives high quality thin film products.Reference Ginley, Hosono and Paine2
A simpler analog of the CVD process is the spray pyrolysis, a technique that is well suited for the preparation of doped tin oxide films because of its inexpensive experimental arrangement, easy of adding various doping materials, reproducibility, high growth rate, and possibility of adaptation for mass production to obtain large area coatings.Reference Cachet, Bruneaux, Folcher, Levy-Clement, Vard and Neumann-Spallart3
From many published results, it can be observed that the structural, electrical, and optical properties of the FTO films depend strongly on the deposition conditions. Both the optical transmission and electrical conductivity of the films should exceed a certain minimum value. Ideally, both parameters should be as high as possible. However, a simultaneous achievement of maximum transmission and conduction is not possible in most cases. This makes important a quantitative comparison of the performance for TCO films presenting different thicknesses, morphological structures, as well as electrical and optical parameters fabricated with different technological methods and substrates. A better balance between optical transmission and sheet resistance, important for numerous applications, has been proposed by HaackeReference Haacke4 who redefined the figure of merit (FOM) as:
 $${\phi _{\rm{H}}} = {{{T^{10}}} \over {{R_{\rm{s}}}}}\quad ,$$
where R s and T represent the sheet resistance and transmittance, respectively.
A higher value of FOM indicates a better performance of a film characterized simultaneously with a low sheet resistance and high transparency. However, the value of one of these parameters compromises the value of the other. As a result, the FOM cannot be unlimitedly high. Usually, TCO nanostructured films present a FOM of the order of 10−3 Ω−1 due to a high sheet resistance and/or low transparency. The highest value known of the FOM for ITO films, for instance, has been reported as 12 × 10−3 Ω−1.Reference Chen, Li, Zhang, Xu and Cheng5
For commercial FTO films, the reported FOM is 17.4 × 10⁻³ Ω−1,6 and the highest known Haacke FOM value for such films is 35.7 × 10⁻³ Ω−1.Reference Moholkar, Pawar, Rajpure and Bhosale7
At the same time, a different approach for the calculation of the FOM was conducted by Gordon,Reference Gordon8 where it was proposed to determine the FOM as the ratio of the electrical conductivity σ to the absorption coefficient α in the visible wave length range
 $${\phi _{\rm{G}}} = {\sigma \over \alpha } = {{{1 \mathord{\left/ {\vphantom {1 {{R_{\rm{s}}}t}}} \right. \kern-\nulldelimiterspace} {{R_{\rm{s}}}t}}} \over {{{ - \ln \left( {T\, +\, R} \right)} \over t}}} = - {\left[ {{R_{\rm{s}}}\ln \left( {T + R} \right)} \right]^{ - 1}}\quad ,$$
where t is the film thickness, R s is the sheet resistance in ohms per square (Ω/sq), T is the total visible transmission, and R is the total visible reflectance.
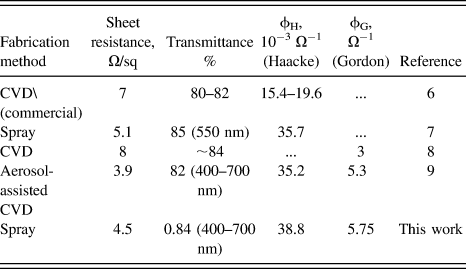
From this point of view, a FOM = 3 Ω−1 is reported for CVD FTO films with R s = 8 Ω/sq and visible absorption coefficient α = 0.04 cm−1. Other authorsReference Noor and Parkin9 report higher values of FOM = 5.3 Ω−1 for FTO films fabricated using aerosol-assisted CVD. For commercial FTO films, the standard FOM determined by the Gordon method lies in the 1.5–1.6 Ω−1 range.Reference Noor and Parkin9
Even though this method for the estimation of the FOM is more precise, it requires the measurement of both the transmittance and reflectance spectra of the TCO films. This method has been successfully used for establishing the requirements for transparent electrodes to be used in thin film solar cell modules.Reference Rowell and McGehee10
In this work, we report a simple but effective spray pyrolysis method with some innovative approaches able to fabricate strongly oriented, highly uniform, conductive, and transparent FTO thin films presenting the FOM value comparable with the highest values reported to date.
II. EXPERIMENTAL
In this work, the spray pyrolysis system used to deposit the FTO films was designed with some innovative approach for comparison reported earlier.Reference Martínez, Huerta, O-Rueda de León, Acosta, Malik and Aguilar11 To maintain a uniform temperature distribution of the substrate, a hot plate was covered with a thick (∼1 cm) polished silicon disk because of its high thermal conductivity and chemical resistance. The used method allows for high deposition rates (∼200–500 nm/min) of the FTO film. However, the cold precursor solution together with a gas stream leads to a fast cooling of the substrate. Thus, the film would grow under difficult to control temperature conditions. This is possible to prevent by using a spray pyrolysis technique in which the temperature of the hot plate is controlled by a microprocessor.Reference Martínez, Huerta, O-Rueda de León, Acosta, Malik and Aguilar11 In this work, the temperature of a hot plate was controlled. Besides, a continuous spraying of a cool precursor solution leads to the cooling of the substrate. In this work, an innovative approach was used for the FTO film deposition. The temperature was measured with a thermocouple soldered on the surface of a reference glass substrate located near the working one. Additionally, the deposition was made in a pulse mode. The signal from a thermocouple was used to control a pulse generator connected with a magnetic valve for the gas streaming. It allows for the deposition of the film during a short time (1–2 s) with a long pause (10–30 s) for restoring the temperature drop. This guarantees the uncertainty of the substrate temperature in the limits of ±5 °C. Such technological setup allows us for obtaining good results at a lower substrate temperature (450 °C) than those obtained in an earlier published report.Reference Martínez, Huerta, O-Rueda de León, Acosta, Malik and Aguilar11 The deposition was realized using compressed air at a pressure of 0.5 atm with a Pyrex atomizer located at 30 cm from either the Corning glass or the sapphire substrate. A 0.2 M solution of tin chloride (SnCl4·5H2O) dissolved in methanol was used as the starting solution. A small amount of NH4F dissolved in water was added to the starting solution for the preparation of the precursor with 0–1 F/Sn molar concentrations. A few drops of HCl were added to the precursor solution to prevent the hydrolysis of the tin chloride due to the presence of water. The flow rate of the precursor during the deposition process was 10 mL/min.
The film thickness was measured with an Alpha Step 200 profilometer (KLA-Tencor Corporation, Milpitas, CA). The electrical resistivity (ρ), Hall mobility (μ), and carrier concentration (n) were measured at room temperature using the van der Pauw method using MMR Technologies equipment with a magnetic field of 0.3 Tesla. The optical transmission (T) spectra of the films were obtained using an Agilent 8453 UV–visible spectroscopy system (Agilent Technologies, Santa Clara, CA) with air as reference. The structural characterization was carried out with an AXSD8 advanced x-ray diffractometer (Bruker AXS, Karlsruhe, Germany) operating in the Bragg–Brentano θ–θ geometry using Cu Kα radiation. The JSPM-5200 atomic force microscope (AFM; JEOL Ltd., Tokyo, Japan) was used to study the film surfaces.
III. RESULTS AND DISCUSSION
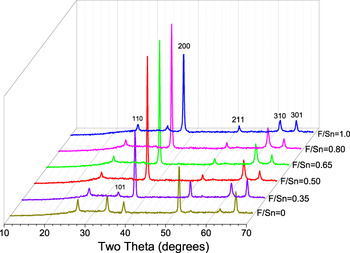
The x-ray diffraction (XRD) measurements (Fig. 1) indicate that all the deposited FTO films with a thickness around 500 nm, for a 0.35 F/Sn ratio in the precursor solution, present a tetragonal rutile structure; this was confirmed by comparison with the American Society for Testing and Materials (ASTM) standard for the tin oxide.12
XRD spectrum obtained for the deposited FTO films with a thickness of around 500 nm and different F/Sn ratios in the precursor.

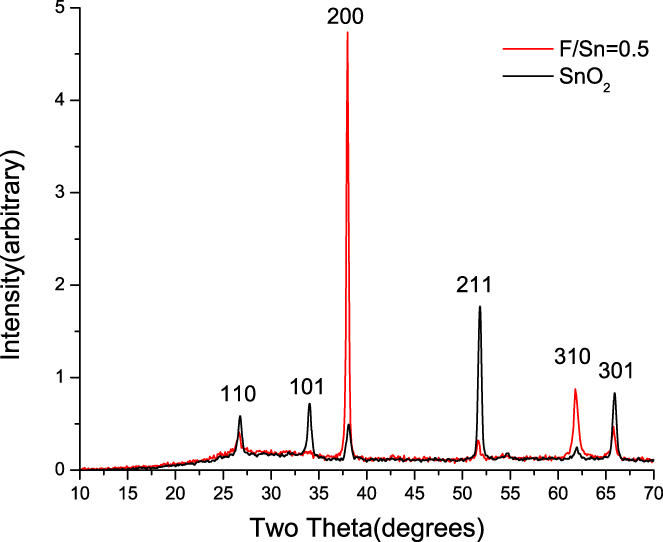
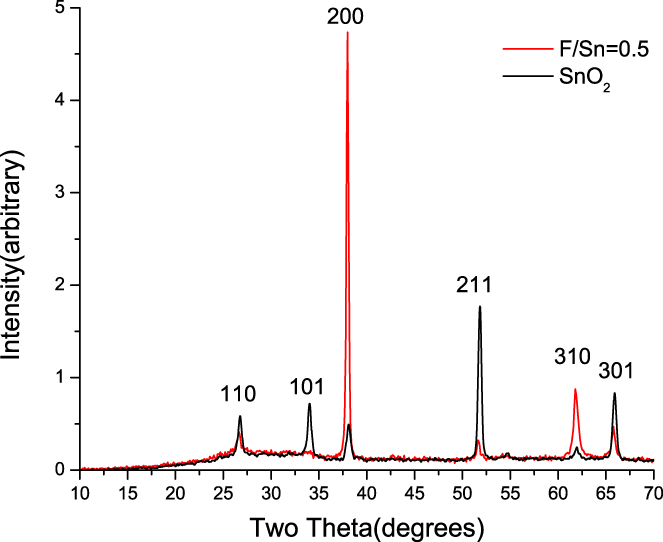
More intense peaks correspond to the (200) crystallographic plane. The exception is represented by films with F/Sn = 0, pure tin oxide film. In this case, the films present a preferred orientation in the (211) plane with other peaks in the (101), (110), and (301) planes. Thus, the presence of fluorine affects the grain orientations making it possible to obtain highly oriented films. A comparison between the XRD spectra for the film prepared using the solutions with F/Sn = 0 and F/Sn = 0.5 is shown in Fig. 2. Actually, the preferred orientation depends not only on the precursor solutions, as has been reported in tin oxide films prepared using CVD, but also on the film thickness.Reference Kim and Chun13
Comparison of the XRD spectra for the films prepared using the F/Sn = 0 and F/Sn = 0.5 ratios in the solution.
In this work, the films with a thickness of 500 nm and a grain size around 30 nm present a preferred orientation in the (110) crystallographic plane, independently from the F/Sn ratio used for the precursor solution.
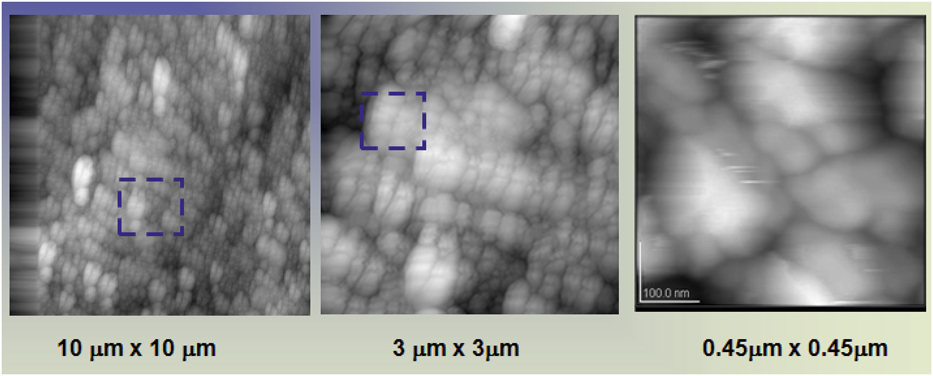
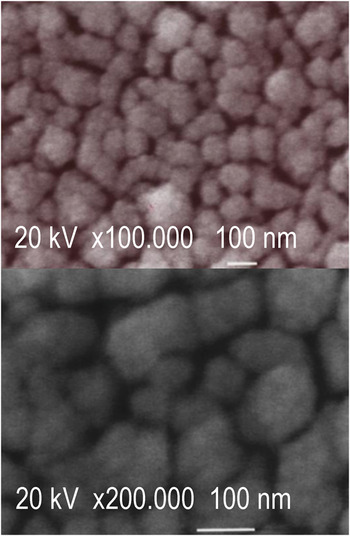
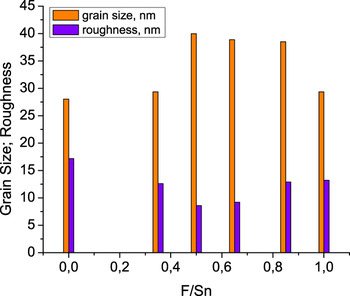
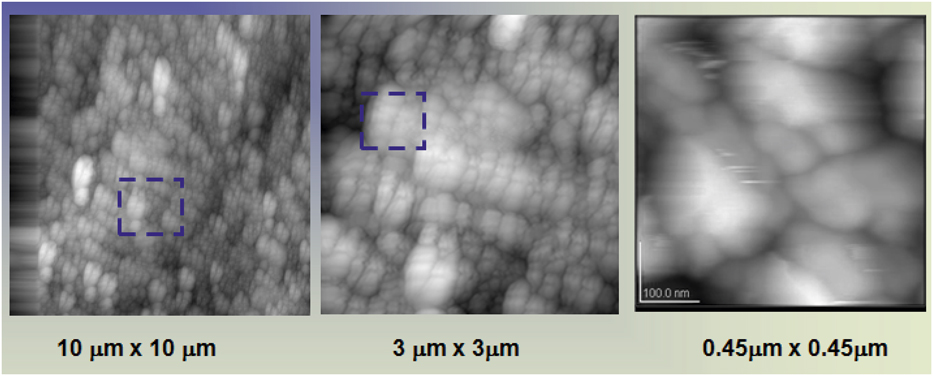
The grain size and the surface roughness were estimated from the analysis of AFM and scanning electron microscopy (SEM) measurements (Figs. 3 and 4, respectively). AFM images are presented for three different areas: 100, 9, and 0.2 μm2. The amplification of the SEM images is 105 and 2 × 10⁵. The mean size of the grains was also determined by the classical Debye–Scherrer formula using the full width at half maximum of the peak. Figure 5 shows the mean value of the grain size for the (200) plane and the root mean square (RMS) surface roughness of the FTO films for different F/Sn ratios. The highest grain size (40 nm) and smallest RMS roughness (8 nm) were observed for the films prepared using the precursor solution with the F/Sn = 0.5 ratio. The highest RMS roughness for the FTO films with 0.5–0.8 F/Sn ratios can be due to the etching of the films using gaseous HF formed by thermal decomposition of NH4F during the growth process.
AFM images of the FTO film prepared using the solution with a F/Sn = 0.5 ratio.
SEM images of the FTO film prepared using the solution with a F/Sn = 0.5 ratio.

Mean value of the grain size for the (200) plane and the RMS surface roughness for the FTO films with different F/Sn ratios.

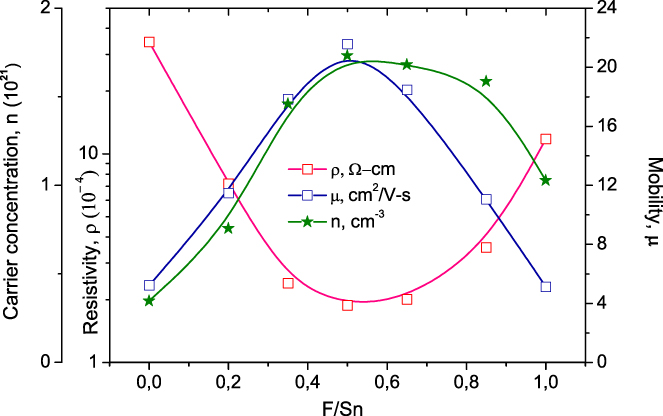
Figure 6 shows the dependence of the electrical resistivity (ρ), Hall mobility (μ), and carrier concentration (n) for the 494 ± 10 nm thick FTO films on different fluorine contents. The films fabricated using the precursor with a F/Sn = 0.5 ratio present the minimum of ρ = 2.2 × 10⁻⁴ Ω cm (or R s = 4.5 Ω/sq), μ = 21.6 cm2/V s, and n = 1.7 × 1021 cm−3, which corresponds to a strong degeneration of the electron gas in the conduction band (the calculated degeneration threshold of carrier concentration for the FTO films is 3.6 × 1018 cm−3 taking into account an effective electron mass of 0.33m0).Reference Shanthi, Banerjee and Chopra14
Dependence of the electrical resistivity (ρ), Hall mobility (μ), and carrier concentration (n) of the 494 ± 10 nm thick FTO films on the content of fluorine.
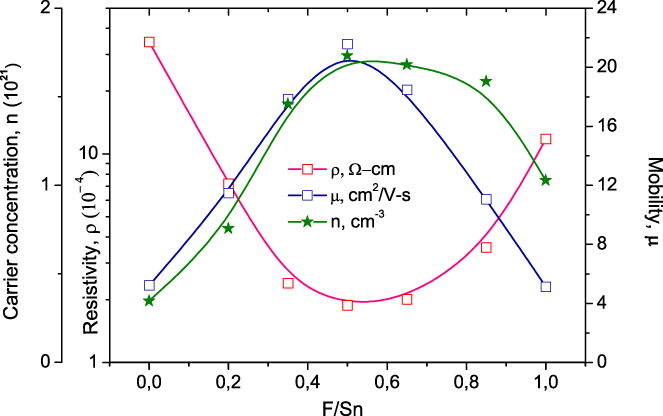
The increasing of μ and n for an increasing fluorine content can be explained due to the doping effect as well as the improvement of the film structure, whereas decreasing of these parameters can be explained as due to the formation inside the films of Sn–F dissipation neutral centers for the carriers and decreasing the oxygen vacations for a high F/Sn ratio. We presented a more detailed discussion of these phenomena in an early publication.Reference Martínez, Huerta, O-Rueda de León, Acosta, Malik and Aguilar11 The decreasing Hall mobility cannot be explained as due to variations of the grain boundary potential because of the high carrier concentration but can be explained by carriers scattering on neutral centers formed by the Sn–F bounds found by XPS measurements, as well as due to scattering by ionized impurities. The mean free path of conduction electrons has the same dependence as the carrier concentration and lies in the 0.8–1 nm range with a maximum of 5.3 nm for F/Sn = 0.5. Since the mean free path is considerably shorter than the grain size (30–40 nm), the resistivity of the films is determined by the ionized impurity scattering rather than by the grain boundary scattering.
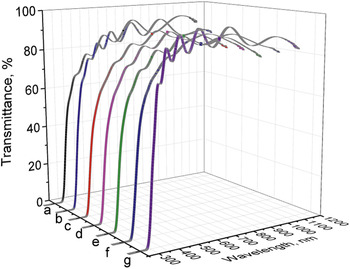
Figure 7 shows the transmittance of the 500 ± 20 nm thick FTO films deposited using the precursor solutions with different F/Sn contents on Corning glass substrates. The transparency of the films exceeds 80% in the visible spectral range. For a highly degenerated FTO films, the optical gap determined by the Fermi level location inside the conduction band presents a special interest because of a blue shift of the high energy photon absorption edge. This is known as the Burstein–Moss effect in which the lowest states in the conduction band are blocked, and the transitions of optically excited electrons take place only to energies above the Fermi level. This effect has practical applications for designing effective UV photodetectors where the FTO films work as a transparent conducting active electrode.Reference Malik, Sêco, Fortunato, Martins, Shabashkevich and Piroszenko15
Transmittance of the 500 ± 20 nm thick FTO films deposited on Corning glass substrates prepared using precursor solutions with different F/Sn contents: (a) 0; (b) 0.2; (c) 0.35; (d) 0.5; (e) 0.65; (f) 0.85; and (g) 1.0.

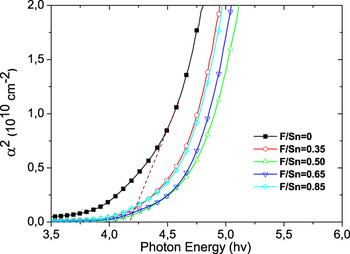
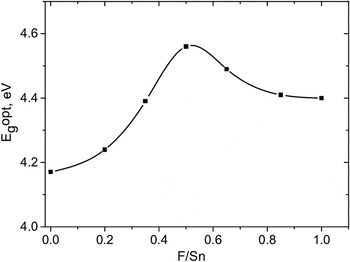
Figure 8 shows the absorption edge of the FTO films deposited on a sapphire substrate. The optical band gap (Fig. 9) was determined using the analysis of the absorption in the UV spectral range. It can be seen that the films with a F/Sn = 0.5 ratio present the optical energy gap of 4.6 eV due to a high value of the Burstein–Moss shift; these films could be used for designing different surface-barrier UV semiconductor photodetectors by increasing their conversion efficiency.
Absorption edge of the FTO films deposited on a sapphire substrate.

Optical band gap of the FTO films with different fluorine contents.

The importance of determining the FOM was mentioned earlier. In this work, both methods for the calculation of FOM or ϕ, proposed by Haacke (ϕH) and by Gordon (ϕG), as were described in Sec. I, were used. For using the Haacke method, the wave length of the transmittance must be in the visible spectral range, and more correctly, we must use an average value of the transmittance because a strong interference effect leads to an uncertainty in the calculation of the FOM reported by different authors at different wave length values.
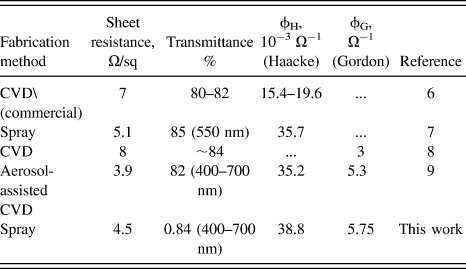
For the FOM evaluation using the Gordon method, the integrated values of the transmittance and reflectance in the visible spectral range must be used. These values are easy to determine by the integration of the visible part of the spectra obtained experimentally. Table I shows a comparison of the highest FOM values reported by different authors, and the results of this work are shown considering both methods.
Comparison of highest FOT values reported by different authors with those obtained in this work.
IV. CONCLUSIONS
In this work, FTO thin films were deposited by spray pyrolysis operating in a pulse mode at 450 °C. An alcoholic solution consisting of SnCl4·5H2O and NH4F with different F/Sn ratios was used as the precursor. For all the F/Sn ratios, from 0 to 1.0, the film structure was nanocrystalline. Films with a F/Sn = 0.35–1.0 ratio present a preferred grain orientation in the (200) crystallographic plane. The minimum sheet resistance, 4.5 Ω/sq (or resistivity of 2.2 × 10⁻⁴ Ω cm), the highest electron mobility of 21.6 cm2/V s, and a carrier concentration of 1.7 × 1021 cm−3 (corresponding to a strong degeneration of the electron gas in the conduction band), as well as a mean value of the transmittance of 0.84 in the visible spectral range, were obtained for the films fabricated using precursors with a F/Sn = 0.5 molar ratio. The FOM (38.8 × 10⁻³ Ω−1 and 5.75 Ω−1) for this film was analyzed using two methods, proposed by Haacke and Gordon, and is comparable to the highest value currently known. The determination of the FOM proposed by Gordon is more suitable for applications in thin film solar cells.
ACKNOWLEDGMENTS
This work was partially supported by CONACyT-Mexico under Grant No. 102397. Authors thank the technical staff at the Microelectronics Laboratory of INAOE.