
I. INTRODUCTION
We describe how a previously implemented simulator for the relaxation of epitaxial layer strain by misfit dislocations Reference Hull, Andersen, Parveneh and Bean1 can be used to predict relaxation pathways, to examine sensitivities to parameter variations, and to “fingerprint” dislocation nucleation mechanisms. The simulator integrates extensive experimental measurements of kinetic parameters that describe the nucleation and propagation of misfit dislocations with models for the critical thickness for dislocation introduction, the excess stress driving dislocation motion and nucleation, and dislocation interactions. In this paper, we focus on the Ge x Si1−x /Si(100) system due to the large body of experimental and theoretical work in this system, and its extensive application in high speed semiconductor devices and circuits, but we have also extended the simulator to the Ge x Si1−x /Si(110) and III-nitride systems. Reference Andersen and Hull2 The simulator combines descriptions of the kinetic processes of dislocation nucleation, motion, and interaction to simulate the system state at each stage of an epilayer growth or thermal annealing process.
II. OVERVIEW OF THE PROCESS SIMULATOR
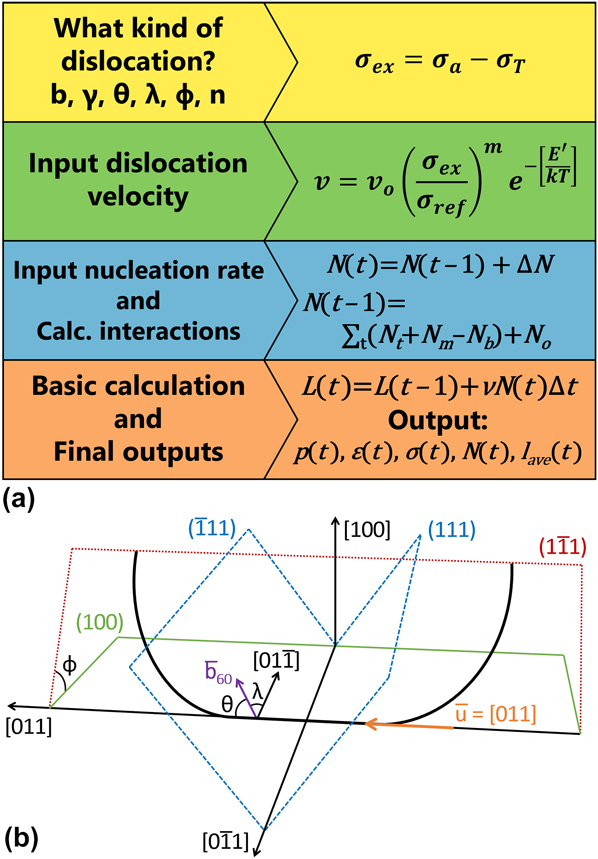
Figure 1(a) shows the architecture of the process simulator. It iteratively calculates the stress, strain, and dislocation populations during fixed intervals (typically one second, but adjustable by the user) of a growth or annealing cycle. The outputs are the excess stress (σex), the strain state of the film (ε), the average distance between misfit dislocations (p), the number of misfit dislocations (N), and the average misfit dislocation length (l ave) for each step in the simulation.
(a) Structure of the process simulator for prediction of the evolution of misfit dislocation arrays. (b) Schematic of the dislocation glide planes and a propagating dislocation, showing corresponding Burgers vector b
60
, line direction u, and relevant angles, ϕ, λ, and θ. Note that the
 $\left( {\bar{1}\bar{1}1} \right)$
plane has not been shown here for simplicity.
A. Dislocation energetics
The simulator must first calculate the operative dislocation type and net stress that drive the development of the misfit dislocation array. While for other systems multiple dislocation types can be operative, for the Ge x Si1−x /Si(100) diamond cubic system, the dislocation microstructure is assumed to be fixed to the expected a/2〈110〉 Burgers vector dislocations gliding on {111} planes inclined to the interface.
The basic descriptions of dislocation stability can be derived from foundational pieces of work by Van der Merwe and collaborators, who first described the “critical thickness” above which the growth of interfacial dislocations to relax the lattice-mismatch strain is energetically favored. Reference Van der Merwe3–Reference Van der Merwe5 This criterion was subsequently reformulated by Matthews and Blakeslee Reference Matthews and Blakeslee6–Reference Matthews and Blakeslee8 based on a stress analysis approach that balanced a resolved driving stress due to the lattice mismatch strain, σa, with the line tension of the misfit dislocation length created, σT. Subsequently, Dodson and Tsao Reference Dodson and Tsao9 defined the concept of “excess stress” that drives misfit dislocation kinetics, σex = σa − σT.
In the subsequent analysis, we assume an elastically isotropic cubic system, with linear elasticity outside of the dislocation core region (solutions for elastically anisotropic systems—e.g., Ref. Reference Coppeta, Holec, Ceric and Grasser10 for a recent treatment—have been derived, but these more rigorous solutions lack the mathematical simplicity for intuitive interpretation). In the a/2〈110〉{111} slip system of Ge
x
Si1−x
/Si(100), the {111} glide planes intersect the (100) interface along orthogonal in-plane [011] and
 $\left[ {0\bar{1}1} \right]$
directions. Each dislocation in the orthogonal interfacial array generally terminates with a “threading arm” connecting the end of the interfacial dislocation to the epilayer surface (although termination at the substrate edge or at a junction with another dislocation is also possible). This configuration is shown in Fig. 1(b). We do not incorporate the elastic response of the substrate, as epitaxial layer thicknesses are typically two-to-five orders of magnitude less than the substrate thickness and thus the rigid substrate approximation is appropriate.
For a pre-existing dislocation that crosses the film substrate interface (“threading dislocation”), the excess stress acting on the dislocation is
 $${\sigma _{{\rm{ex}}}} - {{2G\left( {\cos \phi \cos \lambda } \right)\varepsilon \left( {1 + \nu } \right)} / {\left( {1 - \nu } \right)}} - \left[ {{{Gb\cos \phi \left( {1 - \nu {{\cos }^2}\theta } \right)} / {4\pi h\left( {1 - \nu } \right)}}} \right]\ln \left( {{{\alpha h} / b}} \right)\quad .$$
The first term in this expression is the applied shear stress, σa, as resolved onto the dislocation threading arm due to the lattice mismatch strain, and the second term is the line tension, σT, due to the self-energy of the extra interfacial line length created. If σex ≤ 0, then the critical thickness for introduction of interfacial misfit dislocations is not exceeded because the self-energy of any interfacial line length created exceeds the strain energy relaxed in the epilayer, and thus extension of an interfacial misfit dislocation is not energetically favored. If σex > 0, then the strain energy relaxed in the epilayer exceeds the self-energy of the interfacial dislocation line length created, and extension of the interfacial misfit dislocation is increasingly energetically favored with increasing magnitude of the excess stress.
In Eq. (1), G is the epilayer shear modulus, ν is the Poisson ratio, h is the epitaxial film thickness (which is fixed during an annealing sequence but varies during epilayer growth), b is the magnitude of the dislocation Burgers vector, α is a factor that describes the electronic and non-linear elastic energy contributions within the misfit dislocation core region, θ defines the angle between the misfit dislocation Burgers vector and line direction, and cos ϕ and cos λ resolve the biaxial stress onto the dislocation slip plane and Burgers vector, respectively. The instantaneous lattice mismatch strain between a film and substrate, ε, is 0.042x for coherently strained Ge x Si1−x on Si at a characteristic growth temperature of 550 °C but continuously decreases as the misfit dislocation array develops.
Note that we do not include the effects of differential thermal expansion coefficients between Ge x Si1−x and Si in our analyses because the resulting strains are typically more than an order of magnitude less than the effects of lattice mismatch, except in the limits of a very high temperature and low residual strain. The effects of thermal mismatch would become more relevant in the high temperature growth of very thick epitaxial layers, for example. However, at these temperatures, other mechanisms begin to become relevant that are also not considered in the simulator. These include dislocation climb Reference Re, Scalese, Mirabella, Terrasi, Priolo, Rimini, Berti, Coati, Drigo, Carnera, De Salvador, Spinella and La Mantia11 and thermal diffusion of Ge across the SiGe/Si interface, which causes interface roughening Reference Liu, Kong, Liu, Li, Huang, Li and Sun12 and diffusion induced layer relaxation. Reference Hollander, Mantl, Stritzker, Jorke and Kasper13 Such effects become significantly more relevant at temperatures above 800 °C and at a higher initial lattice mismatch strain.
B. Dislocation kinetics
The primary kinetic misfit dislocation processes considered are nucleation, propagation, and interaction. The descriptions of these processes are generally of three types:
-
(i) Type I processes that are thermally activated and that can be described by equations of the form
 $$R = {R_{\rm{o}}}{\left( {{{{\sigma _{{\rm{ex}}}}} / {{\sigma _{\rm{r}}}}}} \right)^m}{{\rm{e}}^{ - \left[ {{{E'} / {kT}}} \right]}}\left[ {{\rm{unit}}\;{\rm{time}}} \right]{^-}{^1}\left[ {{\rm{unit}}\;{\rm{dimension}}} \right]\quad {\rm{,}}$$
where E′ is the activation energy for the given process, T is the epilayer growth or annealing temperature, σr is a reference stress (generally 1 Pa in our formulations), and m is a power index. Here, we use this form for thermal (“homogeneous”) nucleation (N t, s−1m−2) and propagation (v, ms−1) of misfit dislocations, the latter is based on the formulation extensively tested for dislocation glide in bulk deformation of Si and Ge (e.g., Refs. Reference Alexander and Haasen14–Reference Yonenaga16).
(ii) Type II processes that depend on an initial fixed value. In the simulator, this corresponds to an existing “heterogeneous” dislocation source density (N o, m−2) that is immediately activated upon the excess stress exceeding zero.
(iii) Type III processes that depend on the existing network of misfit dislocations, f(ρ). The relevant mechanisms in the simulator are dislocation multiplication Reference Hagen and Strunk17–Reference Rzaev, Schaffler, Vdovin and Yugova19 (N m, s−1m−2), which is assumed to be proportional to the number of intersections of a propagating dislocation with pre-existing orthogonal dislocations (e.g., via the Hagen–Strunk mechanism: Ref. Reference Hagen and Strunk17), and dislocation blocking, whereby the interaction stress between a propagating dislocation and a pre-existing orthogonal dislocation may overcome the excess stress and arrest motion (e.g., Refs. Reference Hull and Bean20–Reference Stach, Schwarz, Hull, Ross and Tromp22). This leads to a density of blocked dislocations (N b, m−2) that is lost from the growing dislocation population.
For a given system, the magnitude of σex is defined by h and ε. For a variable composition alloy epilayer, such as Ge x Si1−x , the initial value of ε in a growth sequence is proportional to the compositional variable x but monotonically decreases for growth beyond the critical thickness until it asymptotically approaches zero at sufficiently large layer thicknesses. Footnote a The epilayer thickness h is either constant during an annealing cycle or is given by the product of growth rate and time, gt, for a growth sequence. These parameters, together with growth temperature T, define not only the instantaneous kinetics for Type I processes but also the density of the dislocation arrays relevant to Type III processes. To describe Type II variables, we simply add the parameter, N o, to the nucleation density determined by thermally activated and multiplication processes. Thus, the primary independent variables that control the rate of development of the dislocation array are h, t, T, x, and N o (for a growth sequence, the growth rate could substitute for h).
C. Operation of the simulator
We summarize here the mechanics of the simulator, following the structure of Fig. 1(a). Full details, including the constitutive equations and material parameters used are given in Ref. Reference Hull, Andersen, Parveneh and Bean1 and the associated Supplementary Material. The simulator, “RelaxII” is available online. Footnote b
-
(i) Yellow box in Fig. 1(a). The simulation is initialized for a growth (composition, temperature, growth rate, and default initial thickness of zero) or an annealing (epilayer thickness, composition, temperature, initial dislocation density, and spacing) sequence. The system iteratively calculates the dislocation system state, as described below, for default intervals of one second (which corresponds to 1 Å for the default growth rate). Note that all default values indicated in this section can be changed by the user.
-
(ii) Green box in Fig. 1(a). At each simulation interval for which σex > 0 (i.e., h > h c for growth), the simulator evaluates the extension velocity of interfacial dislocations, according to the Type I description of Eq. (2). The parameters R o, m, and E′ may be entered by the user or may be set to our default file values, which use a description derived from our extensive sets of measurements from in-situ Transmission Electron Microscopy (TEM). Reference Hull, Bean, Bahnck, Peticolas, Short and Unterwald23,Reference Hull and Bean24 Similar data sets have been generated by other groups using related or different methods (e.g., Refs. Reference Tuppen and Gibbings25 and Reference Houghton26).
-
(iii) Blue box in Fig. 1(a). The simulator next calculates the mobile dislocation population N(t) by adding the number generated during the calculation interval ΔN to the mobile population in the previous calculation increment, N(t − 1), i.e., N(t) = N(t − 1) + ΔN. Using the terms described above, N(t − 1) is given by the sum of dislocations generated by homogeneous nucleation, multiplication, and heterogeneous nucleation minus the number of dislocations which become immobile due to blocking interactions, i.e., N(t − 1) = ∑t(N t + N m − N b) + N o. The increment ΔN is given by the additions to the mobile dislocation population during the calculation increment, ΔN = N t + N m.
The heterogeneous source density, N o, is entered by the user. This value does not imply a specific nucleation source type but instead represents the possible set of different heterogeneous sources of dislocation nucleation, whose activation energy is low enough that the source population effectively activates immediately upon reaching the critical thickness. This set might include pre-existing dislocations from the substrate, substrate imperfections, growth defects, and impurities, for example. The thermally activated source density, N t, can either be described by user-entered parameters for R o, m, and E′ or by a fit to experimental data from the literature Reference Houghton26,Reference Yuan and Thesis27 (used throughout as ‘file values’ with values of R o = 5.5 × 10⁻²⁷ s−1m−2, m = 5, and E′ = 1.84 eV) as described in the Supplementary Material of Ref. Reference Hull, Andersen, Parveneh and Bean1. While the thermal nucleation source is generally described as arising from homogeneous nucleation of dislocations, the delineation from possible higher activation energy heterogeneous sources is not absolute, so the nucleation parameters here also span a set of possible sources. N m is currently calculated based on the number of intersections of mobile dislocations with pre-existing orthogonal dislocations per unit time per unit area, with user entered values for the number of new dislocations generated per intersection event, and the epilayer thickness at which such multiplication events initiate. To determine if dislocation blocking is occurring, an inter-dislocation interaction stress between orthogonal dislocations is calculated. If this stress counterbalances the excess stress on the propagating dislocation, mobile dislocations arrest upon growing to a length where they would, on average, intersect with a pre-existing orthogonal dislocation. In this manner, a population density of blocked dislocations (N b) may be calculated based on the current state of the dislocation array (l ave and p). In our current models, this pinning is permanent for an annealing configuration, but for growth, the dislocations are assumed to unpin once the epilayer thickness increases to the point where the excess stress again dominates the dislocation interaction stress. Relevant equations and details are provided in Ref. Reference Hull, Andersen, Parveneh and Bean1 and its Supplementary Material.
In principle, the blocking criterion can reapply in the very latest stages of relaxation as the excess stress asymptotically approaches zero with the system approaching its equilibrium state. Related work hardening effects are also expected to play a significant role but are not incorporated into the current version of RelaxII. Such effects are caused by the motion of dislocations in the advanced stages of relaxation through a very high pre-existing density of dislocations, such that dislocation threading arm interactions and reduction in driving force through local over-relaxation become more frequent. Such processes have been considered or commented on by several authors (e.g., Refs. Reference Willis, Jain and Bullough28 and Reference Gillard, Nix and Freund29). Additionally, as dislocation densities increase, it becomes more likely that dislocations may annihilate, and thus reducing the threading dislocation density, thereby reducing the relaxation rate. Reference Kujofsa, Cheruku, Yu, Outlaw, Xhurxhi, Obst, Sidoti, Bertoli, Rago, Suarez, Jain and Ayers30 Since the simulator’s calculations are performed at a continuum level, it is not able to track individual threading arms, though it is possible that with knowledge of not only the average dislocation spacing but also the relative distribution of spacings that one could calculate the probability of threading arms interacting as the dislocation array densified. This may be a focus of future simulator development.
-
(iv) Orange box in Fig. 1(a). The simulator then calculates the system state at each calculation interval, according to the calculation
 $$L\left( t \right) = L\left( {t - 1} \right) + \nu N\left( t \right)\Delta t\quad ,$$
where L(t) is the total misfit dislocation line length per unit area at time t and Δt is the calculation interval. Threading arms are not considered as a part of the total dislocation length, as the layer thickness is generally much thinner than the average interfacial dislocation length, and only a small component of the threading arm as projected into the interface can contribute to strain relief. The instantaneous epilayer strain ε(t) and the average linear dislocation spacing p(t) may be derived directly from L(t) according to
 $$p\left( t \right) = {2 / {L\left( t \right)}}\quad ,$$
 $$\varepsilon \left( t \right) = {\varepsilon _{\rm{o}}} - \left[ {{{b\cos \lambda } / {p\left( t \right)}}} \right]\quad .$$
In Eq. (4a), the factor two accounts for the fact that the generated line length is divided into two orthogonal arrays of dislocations. We note that the assumption of a single value of p, compared to the more realistic case of a distribution of dislocation spacings, has been shown to lead to different values for the dislocation array energy when interfacial dislocation interaction energies are taken into account. Reference Jain, Jain, Nijs, Willis, Bullough, Mertens and Van Overstraeten31 The average misfit dislocation length l ave(t) can be derived from N(t) and L(t), according to
 $${l_{{\rm{ave}}}}\left( t \right) = {{L\left( t \right)} / {N\left( t \right)}}\quad .$$
Any combination of these parameter sets may be generated and stored by the simulator during a growth or annealing sequence, as selected by the user.
III. BRIEF COMPARISON TO OTHER LITERATURE MODELS
The simulator architecture as described above treats the dislocation array as an ensemble and predicts its average properties rather than the properties of any individual defects. Other models which have applied this approach include the work of Houghton Reference Houghton26 who measured Arrhenius rates of dislocation nucleation and velocity (i.e., Type I processes) and combined them with a dislocation source term (Type II process) to predict relaxation rates in (Si)/Ge x Si1−x /Si(100) heterostructures. Type III processes of dislocation multiplication and dislocation interactions were not included. Menendez Reference Menendez32 extended this approach, incorporating dislocation interactions. Gosling et al. Reference Gosling, Jain and Harker33 incorporated all the major dislocation mechanisms described above, based on the development of full half-space models for the dislocation self-stresses and interaction events. While detailed and rigorous, their formulations do not appear to lend themselves as readily to the separation of the effects of different dislocation mechanisms to the degree of our current approach, which is important to our sensitivity and “finger-printing” analyses described later. An alternate approach is to predict the overall relaxation process based on the summation of simulations of individual dislocations, i.e., discrete dislocation dynamics (DDD) methods (e.g., Refs. Reference Stach, Schwarz, Hull, Ross and Tromp22 and Reference Tan and Sun34–Reference Fertig and Baker36). Such approaches are particularly powerful at providing mechanistic insight into specific dislocation configurations (e.g., Refs. Reference Stach, Schwarz, Hull, Ross and Tromp22 and Reference Schwarz37), whose information is essentially absent in continuum models such as this current work. However, the relative simplicity and lower computational cost of such continuum models lend themselves more readily to realizing efficient predictive tools.
IV. APPLICATION AND CALIBRATION OF THE SIMULATOR
A. Overview
The simulator’s capabilities can be assigned into four modes:
The first is “Descriptive”. This describes how the simulator captures the fundamental mechanisms that govern the generation of the misfit dislocation array. Updates or revisions to the Descriptive capability generally require significant revision to the simulator code.
The second is “Predictive”, which describes how accurately the simulator can predict relaxation pathways and endpoints within a given system. Typically, this is assessed through comparison to existing experimental data sets, as will be seen below. It will depend upon the extent and accuracy of the initial data used to define the governing kinetic equations in the simulator (e.g., Type I descriptions of dislocation nucleation and propagation), the validity of the simulator models and architecture that defines the Descriptive capability, and how universal such descriptions are across different process parameters and systems (much anecdotal evidence suggests that nucleation mechanisms can be growth system dependent, for example, in the heterogeneous source density). Differences between experiment and prediction can inform the existence of possible mechanistic differences, as discussed later in this section. In our simulator architecture, predictive accuracy can be updated by individual users, based on comparison to specific data sets of most relevance to them (e.g., from their own growth chambers).
The third is “Exploratory”, which enables examination of the effects of different fundamental mechanisms (or of different weightings between them, for example, the relative magnitudes of heterogeneous, homogeneous, and multiplicative mechanisms in dislocation nucleation, which are known to be highly sensitive to film, growth, and chamber parameters) upon the relaxation pathway. We discuss later in this manuscript the possible use of “dislocation fingerprinting”—simultaneous assessment of multiple descriptors of the dislocation array to illuminate the operative fundamental mechanisms. More colloquially, this could be described as a “What If?” capability of the simulator.
The fourth is “Transportability”, which describes how well the simulator architecture can be extended to other epitaxial materials systems. The Transportability is determined by the degree to which the models and architecture have to be updated for the new system (e.g., different dislocation types, glide systems, and geometrical configurations) and how much new data need to be incorporated (e.g., for dislocation nucleation and propagation rates) to establish Predictive capability. This aspect was a focus of our previous work in Ref. Reference Hull, Andersen, Parveneh and Bean1 (where we applied a Bayesian-like analysis to infer quantitative descriptions of dislocation nucleation rates from inverse comparison of predicted and experimental relaxation pathways) and Ref. Reference Andersen and Hull2 (where we made initial extensions to the AlGaN/GaN system).
The major focus of this paper is the inter-relationship between the Descriptive, Predictive, and Exploratory capabilities, to inform process design and sensitivity and to infer the possibility of unexpected or competing fundamental mechanisms.
B. Example simulator outputs
The outputs of the simulator illustrate the state of the dislocation microstructure at any time during annealing or at any thickness during growth. In terms of the overall relaxation state of the system, we generally plot either the residual strain, ε, or the average spacing between dislocations, p. Most typically, we use the latter parameter as it is substantially more sensitive to the initial stages of relaxation.
For a growth sequence, ε is initially set to the initial lattice mismatch strain, εo, defined by the difference between epitaxial layer and substrate lattice parameters, and remains at that value until the critical thickness is reached. It then decreases monotonically until it asymptotically approaches zero in the limit of infinite layer thickness. For finite thickness, its lowest possible (equilibrium) value is given by setting σex to zero in Eq. (2) for the given value of h and solving for ε. In practice, the dislocation kinetics (e.g., insufficient time to reach equilibrium) and interactions between dislocations (e.g., dislocation threading arm entanglement) limit the relaxation to a higher value of ε. The value of p is in principle initially infinite (no dislocations in the interface); in practice, it is initialized to a value of 1 m at the start of growth and then starts to monotonically decrease when the critical thickness is exceeded. The asymptotic limit is defined by the relation p = b cos λ/εo, but again dislocation kinetics and energetics limit this to a higher value for finite growth thicknesses.
For an annealing sequence, the initial values of ε and p are calculated from user-defined parameters to set the initial relaxation state of the system. Assuming that the epitaxial layer thickness is greater than the critical thickness (otherwise there is little purpose to the calculation!), p and ε monotonically decrease toward their asymptotic limits, but again with values defined in practice by the dislocation kinetics.
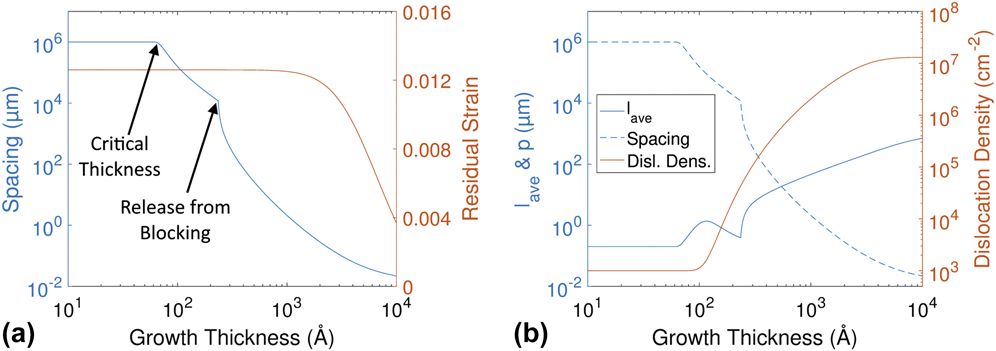
Example simulator outputs are shown in Fig. 2. Figure 2(a) shows how p and ε vary during a 1 µm growth of Ge0.3Si0.7 at 550 °C. Notice that for several orders of magnitude change in the dislocation spacing, relatively little strain relaxation occurs, at least on a linear scale. There are two distinct discontinuities in the slope of p versus h. The first occurs at the critical thickness, where dislocations first become energetically favorable. In the initial growth regime above the critical thickness, the magnitudes of inter-dislocation stresses are larger than the excess stress, prohibiting orthogonal dislocations from crossing, and thus limiting relaxation kinetics due to these blocking events, N b. The second discontinuity then occurs at the thickness where the interaction stress becomes less than the excess stress, as described previously.
(a) Plot of average dislocation spacing and residual strain during growth for x = 0.3, T = 550 °C, g = 0.1 nm/s, N o = 1000 cm−2, and N t set to file values. (b) Evolution of average dislocation length (l ave), average dislocation spacing (p), and the total density of dislocations (N) for the same growth. Note the rapid changes in the average dislocation length at the two critical points labeled in (a).
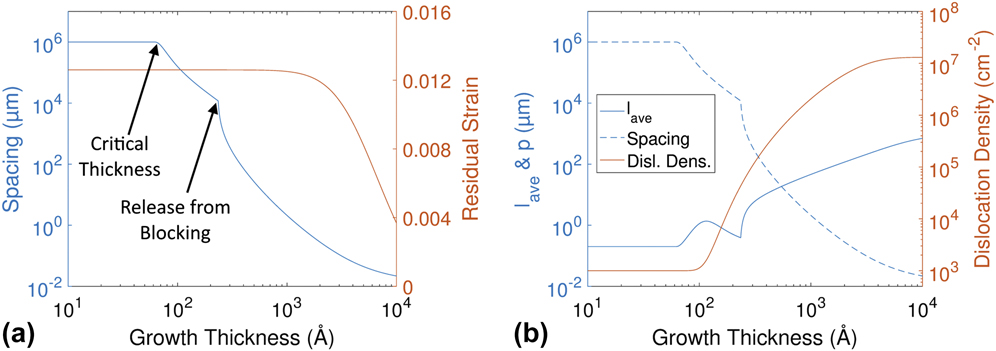
Figure 2(b) shows how the complete set of dislocation parameters p, N, and l ave evolve during growth. Their evolution may be summarized as follows: before the critical thickness for relaxation is reached, none of the pre-existing dislocations can grow. After this thickness is exceeded, existing dislocations begin to grow, increasing the total dislocation line length and reducing the average spacing between dislocations. Increasingly with film thickness, the excess stress grows and homogeneously activates the nucleation of larger numbers of dislocations. However, in the initial growth beyond the critical thickness, dislocation blocking is occurring. This leads to a larger number of small dislocations, and the corresponding drop in average length is shown in Fig. 2(b). Finally, the dislocations release from blocking, leading to a rapid increase in average length and a corresponding drop in the spacing. The dislocation count rises monotonically, since our simulator does not currently incorporate the removal of dislocations through combination or reaching the edge of the wafer. The rate of thermal nucleation (i.e., the gradient of the N–h curve) decreases at large epilayer thicknesses, by which time large amounts of the initial lattice mismatch strain, and the corresponding excess stress is relaxed.
C. Comparisons to literature data
By comparing the simulator output to published data of relaxation pathways in Ge x Si1−x /Si(100) heterostructures, we can assess the Predictive capability and its relationship to Descriptive and Exploratory capabilities. We provide three comparisons to the literature data here: two for growth and one for annealing sequences, and one each for the experimental output based on interfacial dislocation spacing, p, instantaneous strain, ε, and epilayer lattice parameter along the film normal, a 100 (the experimental data points shown here are extracted from the relevant plots in the original references). These examples illustrate both regimes of good match between simulator and experiment, and examples where the difference between simulator predictions and experimental results appear to indicate the existence of hitherto unconsidered mechanisms.
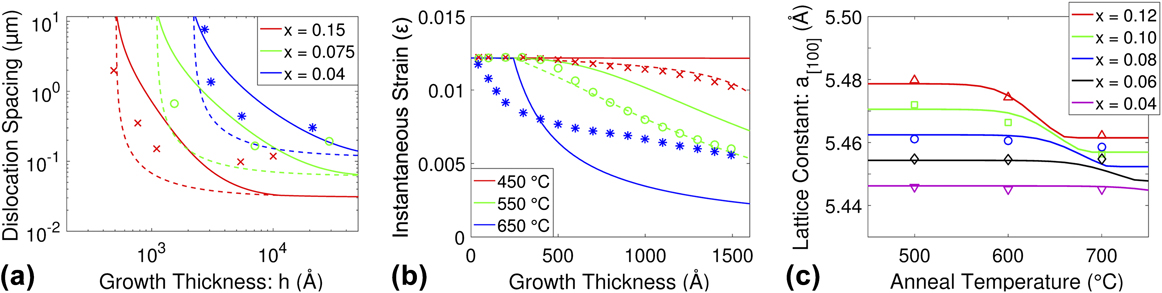
Figure 3(a) shows the comparison between simulated curves and experimental data from a seminal paper by Kasper et al. Reference Kasper, Herzog and Kibbel38 These data were collected through the TEM analysis of the dislocation spacing for films grown at several different thicknesses and compositions at a growth temperature of 750 °C and a growth rate of 0.4 nm/s, as described in the paper. The other key parameter is the heterogeneous source density N o. This value can be expected to vary substantially between different growth methods, growth systems, and growth conditions. The simulations shown in Fig. 3(a) correspond to a value of 106 cm−2 which may be rather high for current state-of-the-art growth methods but appears plausible for experiments performed about four decades ago. We note that in several papers comparing simulation to experiment, N o is treated as a fitting parameter varying by many orders of magnitude when comparing simulations to different data sets, with generally higher values at lower growth temperatures (see, e.g., Ref. Reference Menendez32). In this work, while we do vary the value of N o between different comparison data sets, we do so by less than two orders of magnitude and we present simulations within a data set using the same value of N o (although we may subsequently adjust the value in additional curves presented, as described explicitly for each data set comparison). We show two sets of simulated curves, corresponding to our extensive sets of dislocation velocity measurements derived from post-growth annealing in the TEM Reference Hull, Bean, Bahnck, Peticolas, Short and Unterwald23,Reference Hull and Bean24 of samples grown by Molecular Beam Epitaxy (MBE) and to a much more limited set (due to experimental complexity) of measurements made during UHV-CVD (ultra-high vacuum chemical vapor deposition) growth in a unique TEM equipped with in situ disilane and digermane growth capabilities. Reference Stach, Hull, Tromp, Reuter, Copel, LeGoues and Bean39 The essential difference between the two configurations is that for the former there is a native oxide on the surface of the epitaxial layer and for the latter there is not. The latter velocities are observed to be typically 5–10× lower than the former (see Refs. Reference Hull, Andersen, Parveneh and Bean1 and Reference Stach, Hull, Tromp, Reuter, Copel, LeGoues and Bean39 for quantitative descriptions). It seems logical to conclude that the latter set of velocities are relevant to growth simulations and the former are to anneal sequences. However, as illustrated in Fig. 3(a) and observed in the majority of our Predictive comparisons, the match is somewhat better if the “anneal” velocities are also used during growth. This may be because the “annealing” velocity set is far more extensive than the “growth” velocity set (and compares well with similar measurements in the literature Reference Hull, Kasper and Lyutovich40 ) and is therefore ultimately more accurate. It may also be because there is some inherent, hitherto unrealized fundamental difference between relaxation mechanisms during growth versus during post-growth annealing (or even between CVD and MBE growth methods). A fascinating hint of such a difference was from the work by Whaley and Cohen Reference Whaley and Cohen41 where they observed, using in situ Reflection High Energy Electron Diffraction (RHEED) measurements during the MBE growth of InGaAs/GaAs(100), that relaxation essentially halted during interruption of growth, but with the sample maintained at growth temperature. This is inconsistent with the Dodson-Tsao model of excess stress (and motivated our experiments in Ref. Reference Stach, Hull, Tromp, Reuter, Copel, LeGoues and Bean39). In summary, while the Predictive capability in Fig. 3(a) is quite gratifying, perhaps the more important message is that such Predictive comparisons highlight potentially fascinating gaps in Descriptive capability and provide opportunities for new mechanisms (or at least gaps in understanding of existing mechanisms) to be potentially revealed.
(a) Comparison of the simulated outputs to TEM spacing data from Kasper et al. Reference Kasper, Herzog and Kibbel38 for several growth compositions. Solid lines represent simulations using growth velocities, and dashed lines represent simulations using anneal velocities (see text for further details). Growths are all at 750 °C, g = 4 Å/s, N o = 106 cm−2, and N t set to file values. (b) Comparison of the simulated outputs to strain data extracted from wafer curvature measurements from Floro et al. Reference Floro, Chason and Lee42 Growth and simulation parameters are x = 0.29, g = 0.6 Å/s, N t set to file values, and use of anneal velocities. Solid curves: N o = 105 cm−2. Dashed curves: 450 °C − N o = 8 × 106 cm−2, and N m generating 1 new dislocation per 125 intersection events. 550 °C − N o = 2 × 106 cm−2. (c) Comparison of the simulated outputs to out of plane lattice parameter for varying anneal temperatures (at fixed annealing time of 1 h) and compositions for 400 nm thick layers from data of Yaguchi et al. Reference Yaguchi, Fujita, Fukatsu, Shiraki and Ito43 Note: (a–c) experimental data points are color coordinated to their respective simulated curves.
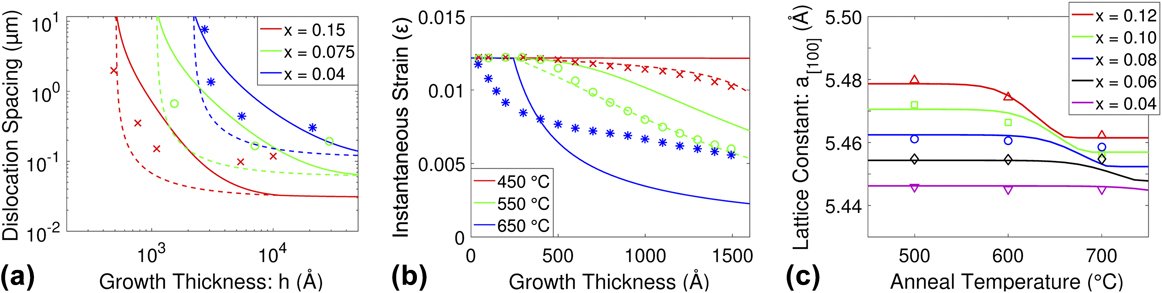
Figure 3(b) shows a comparison between simulations and measurements of instantaneous strain using wafer curvature during the growth of Ge0.29Si0.71/Si(100) at three different growth temperatures from Floro et al. Reference Floro, Chason and Lee42 The simulation parameters extracted from the reference are given in the figure caption, with an initial heterogeneous source density, N o, of 105 cm−2. We again found an overall better fit to the data using the “annealing” velocity data set, as indicated above. Using these standard parameters, the comparison between the simulated and experimental data at 550 °C shows a similar shape of the relaxation curve, but the simulation underestimates the magnitude of the strain relaxation by about 15% of the full range of ε (this corresponded to a difference of order 2–3× in the average dislocation spacing, p). At the initial simulation curve showed no significant strain relaxation, due to suppression of homogeneous (thermally activated) sources. However, if we increase the source density (in this case to 8 × 106 cm−2) and introduce a limited amount of dislocation nucleation by multiplication (0.008 new dislocations on average per dislocation intersection), then the simulation matches the experiment very well. The tendency for higher values of N o at lower growth temperatures from simulation-experimental comparisons in the literature has already been alluded to above. The need to invoke multiplication to match to this particular set of data would be consistent with the concept that when a higher excess stress persists to greater layer thicknesses (as the relaxation is relatively slow at this low temperature), new stress-activated multiplication mechanisms are activated. At this stage, this is only speculation but illustrates the ability to pose such questions through comparison of experiments with the simulation predictions. Finally, at 650 °C, the simulation initially relaxes more sluggishly than the experimental data, and then accelerates to reach lower final strains at the higher epilayer thicknesses. In the simulation, any significant strain relaxation is delayed until about 25 nm film thickness. This is partly due to the critical thickness (around 6.5 nm at this Ge composition) and partly due to the initial blocking regime. In comparison, the experimental data show rapid initial strain relaxation (even apparently somewhat before the critical thickness, perhaps due, in part, to difficulty in accurately extracting data points in superimposed curves with noise in the original figure). We posit that this initial rapid decay—compared to the simulation—illustrates less propensity for blocking at this temperature. This could be due to the fact that we simulate this process on an energetic basis alone—i.e., if the dislocation interaction stress is greater than the applied stress on the propagating dislocation, then motion stops at the dislocation intersection. However, if the resultant pinning energy is modest (i.e., if the interaction stress only moderately exceeds the excess stress), then there would be an increasing propensity to unpin due to increasing thermal energy at higher temperatures, hence the apparent reduced effects of the blocking regime at higher temperatures. We also posit that the lower final strain in the simulations compared to experiment is due to the “work hardening” effects, discussed previously, that are absent from our simulation. Again, we recognize that these posited mechanisms are speculation but are hypotheses that can be generated by comparing experiment to simulation.
Finally, Fig. 3(c) shows comparison to a comprehensive set of annealing data from Yaguchi et al. Reference Yaguchi, Fujita, Fukatsu, Shiraki and Ito43 showing the Ge x Si1−x epilayer lattice parameter along the growth normal, as measured using the X-ray rocking curve analysis. The corresponding out-of-plane strain ε⊥ is related to our definition of instantaneous strain by
 $${\varepsilon _ \bot } = {{\left( {1 + \nu } \right)} / {\left( {1 - \nu } \right){{{\varepsilon _{\rm{o}}} - 2\nu } / {\left( {1 - \nu } \right)\left( {{\varepsilon _{\rm{o}}} - \varepsilon } \right)}}}}$$
(compare to Eq. (1) in Ref. Reference Bai, Nicolet, Chern and Wang44). Yaguchi et al. performed a range of isochronal (1 h) anneals for different layer compositions, originally grown to around 400 nm at 500 °C with a growth rate of 0.1 nm/s. In this case, the experimental annealing kinetics are captured gratifyingly well by the simulator.
V. PARAMETER AND SENSITIVITY ANALYSIS
A. Overview
Having examined the Predictive capabilities of the simulator, we now extend it to parametric studies of strain relaxation in the Ge x Si1−x /Si(100) system. Figures 4 and 5 show the dislocation spacing and normalized strain (instantaneous strain to initial lattice mismatch strain, ε/εo) for constant epitaxial film thicknesses for a Ge x Si1−x layer grown with a varying composition and growth rate (Fig. 4) and a varying composition and temperature (Fig. 5). The plots represent the final strain and spacing state for a Ge x Si1−x /Si(100) layer grown to a thickness of 30 nm [Figs. 4(a), 4(c), 5(a), and 5(c)] or a thickness of 300 nm [Figs. 4(b), 4(d), 5(b), and 5(d)]. Thus, each point on the surface represents an independent simulation of a growth process. The relevant simulation parameters are given in the figure captions; note that in these simulations we use a relatively low value of N o = 103 cm−2, such that the nucleation response is not dominated by this term. There are three broad regimes within each plot. In Regime I, little to no relaxation has occurred, and the layer is still almost fully strained. This regime is depicted in yellow (color online) in the plots and corresponds to lower values of composition and temperature and to some degree, higher growth rates. In Regime II, the layer is nearly completely relaxed and is represented in dark blue (color online). In this regime, no amount of extra time or temperature can produce any additional appreciable relaxation. Regime III is the transition regime between Regimes I and II, in which the layer is partially relaxed, and where small changes in the growth parameters can lead to significant changes in the resultant strain and dislocation spacing. It is within Regime III that the final structure has the greatest sensitivity to small fluctuations in growth parameters and also where the simulator is most sensitive in its Descriptive and Predictive aspects.
Normalized final strain (a, b) and spacing (c, d) plots for varying composition and growth rate after 30 nm (a, c) and 300 nm (b, d) of growth, with T = 650 °C, N o = 1000 cm−2, and N t set to file values.

Normalized final strain (a, b) and spacing (c, d) plots for varying composition and growth temperature after 30 nm (a, c) and 300 nm (b, d) of growth, with g = 1 Å/s, N o = 1000 cm−2, and N t set to file values.

B. Parametric analysis
Figure 4 (x–g versus ε and x–g versus p plots) shows the expected behavior that increasing the composition increases the amount of strain relaxation for a given layer thickness. From the spacing plots, the critical composition for dislocation induced relaxation in a layer of fixed thickness can be easily seen from the sharp line of discontinuity between Regimes I and III [arrow 1 in Fig. 4(c), for example]. For the 30 nm thick layer, that value is just below 10% Ge, and for a 300 nm layer, it is below 2.5% Ge. It is observed from the strain plots [Figs. 4(a) and 4(b)] that the final result is not as sensitive to the growth rate as it is to the composition, since there is very little slope along the growth rate axis over an order of magnitude change in growth rate. This strong compositional dependence is to be expected, since the overall relaxation kinetics have a strong dependence on excess stress, which in turn depends upon the epilayer strain and thus its composition. This is described further in Ref. Reference Hull, Andersen, Parveneh and Bean1 and is consistent with experimental observations (e.g., Ref. Reference Hull and Bean24). The dependence of strain relaxation kinetics on growth rate is more muted; essentially the time frame to the growth of the final layer thickness is compressed at higher growth rates, which results in lower time at temperature, but will not cause anything like the magnitude of the effect of the high power-dependence of the relaxation kinetics upon composition. The second sharp change in the surface gradient, within Regime III, is caused by release of dislocations from the blocking regime [arrow 2 in Fig. 4(c), for example]. For example, at x = 0.25, a 30 nm layer is in a blocking condition, which slows the relaxation kinetics. Above that composition, however, the layer is not in the blocking regime at 30 nm thickness and is thus relaxing more quickly. The effects of the blocking can barely be seen for the 300 nm layer, since it occurs so much earlier in the relaxation process for most compositions and thus leaves no discernible “trace” so much later in the growth process.
Figure 5 shows similar (T–x versus ε and T–x versus p) plots. These plots again reveal how the density of the dislocation network at the final film thickness is extremely sensitive to composition and also to temperature. This latter dependence can be expected on the basis of the thermally activated parameters in Type I processes. These surfaces show similar critical inflections to Fig. 4 defined by critical composition and release from the blocking regime.
C. Sensitivity analysis
Inherent to Figs. 4 and 5 is information on the sensitivity of the final dislocation structure to variations in the parameters plotted: the higher the rate of change of ε or p at a given (x,T) or (x,g) point on the surface along the relevant vector, the greater the sensitivity to those factors. This is inherently more complex in CVD growth methods than for MBE growth. In MBE, the growth rate and composition depends upon the total and relative fluxes of Si and Ge arriving at the wafer surface. Assuming that both have the same temperature dependence of sticking rate, the coupling between growth rate and temperature is relatively simple to control. While the composition and growth rate may vary across the plane of the substrate due to the flux distributions from the effusion cells, and the temperature may be non-uniform because of heating geometries, the variables are relatively easy to separate such that the gradients of ε or p upon a single variable may be realistically assessed (these would correspond to the gradients parallel to the basal axes of the plots in Figs. 4 and 5). The inter-dependence of x, g, and T in CVD growth is more complex (e.g., Refs. Reference Kuhne45–Reference Yang and Tao47), however, as temperature changes the deposition rates vary differently for Ge and Si precursors, thus affecting both composition and total growth rate, and further varying the ratios of Ge to Si precursor introduces additional non-linearities into the deposition kinetics. Thus the relevant gradient at a particular (x,g) or (x,T) point in Figs. 4 and 5 might be along any vector direction projected onto the basal plane. So, while for MBE growth kinetics, two-dimensional representations of the sensitivity, as shown below, may provide sufficient information, for CVD growth the topography of the entire surface may be relevant.
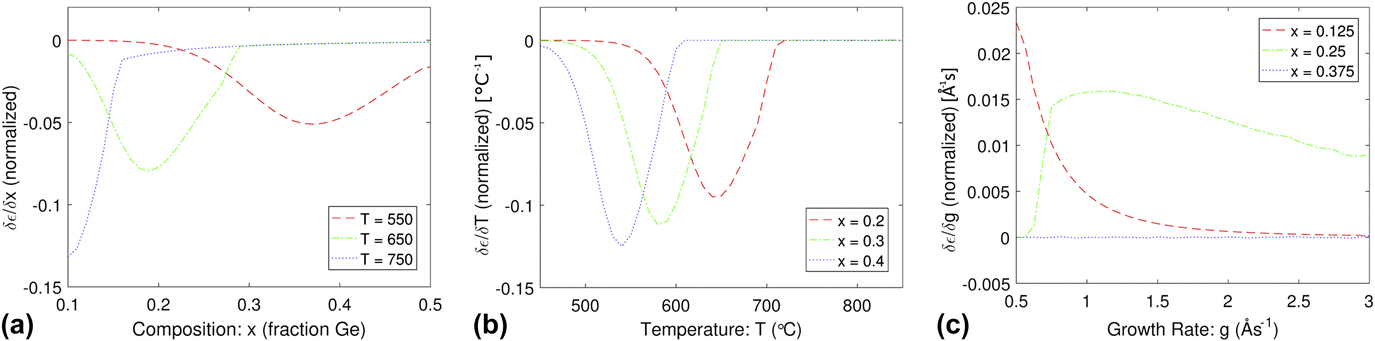
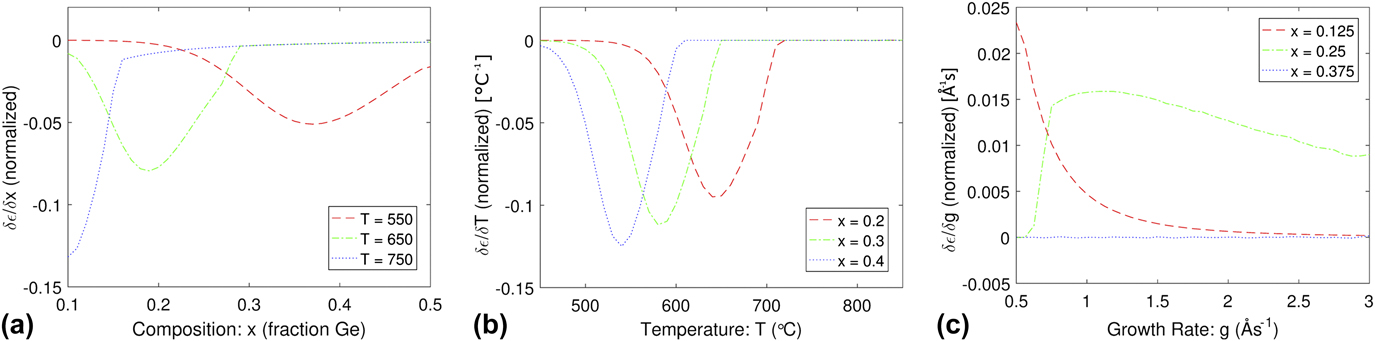
Figure 6 shows the differential change in the normalized strain as functions of composition, temperature, and growth rate. These plots are constructed from the derivatives of the corresponding cross sections of the surfaces in Figs. 4 and 5, and they demonstrate at what combinations of temperature, composition, and growth rate the strain relaxation rate (equivalently the rate of generation of the dislocation array) is most sensitive to small changes in those parameters. For example, in Figure 6(b), a change in the temperature around 650 °C will make a drastic change in the final strain state of a 300 nm thick layer with a composition of x = 0.2 but will make no significant difference for the same thickness layer with a composition of x = 0.4. For this particular example, this is because the x = 0.2 film is within Regime III of the surface plots, where the misfit dislocation kinetics are rapid due to the high excess stress and high instantaneous strain, while the x = 0.4 film is in Regime II where there is little instantaneous strain left to relax and the excess stress is correspondingly low. As another example from Fig. 6, one would infer that growth around x = 0.2, T = 650 °C, and g = 0.1 nm/s is a set of parameters where the dislocation density is particularly sensitive to small changes in these parameters. While only layer strain derivative plots are shown in Fig. 6, similar plots may be produced for any of the major dislocation metrics (e.g., dislocation density, average length, etc.).
Differential changes in the normalized strain for varying (a) composition, (b) temperature, and (c) growth rate, at several different temperatures and compositions. All data here are for a 300 nm thick layer with N o = 1000 cm−2, N t set to file values, g = 1 Å/s for (a) and (b), and T = 550 °C for (c).
VI. MECHANISTIC “FINGERPRINTING” METHODS
A. Overview and method
We now examine how mapping of the coupled evolution of the parameters p, N, and l ave allows “fingerprinting” of distinct dislocation kinetic (specifically, nucleation) mechanisms. While the process simulator does not keep track of individual dislocations, it does keep track of the number of new dislocations per calculation interval, the total added dislocation line length per calculation interval, and whether the system was in a blocking condition. This information is adequate to reproduce a visual model or “fingerprint” of an array of dislocations with the given average and total values and to infer potential fundamental mechanisms.
To this goal, we have developed the “Dislocation Illustrator” program. This is a script written in MATLAB, which extracts simulated data from the RelaxII simulator and then processes it into pseudo-maps of dislocation distributions. There are four main steps to the code: (i) At the start of the simulation, extracting the dislocation density statistics to determine the number of initial (i.e., heterogeneous) dislocations and the total number of thermally and multiplicatively nucleated dislocations (i.e., over the course of an annealing or growth sequence) to be simulated for the given surface area (the “virtual wafer”), as determined by the user; (ii) at each iteration, extracting the prediction of the incremental dislocation density, ΔN, from RelaxII and for each new dislocation randomly determining an orientation (i.e.,
 $\left[ {01\bar{1}} \right]$
or [011]) and a position on the virtual wafer surface; (iii) at each iteration of RelaxII, adding the new dislocation line length generated (ΔL = vΔt, where v is the dislocation velocity in that iteration and Δt is the time increment) per iteration to all previous dislocations and new dislocations. In the case of blocking, only new dislocations are allowed to grow, dependent on the average length and spacing; (iv) after the final iteration of the growth or annealing sequence, calculating the final position of the start and end of each dislocation and plotting the resultant dislocation distribution.
The Dislocation Illustrator considers two conditions within the blocking regime. In the first, the inter-dislocation stress exceeds the excess stress, but the average dislocation spacing is larger than the average dislocation length. In this case, dislocations continue growing normally, and all dislocations grow equally. In the second, the same blocking criterion is met, but the average dislocation spacing is smaller than the average dislocation length. In this case, all dislocations which have not nucleated in the present calculation interval are considered inactive.
The Dislocation Illustrator thus allows us to translate a set of average properties of the dislocation array, generated in RelaxII, into a visual representation that captures those properties and, to a limited degree, considers individual dislocation entities. Conceptually, it serves as a bridge between models such as RelaxII that consider the dislocation array as an entity and approaches such as DDD models, summarized in Sec. III, that follow the dynamics and configurations of each individual dislocation in an array.
The Dislocation Illustrator has three major simplifications/limitations with respect to tracking individual dislocations. First, it does not keep a record of when dislocations have crossed each other. This means that interactions of specific dislocations are not monitored, and so individual dislocations may run past each other when the blocking criterion is met or stop before reaching an orthogonal dislocation when blocking begins. Rather, their behavior in this respect is governed by the overall properties of the array, as described above. Second, it does not keep track of which specific dislocation interactions create new dislocations through multiplication. Normally it is expected that a new dislocation generated through multiplication would nucleate at the location of the intersection and travel closely beside one of the dislocations which generated it; however, the dislocation illustrator simply adds a new dislocation at a random location on the wafer surface. The final simplification is that the dislocation illustrator does not track when a dislocation has exceeded the boundaries of the calculated “wafer” surface. To compensate for this, a large “virtual wafer” area is used compared to the “viewing area” (i.e., the area over which the arrays are represented visually). Thus, the distance of the viewing area from the edge of the virtual wafer should be greater than the average dislocation length to ensure an accurate representation. Overall, while the Dislocation Illustrator thus does not provide an exact reproduction of the processes creating the dislocation array, it does enhance the ability to capture the characteristic “fingerprint” of the array, illustrating what the distribution of dislocations with a particular set of spacing and average length values would look like given the unique pathway to relaxation modeled by the process simulator.
B. Example “fingerprint analysis”: dependence of array characteristics on composition
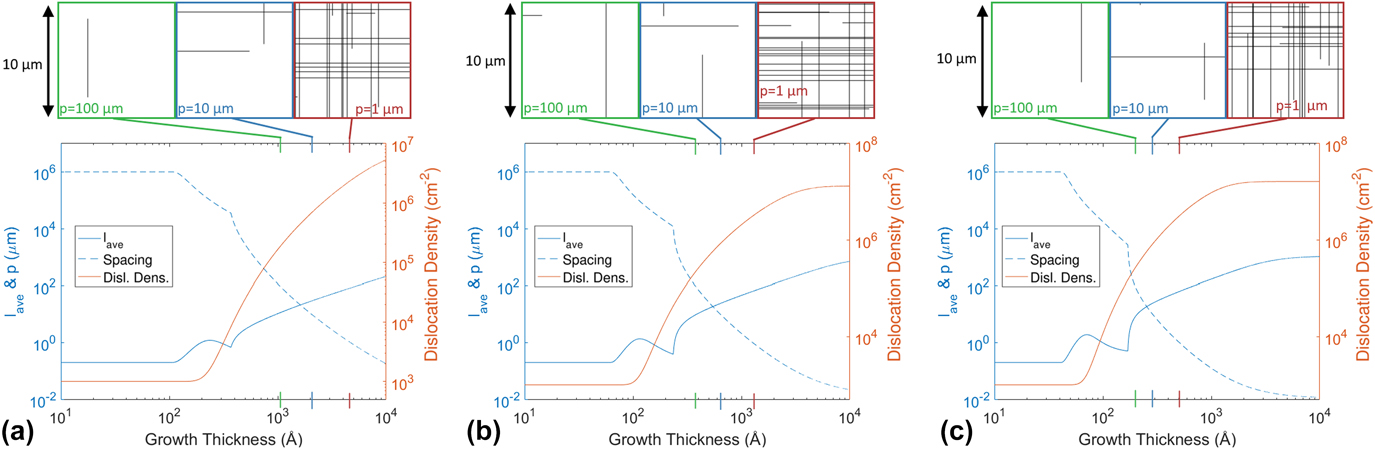
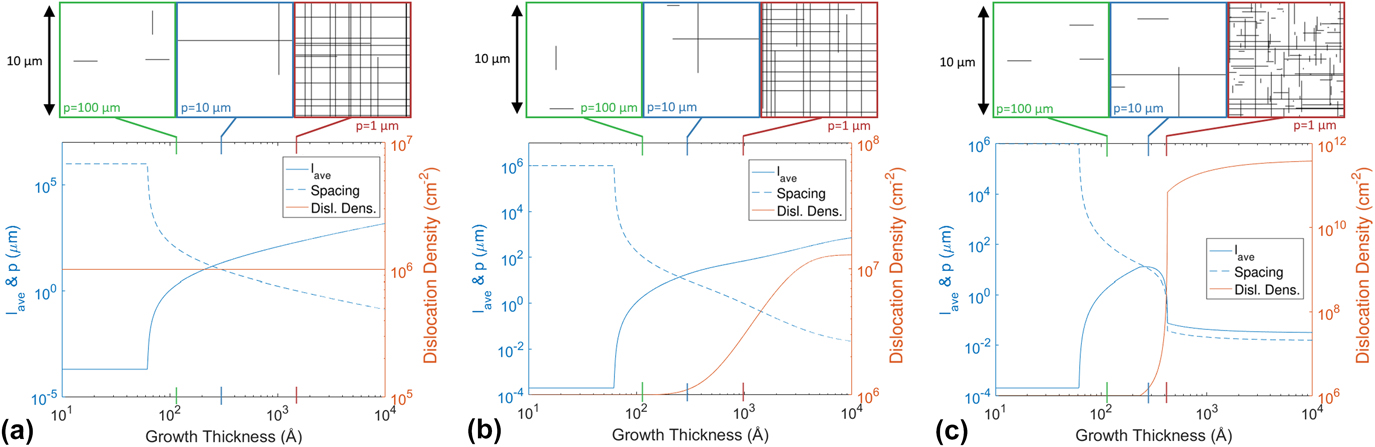
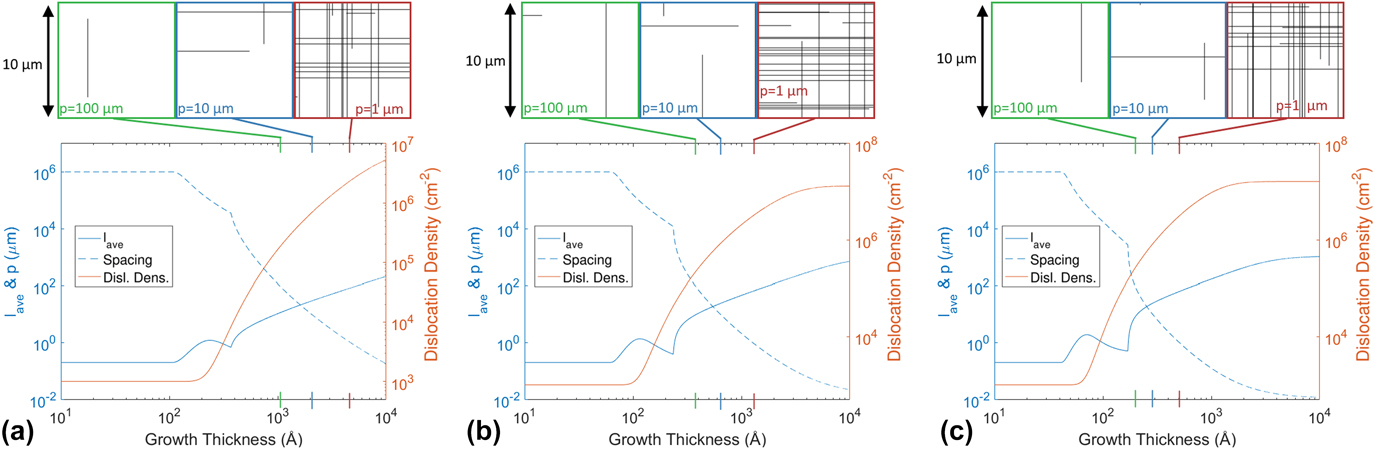
Figure 7 shows plots of dislocation average length, spacing, and the dislocation density generated by RelaxII for three different compositions, with corresponding Dislocation Illustrator representations. The general shapes of the RelaxII curves for different compositions are similar, though the position of the critical thicknesses, rate of relaxation, and final dislocation spacing do change significantly. The spacing curve has two distinct sharp changes in slope, which were seen earlier in Fig. 2, representing the critical thickness where the applied lattice mismatch stress overcomes the dislocation line tension (e.g., the start of relaxation) and the characteristic thickness for unblocking. Note that dislocation nucleation slightly lags behind dislocation growth, initially increasing the average length of the dislocations. Within the blocking regime, as new dislocations start to nucleate more quickly, the dislocation nucleation rate catches up and the average spacing starts to go down again. Once blocking is overcome, there is a rapid change in the average length, particularly in the higher composition cases. Dislocation Illustrator plots are shown for the same average dislocation spacings, p (1, 10, and 100 μm), at each composition but of course the epilayer thicknesses at which those spacings occur reduce for increasing composition. Since these systems all have very similar relaxation and nucleation histories, the Dislocation Illustrator representations at a given spacing end up looking quite similar. There is no clear difference in the fingerprint due to the composition, since the same relaxation processes are being activated, just at different rates.
Relax II and Dislocation Illustrator representations of evolution of the dislocation array at different compositions. Lower figures show Relax II simulations of average dislocation length, dislocation spacing, and the density of dislocations for three different compositions: (a) x = 0.2, (b) x = 0.3, and (c) x = 0.4, with T = 550 °C, g = 1 Å/s, N o = 1000 cm−2, and N t set to file values. Upper figures are Dislocation Illustrator representations of these arrays using a viewing area of 100 µm2 far from the edge of a square 250,000 µm2 virtual wafer.
C. Example “fingerprint analysis”: dependence of array characteristics on dislocation nucleation mechanisms
Figure 8 shows plots of dislocation average length, spacing, and the number of dislocations generated by RelaxII for three distinct dislocation nucleation mechanisms, with corresponding Dislocation Illustrator representations. It is immediately clear from the RelaxII curves that the relaxation pathways are very different from each other. Figure 8(a) shows an epitaxial growth where only dislocations from the initial heterogeneous dislocation density (N o) grow, and there is no other type of nucleation occurring. In this case, we expect that all dislocations will be identical in length. Figure 8(b) shows a growth with the same N o term, but with thermal (homogenous) nucleation, N t, also activated. The shape of the relaxation pathway is very similar to that of Fig. 8(a), until the population of thermally nucleated dislocations approaches and exceeds the initial density, N o, at which point the relaxation becomes more rapid. The final dislocation spacing, p, is lower than that in Fig. 8(a) as a result of the additional dislocations available. Finally, Fig. 8(c) shows growth for the same initial heterogeneous dislocation density as in Fig. 8(a), but with additional nucleation by multiplication, N m (there is no homogeneous generation term, N t, in this example). Note the avalanche effect that occurs once the spacing and average dislocation length curves intersect. At this point, new intersections happen very rapidly, with each one giving rise to a new dislocation, as defined by these simulation parameters. As each of these new dislocations grows and intersects another dislocation, the process repeats. This rapid increase in dislocations causes the dislocation spacing to abruptly drop to near equilibrium values, at which point the driving force for relaxation becomes vanishingly small. Here, the final 1 µm “fingerprint” is drastically different to the other examples. It shows that there were many long dislocations, originating from the initial N o term, which had significant time for growth, followed by the rapid nucleation of many new dislocations, which had relatively little time to grow.
Relax II and Dislocation Illustrator representations of evolution of the dislocation array for three different nucleation conditions. Lower figures show Relax II simulations of average dislocation length, dislocation spacing, and the density of dislocations for (a) N o = 106 cm−2, (b) N o = 106 cm−2 plus thermal nucleation N t (set to file values), and (c) N o = 106 cm−2 plus dislocation multiplication (one new dislocation per intersection event), with x = 0.3, T = 550 °C, and g = 1 Å/s. Upper figures are Dislocation Illustrator representations of these arrays using a viewing area of 100 µm2 far from the edge of a square 250,000 µm2 virtual wafer.
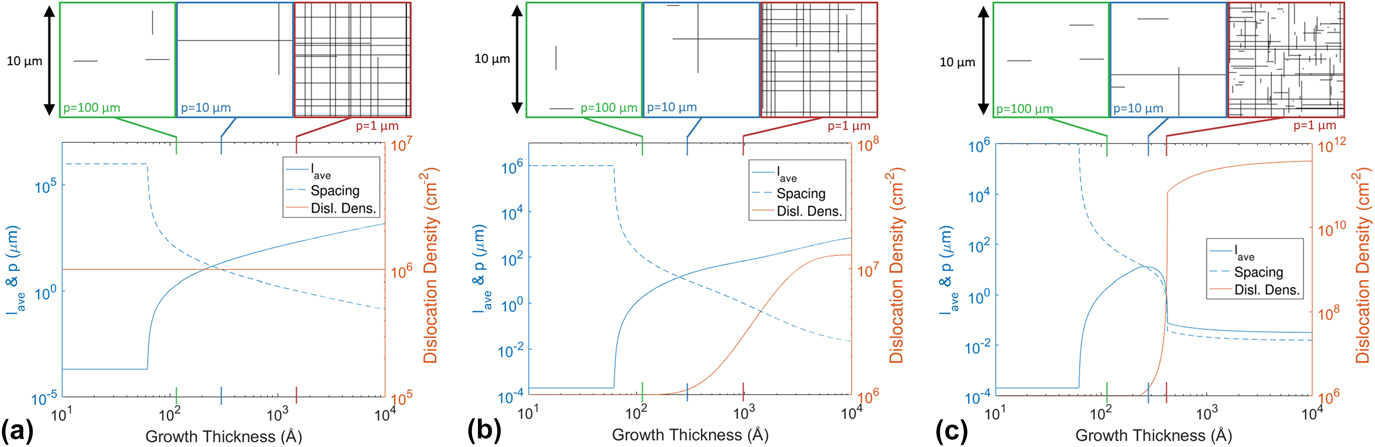
The Dislocation Illustrator representations of the dislocation arrays in Fig. 8, for the same average dislocation spacing, show clear qualitative differences between the characteristics of the array for the different dislocation nucleation mechanisms. Although we have not yet initiated such a study, a clear pathway to quantitatively analyze these characteristics and map to nucleation mechanisms would be to construct spectral distributions of dislocation lengths. For the case of Fig. 8(a), heterogeneous nucleation (N o) only, the simulated spectrum would consist of a single peak corresponding to the identical growth of each source dislocation from the start to the end of the simulation. We would expect to see some dispersion because of different blocking configurations for different dislocations within the blocking regime (as discussed above, these individual variations are not captured by either RelaxII or Dislocation Illustrator simulations), but the experimental spectrum would still be dominated by a peak around the maximum length for this test case. For the case of Fig. 8(b), heterogeneous nucleation (N o) and thermal nucleation (N t), the simulated and experimental spectra would have a strong peak at the maximum length, corresponding to the growth of the initial N o dislocations, and a broad continuous tail down to zero length corresponding to the growth of the N t dislocations. The relative areas under the N o peak and the N t tail would inform the relative magnitudes of these two mechanisms, and the spectral distribution within the N t tail would inform the history of the evolving excess stress in the sample (on the basis that the nucleation rate, and hence the time at which specific populations of dislocations nucleate, is very sensitive to the excess stress). Finally, for the case of Fig. 8(c), heterogeneous nucleation (N o) and multiplication (N m), the spectra would be expected to show a bimodal distribution. Again, there will be a strong peak at the maximum length, corresponding to the growth of the initial N o dislocations, but also a large and relatively sharp [compared to the N t tail in Fig. 8(b)] peak at shorter lengths, where the “multiplication avalanche” effect generates large numbers of dislocations at a characteristic time within the growth sequence.
VII. CONCLUSIONS
We have demonstrated how a process simulator, “RelaxII”, that integrates the energetics and kinetics of the development of misfit dislocation arrays in strained layer epitaxy, can be used to test operative mechanisms and generate parametric and sensitivity analyses of strain relaxation by misfit dislocations in the Ge x Si1−x /Si(100) system. Comparison to the literature data indicates some regimes where data and simulation match well—suggesting that both the mechanistic architecture and the quantitative descriptions of the relevant dislocation kinetics capture the essence of the development of the dislocation array well—and other regimes where the relatively poorer matching suggests hitherto unrecognized mechanisms may be operating. Thus, while we have demonstrated good predictive capabilities in some regimes (generally regimes at higher growth temperatures and before the very last stages of relaxation where inter-dislocation mechanisms analogous to work-hardening can be expected to dominate), there are substantial discrepancies in other regimes (such as very low temperature growth), where both the shape and the magnitudes of the values in the experimental curves indicate that hitherto unidentified mechanisms are operating. We view this as a strength rather than a weakness of the simulator: given the fact that entirely different dislocation kinetic mechanisms are known to operate in different regimes of strain, temperature, and composition; and even between growth methods and systems, the ability to tune different kinetic mechanisms within the simulator architecture informs which of the incorporated mechanisms are operative and can highlight where new mechanisms may be occurring.
Having established the domains in which the simulator offers reasonable predictive accuracy, we can then map “relaxation surfaces” that relate the strain/dislocation state of the system to independent growth parameters such as temperature and film composition or temperature and growth rate. The gradients on such surfaces show the sensitivity of the final structure to small variations or fluctuations in the growth parameters.
Finally, while the architecture of RelaxII is such that it inherently predicts the properties of the overall system without informing the behavior of individual dislocations within the system, we demonstrate a “bridging method” toward describing the properties of individual dislocations. The “Dislocation Illustrator” architecture extracts the relevant parameters from RelaxII that describe the overall evolution of the dislocation array and translates them into a representation of the evolution of individual dislocations in the array. This creates a richer representation of the internal structure of the overall array and how the details of the internal structure of the array—what we have termed “dislocation fingerprinting”—informs, for example, operative dislocation nucleation mechanisms. We describe a proposed approach employing “spectroscopy” of the distribution of individual dislocation lengths in the array that should inform the relative preponderance of heterogeneous, homogeneous, and multiplicative dislocation nucleation mechanisms.
ACKNOWLEDGMENTS
We wish to acknowledge the pioneering and lasting contributions of Jan Van der Merwe who was so instrumental in providing the foundations for the field of strained layer epitaxy, which has provided such scientific richness for so many of us over the decades and which has had enormous and pervasive technological impact in industries from microelectronics to information transmission systems and many others.
This work was supported by the National Science Foundation under Grant Nos. DMR-9531696 (construction of original simulator) and DMR-1309535 (further simulator development and parametric, sensitivity, and fingerprinting analysis).