Maintenance haemodialysis (MHD) patients exhibit a substantially higher prevalence of hyperkalaemia compared with the general population, with reported rates of 27·4 % for serum potassium levels (5·0–6·0 mmol/L) and 19·3 % for severe hyperkalaemia (≥6·0 mmol/L)(Reference Bem, Sugrue and Wilding1). This electrolyte imbalance significantly contributes to cardiovascular mortality and sudden cardiac death in this vulnerable population (Reference Karaboyas, Robinson and James2,Reference Karaboyas, Zee and Brunelli3) . Currently, dietary potassium restriction is routinely recommended for patients with MHD to prevent hyperkalaemia, mainly by reducing the intake of plant-based foods. However, this approach remains controversial due to insufficient evidence linking plant-based diets to hyperkalaemia, coupled with potential adverse consequences including nutritional deficiencies and impaired quality of life(Reference MacLaughlin, McAuley and Fry4–Reference Babich, Kalantar-Zadeh and Joshi6).
Notably, significant discrepancies exist between international guidelines regarding dietary potassium intake for patients undergoing maintenance haemodialysis. While the European Best Practice Guidelines adopt a liberal approach, recommending restriction to 1950–2730 mg/day only for individuals with hyperkalaemia(Reference Fouque, Vennegoor and ter Wee7), other guidelines propose a daily intake of 2700–3000 mg/day(Reference Clase, Carrero and Ellison8). The Kidney Disease Outcomes Quality Initiative provides no specific quantitative recommendations for this patient group(Reference Ikizler, Burrowes and Byham-Gray9).
The existing evidence regarding dietary potassium and mortality in MHD patients remains limited and inconsistent(Reference Noori, Kalantar-Zadeh and Kovesdy10–Reference Bernier-Jean, Wong and Saglimbene12). To address this critical knowledge gap, we conducted a comprehensive investigation of the associations between total dietary potassium intake, sources of dietary potassium intake and the mortality in MHD patients.
Method
Study design and participants
This multicentre, prospective cohort study was conducted across eight outpatient dialysis centres in Guangdong Province, China (Nanfang Hospital, the First People’s Hospital of Foshan, Huadu District People’s Hospital of Guangzhou, Guangzhou Red Cross Hospital, Guangzhou Overseas Chinese Hospital, the Third Affiliated Hospital of Southern Medical University, Nanhai District People’s Hospital of Foshan and the Second People’s Hospital of Shenzhen). Participants were enrolled between January 2014 and December 2015. The detailed methodology and preliminary findings have been reported previously(Reference Yang, Qin and Li13,Reference Chen, Qin and Li14) .
Eligible participants met the following criteria: (1) age ≥18 years; (2) stable haemodialysis for ≥3 consecutive months; (3) cognitive capacity to provide informed consent and complete study assessments and (4) ability to maintain oral nutrition. We excluded patients with: (1) endocrine disorders (thyroid dysfunction); (2) acute systemic illnesses (active infections); (3) chronic organ failure (liver cirrhosis, severe cardiopulmonary dysfunction); (4) malignancy or active autoimmune diseases; (5) gastrointestinal disorders impairing nutrient absorption or (6) implausible daily caloric intake defined as an average daily energy intake derived from 24-h dietary recalls (<500 or >3500 kcal/day for women; <800 or >4200 kcal/day for men).
All participants gave written consent, and the Medical Ethics Committee of Nanfang Hospital approved the study.
Diet data assessment
Dietary intake was assessed at baseline by three non-consecutive 24-h recalls (including one dialysis day) using the validated USDA multiple-pass method(Reference Conway, Ingwersen and Vinyard15). Nutrient analysis was performed with Zhending Software v2.0 (Chinese Food Composition Table 2009). Energy and protein were normalised to dry body weight (kcal/kg/d, g/kg/d). Potassium sources were categorised as plant-based (vegetables, cereals, fruits, nuts, legumes and potatoes), animal-based (meat, seafood, eggs and dairy) and other (processed foods, beverages).
Clinical and laboratory measurements
The following variables were collected by trained research staff as per standard operating baseline procedures at the study: socio-demographic data, lifestyle information, history of comorbid conditions and medication information. Diabetes mellitus was defined as fasting plasma glucose ≥ 7·0mmol/L, non-fasting plasma glucose ≥ 11·1mmol/L, use of anti-diabetes mellitus medication or self-reported having a medical history of diabetes. Hypertension was defined as mean systolic/diastolic blood pressures ≥140/90 mmHg on three seated measurements obtained by trained staff after rest, use of antihypertensive medications or self-reported having a medical history of hypertension. CVD was defined as having a history of myocardial infarction, transient ischaemic attack, stroke, heart failure or peripheral arterial disease. Anthropometric measures were measured at the end of the haemodialysis treatment. BMI was calculated as dry body weight in kilograms divided by height in meters squared.
Pre-dialysis blood samples (second dialysis of the week) were analysed locally for routine labs, including serum potassium. Kt/v (single pool) was calculated by using the urea kinetic modelling formula: SpKt/v = −ln(R − 0·008 × t) + [(4–3·5 × R) × UF/W], where R is the ratio of post-dialysis to pre-dialysis serum urea nitrogen, t is the time of dialysis in hours, UF is the amount of ultrafiltration (in litres) and W is post-dialysis weight (in kilograms).
Study outcomes
The primary outcomes were all-cause mortality, with CVD mortality (death attributable to myocardial infarction, fatal arrhythmia, cardiac arrest or stroke) serving as the secondary outcomes. Mortality data were ascertained through: (1) review of hospital death certificates; (2) structured telephone follow-up and (3) linking to the national mortality surveillance system from the Chinese Center for Disease Control and Prevention via the national identification number of the participants. All participants were followed up until their death, transfer to kidney transplantation or peritoneal dialysis, the end of the latest survey (August 2023) or censoring.
Statistical analysis
Baseline characteristics were compared by tertiles of potassium intake using χ 2 tests and ANOVA. Cox proportional hazards models estimated HR and 95 % CI. Covariates were selected based on clinical plausibility, biological relevance and prior literature to minimise confounding and distinguish confounders from mediators. Model I adjusted for potential confounders – factors associated with both potassium intake and mortality but not on the causal pathway: demographics (age, sex), lifestyle (smoking, alcohol), comorbidities (diabetes, hypertension and CVD), dialysis-related factors (centre, vintage and Kt/V), nutritional/inflammatory markers (BMI, albumin and CRP), metabolic indicators (creatinine, calcium, phosphorus, TCO₂, triglycerides, cholesterol and serum potassium) and dietary energy intake. Potassium sources were mutually adjusted in subgroup analyses. Model II additionally adjusted for medications affecting potassium homeostasis (beta-blockers, RAAS inhibitors, diuretics and sodium bicarbonate) to further reduce residual confounding(Reference Montford and Linas16). Plant-and animal-based potassium were analysed separately, with mutual adjustment for other potassium sources in subgroup analyses. Restricted cubic splines (three knots) were used to model dose–response (P for non-linearity reported).
Variables potentially on the causal pathway between potassium intake and mortality (e.g. dietary protein, fibre and fruit/vegetable intake) were not included in primary models to avoid over-adjustment, but were examined in sensitivity analyses (model III) to assess mediation by overall diet quality. Other sensitivity analyses included: removal of serum potassium from model II to avoid over-adjustment (model IV); exclusion of deaths within the first year and competing risk of non-CVD death or kidney transplantation using Fine–Gray models. Stratified analyses by prespecified subgroups were conducted with interaction tests. Pearson/Spearman correlation between dietary potassium and serum potassium was calculated.
A two-tailed P value < 0·05 was considered statistically significant. Data management and analysis were performed using Empower(R) (www.empowerstats.com, X&Y Solutions, Inc.) and R software, version 4.2.3 (http://www.R-project.org).
Result
Study participants and baseline characteristics
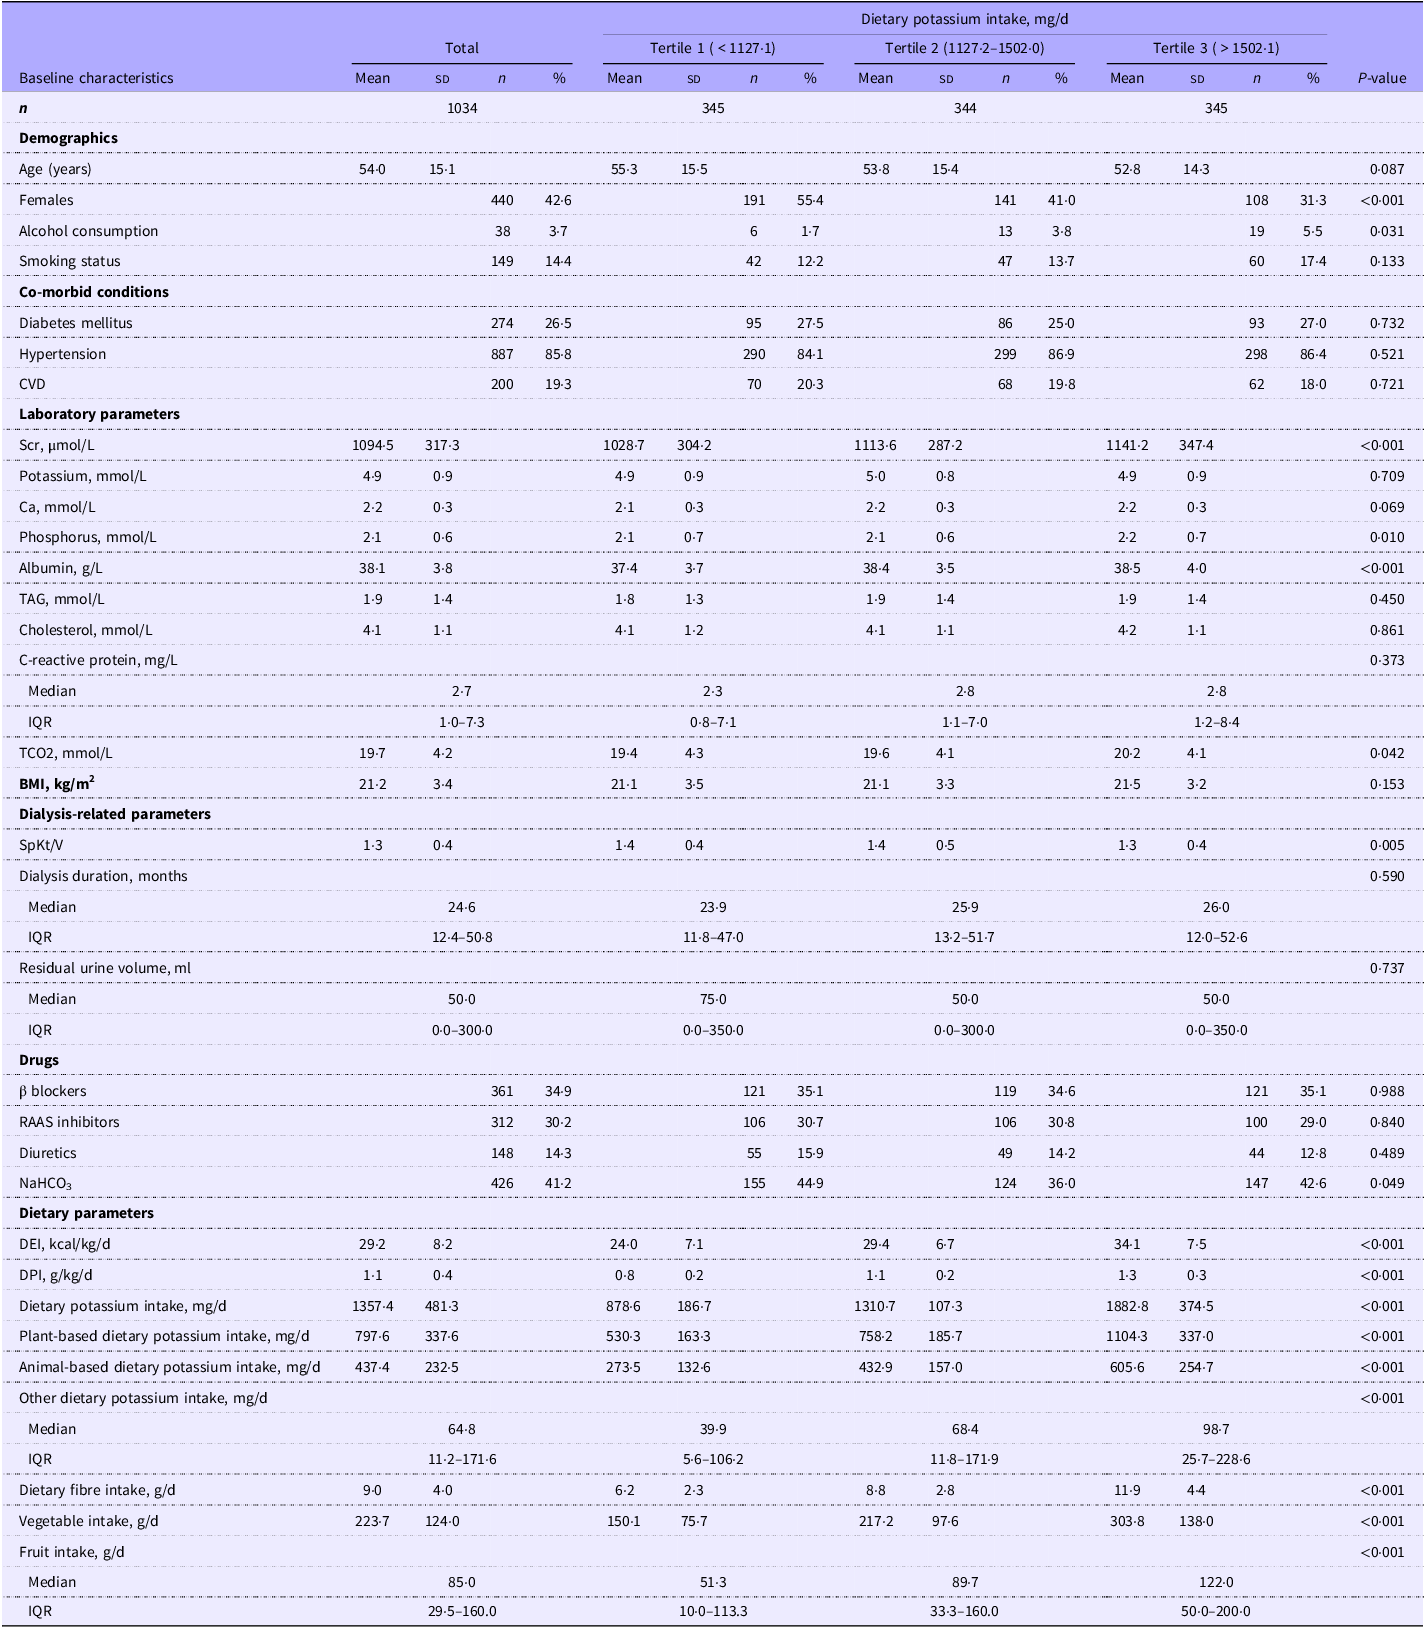
This prospective study enrolled 1302 maintenance haemodialysis patients, with 1034 included in the final analysis (Supplementary Figure 1). The baseline characteristics of participants according to dietary potassium intake are presented in Table 1. The cohort had a mean age of 54·0 ± 15·1 years; 42·6 % were female, with a mean serum potassium of 4·9 ± 0·9 mmol/L and a mean BMI of 21·2 ± 3·4 kg/m². Notably, no patients in this study population were using potassium binders.
Restricted cubic spline (RCS) curves showing the associations of dietary potassium intake (total and plant-based) with all-cause mortality and cardiovascular mortality. (a) Association between total dietary potassium intake and all-cause mortality. (b) Association between total dietary potassium intake and cardiovascular mortality. (c) Association between plant-based potassium intake and all-cause mortality. (d) Association between plant-based potassium intake and cardiovascular mortality. Adjust for dialysis centres, gender, age, smoking status, alcohol consumption, history of diabetes mellitus, history of hypertension, history of CVD, BMI, SpKt/v, dialysis duration, serum creatinine, albumin, CRP, TCO2, TAG, cholesterol, serum potassium, serum calcium, serum phosphorus and DEI. (Note: for plant-based potassium group add adjustment for animal-based potassium + other foods dietary potassium.) DEI, dietary energy intake.

The mean total dietary potassium intake was 1357·4 ± 481·3 mg/day, comprising 797·6 ± 337·6 mg/day from plant-based sources, 437·4 ± 232·5 mg/day from animal-based sources and a median 64·8 (11·2–171·6) mg/day from other sources. Supplementary Figure 2 illustrates the intake distribution. Across decreasing tertiles of potassium intake, there was a higher proportion of females and lower proportion of alcohol drinkers. Lower potassium intake was also associated with reduced serum creatinine, serum phosphorus, albumin, total CO₂ and lower intakes of energy, protein, fiber, vegetables and fruits.
Regarding dietary sources, vegetables contributed the most to potassium intake (median 22·5 % [15·0 %-30·9 %]), followed by cereals, red meat, fruits, snacks and beverages, seafood, eggs, white meat, dairy products and potatoes (Supplementary Figure 3).
Relationship of dietary potassium intake with all-cause and CVD mortality
Over a median follow-up of 4·4 years, 545 (52·7 %) participants died, including 294 (28·4 %) cardiovascular deaths.
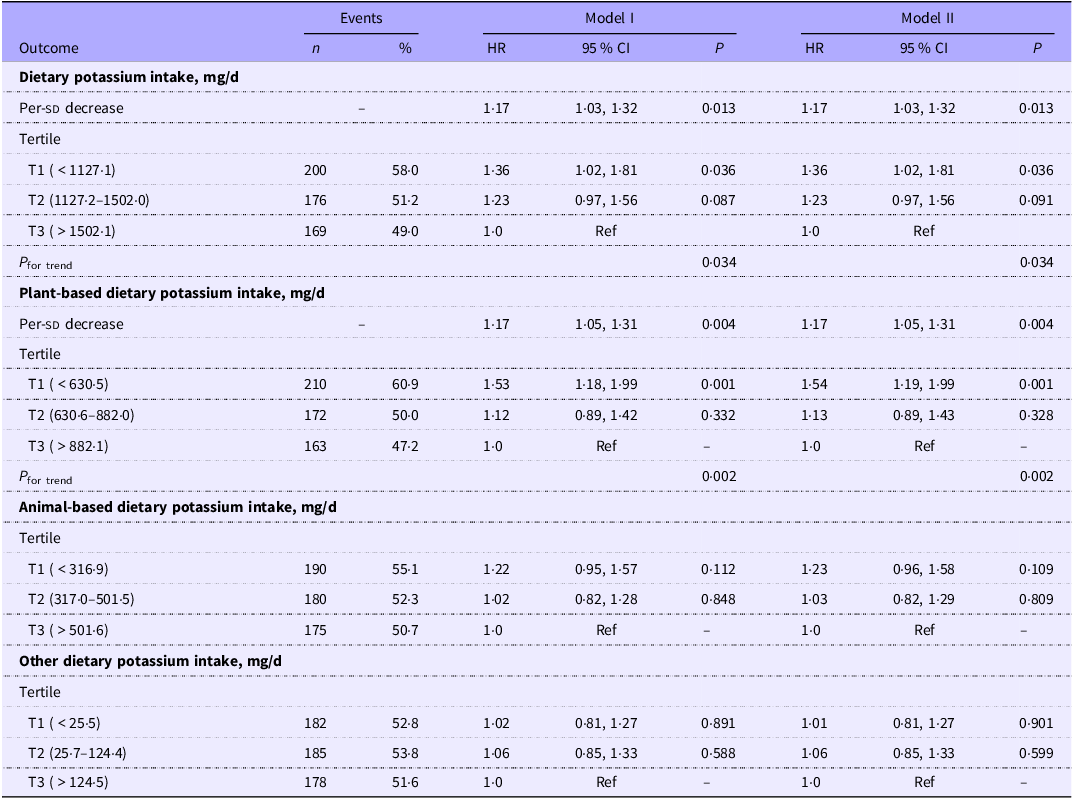
In model Ⅰ, each sd decrease in intake (481·3 mg/day) was associated with a 17 % higher risk (aHR: 1·17, 95 % CI: 1·03–1·32, P = 0·013). Compared with the highest tertile, participants in the lowest tertile showed a significantly elevated risk (aHR: 1·36, 95 % CI: 1·02–1·81, P for trend = 0·034). These patterns remained consistent in model Ⅱ. No statistically significant association was found between dietary potassium intake and cardiovascular mortality in either adjusted model.
Relationship of different sources of dietary potassium intake and all-cause and CVD mortality
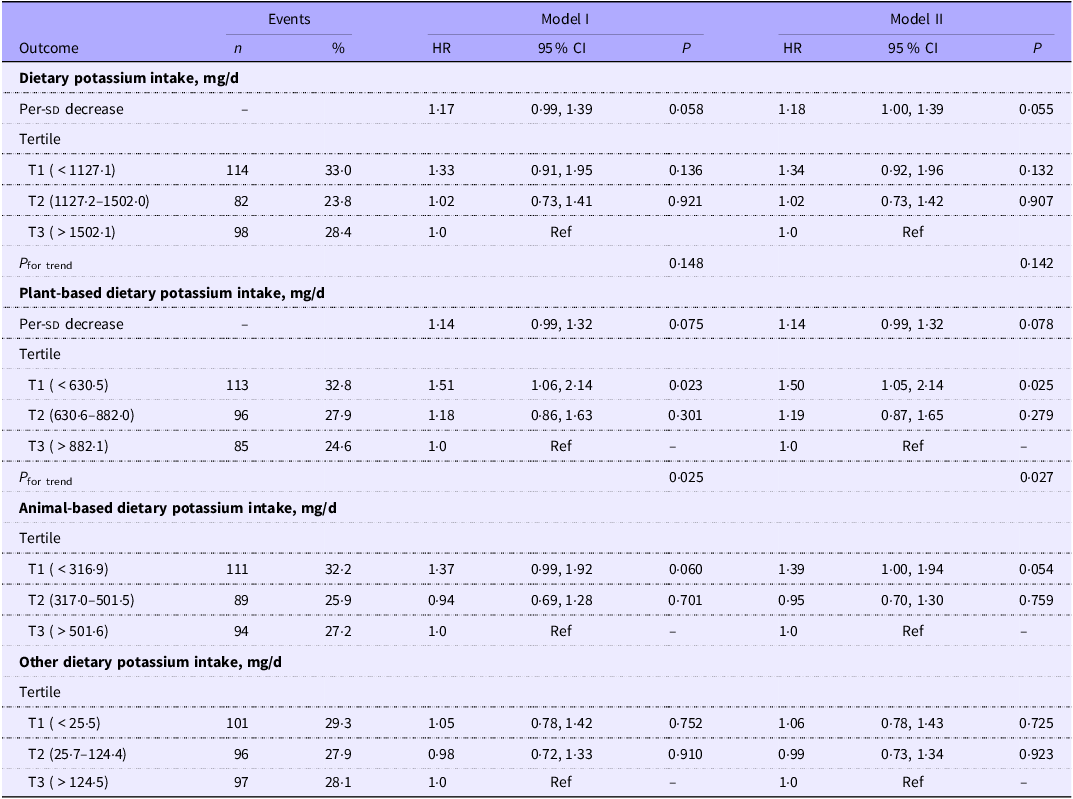
In secondary analyses examining different sources of dietary potassium, lower plant-based potassium intake (T1 group) was associated with increased all-cause mortality (aHR: 1·54, 95 % CI: 1·19–1·99; P for trend = 0·002) and cardiovascular mortality (aHR: 1·50, 95 % CI: 1·05–2·14; P for trend = 0·027) after full adjustment (model Ⅱ), as shown in Tables 2 and 3. No significant associations were observed for animal-based or other dietary potassium sources and patient prognosis.
Multivariate cox regression analyses of dietary potassium intake and different sources of dietary potassium intake (plant-based, animal-based and other) in relation to all – cause mortality

Table 2. Long description
A table with 18 rows and 12 columns comparing dietary potassium intake and its sources with all-cause mortality. The table includes data on dietary potassium intake in mg/d, plant-based dietary potassium intake in mg/d, animal-based dietary potassium intake in mg/d, and other dietary potassium intake in mg/d. The columns are labeled as Events (n, %), Model I (HR, 95% CI, P), and Model II (HR, 95% CI, P). The rows are divided into tertiles and per-standard deviation decrease. Notable trends include significant associations between lower plant-based potassium intake and increased all-cause mortality.
Model Ⅰ: adjusted for dialysis centres, gender, age, smoking status, alcohol consumption, history of diabetes mellitus, history of hypertension, history of CVD, BMI, SpKt/v, dialysis duration, serum creatinine, albumin, CRP, TCO2, TAG, cholesterol, serum potassium, serum Ca, serum phosphorus, DEI, different sources of dietary potassium adjust each other (note: for plant-based potassium group add adjustment for animal-based potassium + other foods dietary potassium; for animal-based potassium group add adjustment for plant-based potassium + other foods dietary potassium; for other dietary potassium group add adjustment for plant-based potassium + animal-based potassium).
Model Ⅱ: adjusted for model Ⅰ+ beta-blockers, RAAS inhibitors, diuretics and NaHCO3.
Multivariate cox regression analyses of dietary potassium intake and different sources of dietary potassium intake (plant-based, animal-based and other) in relation to CVD mortality

Table 3. Long description
A table comparing dietary potassium intake and cardiovascular disease (CVD) mortality. The table has 16 rows and 12 columns. Column headers are Outcome, Events, n, %, Model I, HR, 95 % CI, P, Model II, HR, 95 % CI, P. Row labels include Dietary potassium intake, mg/d, Plant-based dietary potassium intake, mg/d, Animal-based dietary potassium intake, mg/d, and Other dietary potassium intake, mg/d. Each row provides data for different tertiles and per-standard-deviation decreases. Values include event counts, percentages, hazard ratios (HR), confidence intervals (CI), and p-values (P) for two models. Notable trends include significant associations for plant-based potassium intake with all-cause and cardiovascular mortality in the first tertile group.
Model Ⅰ: adjusted for dialysis centres, gender, age, smoking status, alcohol consumption, history of diabetes mellitus, history of hypertension, history of CVD, BMI, SpKt/v, dialysis duration, serum creatinine, albumin, CRP, TCO2, TAG, cholesterol, serum potassium, serum Ca, serum phosphorus, DEI, different sources of dietary potassium adjust each other (note: for plant-based potassium group add adjustment for animal-based potassium + other foods dietary potassium; for animal-based potassium group add adjustment for plant-based potassium + other foods dietary potassium; for other dietary potassium group add adjustment for plant-based potassium + animal-based potassium).
Model Ⅱ: adjusted for model Ⅰ+ beta-blockers, RAAS inhibitors, diuretics and NaHCO3.
Stratified analysis of dietary potassium intake and all-cause mortality
Stratified analyses were performed to evaluate the association between dietary potassium intake (per sd decrease) and all-cause mortality across clinically relevant subgroups. No statistically significant interactions were observed for sex (male v. female), age (<60 v. ≥60 years), history of diabetes mellitus (yes v. no), history of CVD (yes v. no), BMI (<21 kg/m2 v. ≥21 kg/m2), albumin (<38 v. ≥38 g/L), serum Ca (<2·1 v. ≥2·1 mmol/L), serum phosphorus (<2·1 v. ≥2·1 mmol/L), serum potassium (<5 v. ≥5 mmol/L), TCO2 (<20 v. ≥20 mmol/L) and DEI (<29 v. ≥29 kcal/kg/d) (all P for interaction >0·05) (Figure 2). The direction and magnitude of the associations were generally consistent across subgroups.
Stratified analyses of the association between dietary potassium intake and the risk of all-cause mortality. Adjust for dialysis centres, gender, age, smoking status, alcohol consumption, history of diabetes mellitus, history of hypertension, history of CVD, BMI, Kt/v, dialysis duration, serum creatinine, albumin, CRP, TCO2, TAG, cholesterol, serum potassium, serum Ca, serum phosphorus, DEI. CRP, C-reactive protein; ALB, albumin, TCO2, total carbon dioxide combining power; DEI, dietary energy intake.

Relationship of dietary potassium intake, different sources of dietary potassium intake and baseline serum potassium levels and hyperkalaemia
No significant correlations were observed between baseline serum potassium levels and total dietary potassium intake (R = 0·023, P = 0·46), plant-based potassium intake (R = 0·023, P = 0·45), animal-based potassium intake (R = 0·028, P = 0·37) or potassium from other dietary sources (R = 0·027, P = 0·39) (Supplementary Figure 4).
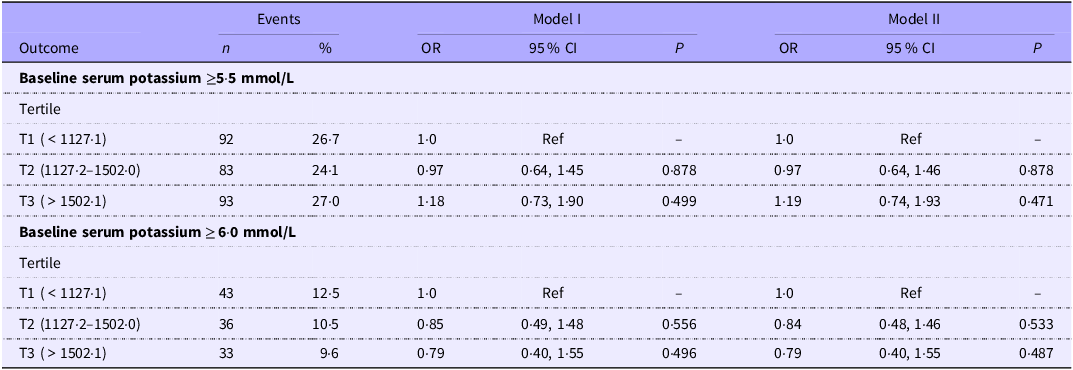
At baseline, 25·9 % of participants had serum potassium concentrations ≥5·5 mmol/L and 10·8 % had concentrations ≥6·0 mmol/L. In multivariable logistic regression analyses, neither total dietary potassium intake nor potassium intake from different food sources was associated with hyperkalaemia, regardless of whether hyperkalaemia was defined as serum potassium ≥5·5 mmol/L or ≥6·0 mmol/L (Table 4). In contrast, diabetes mellitus, higher standardised serum creatinine (Scr/sd) and higher serum phosphorus levels were independently associated with hyperkalaemia (Supplementary Table 1).
The relationship between baseline dietary potassium and the risk of baseline hyperkalaemia in maintenance haemodialysis patients

Table 4. Long description
A table comparing the relationship between baseline dietary potassium and the risk of hyperkalaemia in haemodialysis patients. The table has 10 rows and 10 columns. Column headers are Outcome, Events n, Events %, Model I OR, Model I 95 % CI, Model I P, Model II OR, Model II 95 % CI, Model II P. Row labels are Baseline serum potassium ≥5.5 mmol/L Tertile T1 (< 1127.1), T2 (1127.2–1502.0), T3 (> 1502.1), Baseline serum potassium ≥6.0 mmol/L Tertile T1 (< 1127.1), T2 (1127.2–1502.0), T3 (> 1502.1). Row 1: Baseline serum potassium ≥5.5 mmol/L Tertile T1 (< 1127.1), 92, 26.7, 1.0, Ref, 1.0, Ref. Row 2: Baseline serum potassium ≥5.5 mmol/L Tertile T2 (1127.2–1502.0), 83, 24.1, 0.97, 0.64, 1.45, 0.878, 0.97, 0.64, 1.46, 0.878. Row 3: Baseline serum potassium ≥5.5 mmol/L Tertile T3 (> 1502.1), 93, 27.0, 1.18, 0.73, 1.90, 0.499, 1.19, 0.74, 1.93, 0.471. Row 4: Baseline serum potassium ≥6.0 mmol/L Tertile T1 (< 1127.1), 43, 12.5, 1.0, Ref, 1.0, Ref. Row 5: Baseline serum potassium ≥6.0 mmol/L Tertile T2 (1127.2–1502.0), 36, 10.5, 0.85, 0.49, 1.48, 0.556, 0.84, 0.48, 1.46, 0.533. Row 6: Baseline serum potassium ≥6.0 mmol/L Tertile T3 (> 1502.1), 33, 9.6, 0.79, 0.40, 1.55, 0.496, 0.79, 0.40, 1.55, 0.487.
Model Ⅰ: adjusted for dialysis centres, gender, age, smoking status, alcohol consumption, history of diabetes mellitus, history of hypertension, history of CVD, BMI, SpKt/v, dialysis duration, serum creatinine, albumin, CRP, TCO2, TAG, cholesterol, serum Ca and serum phosphorus.
Model Ⅱ: adjusted for model Ⅰ+ beta-blockers, RAAS inhibitors, diuretics and NaHCO3.
Dose–response relationship of dietary potassium intake with all-cause and CVD mortality
Restricted cubic spline analyses demonstrated significant inverse associations between total dietary potassium intake and both all-cause mortality (P for overall = 0·033) and cardiovascular mortality (P for overall = 0·030; Figure 1a). No evidence of nonlinearity was detected (all P for nonlinear > 0·05; Figure 1b), indicating predominantly linear dose–response relationships.
Similarly, plant-based dietary potassium intake was significantly associated with all-cause mortality (P for overall = 0·009; Figure 1c), whereas its association with cardiovascular mortality did not reach statistical significance (P for overall = 0·118; Figure 1d).
Relationship of baseline serum potassium levels with all-cause and CVD mortality
Four groups were classified according to baseline serum potassium levels at cut-off points of 4 mmol/L, 5 mmol/L and 6 mmol/L, and there were no statistically significant differences in dietary potassium intake between the four groups (Supplementary Table 2). Compared with patients in the serum potassium 4–<5 mmol/L group, patients in the ≥6 mmol/L group showed a 36 % (aHR: 1·36, 95 % CI: 1·00–1·86, P = 0·051) higher risk of all-cause mortality and a 59 % (aHR: 1·59, 95 % CI: 1·06–2·38, P = 0·025) higher risk of cardiovascular mortality (Supplementary Table 3).
Sensitivity analysis
Several sensitivity analyses were performed to evaluate the robustness of the primary findings. After additional adjustment for dietary protein, fibre, fruit and vegetable intake (model III), the association between total dietary potassium intake and all-cause mortality and the association between plant-based potassium intake and cardiovascular mortality were attenuated and no longer statistically significant (Supplementary Tables 4 and 5). However, low plant-based potassium intake remained significantly associated with higher all-cause mortality (T1 v. T3: aHR 1·57, 95 % CI 1·11–2·21; P = 0·010).
Excluding baseline serum potassium from the multivariable models (model IV) did not materially alter the primary findings (Supplementary Tables 4 and 5).
After excluding deaths occurring within the first year of follow-up, the associations remained consistent with the primary analyses (Supplementary Tables 6 and 7).
In competing-risk analyses, treating kidney transplantation as a competing event did not materially change the results (Supplementary Table 8). When non-cardiovascular death was considered a competing event, the association between plant-based potassium intake and cardiovascular mortality was attenuated and no longer statistically significant (Supplementary Table 9).
Discussion
In this prospective cohort study, lower dietary potassium intake was associated with increased all-cause mortality in MHD patients, and lower plant-based potassium was associated with both all-cause and cardiovascular mortality. Linear dose–response patterns were observed for total potassium with both outcomes and for plant-based potassium with all-cause mortality, but not with cardiovascular mortality. These associations may be partially explained by differences in overall dietary patterns and nutritional status. Adjustment for dietary quality indicators attenuated several observed associations, particularly those involving total dietary potassium and cardiovascular mortality, suggesting that dietary quality may partially contribute to these relationships (model III). The persistence of the association after adjustment for dietary fiber, fruit, vegetable and protein intake suggests that plant-based potassium intake may capture additional aspects of dietary quality beyond these measured dietary factors.
Mean daily potassium intake was 1357·4 ± 481·3 mg/d, lower than the regional general population average of 1800 mg/d(Reference Du, Neiman and Batis17), likely reflecting dietary practices and nutritional characteristics commonly observed in MHD populations.
Our finding aligns with Narasaki et al(Reference Narasaki, Okuda and Kalantar11) and the MADRAD cohort (2·65-fold increased mortality with lowest intake). However, other data present a more complex picture: a multinational study found an inverse association with non-cardiovascular mortality that attenuated after adjusting for healthy food groups(Reference Bernier-Jean, Wong and Saglimbene12), while the NIED study linked higher potassium intake to increased mortality(Reference Noori, Kalantar-Zadeh and Kovesdy10). These discrepancies may stem from differences in dietary patterns and potassium sources. Western studies often involve higher potassium intakes from animal-based or processed foods(Reference Du, Neiman and Batis17), whereas our cohort from southern China had modest intake predominantly from whole plant sources (vegetables, rice and wheat). Thus, the health impact of potassium is closely tied to its dietary matrix – mortality risk previously attributed to high potassium may reflect consumption of processed or animal-based foods rather than potassium itself. Methodological differences in dietary assessment and confounding adjustment may also contribute(Reference Schatzkin, Kipnis and Carroll18,Reference Shim, Oh and Kim19) .
Clinical practice often restricts plant-based foods in MHD patients due to hyperkalaemia concerns(Reference St Jules, Goldfarb and Pompeii20). Our analysis found that low plant-based potassium was associated with higher all-cause (aHR: 1·54, 95 % CI: 1·19–1·99) and cardiovascular mortality (aHR: 1·50, 95 % CI: 1·05–2·14), consistent with NHANES data showing higher mortality with low-potassium, animal-based diets regardless of renal function(Reference Narasaki, You and Malik21). This pattern may be explained by the benefits of plant-based foods; we previously showed that severe deficiencies in dietary fibre and plant protein are independent risk factors for cardiovascular mortality(Reference Lin, Qin and Yang22,Reference He, Lu and Yang23) . In our cohort, vegetable, fruit and fibre intakes were substantially below recommended levels, suggesting that stringent potassium restriction may inadvertently limit beneficial nutrients. Plant-rich diets improve metabolic acidosis, blood pressure and are linked to lower mortality in dialysis patients, often without adversely affecting serum potassium(Reference Goraya, Munoz-Maldonado and Simoni24–Reference Saglimbene, Wong and Ruospo26). Restricting plant-based foods may also cause deficiencies in antioxidant vitamins and minerals(Reference Dupuis, Brown-Tortorici and Kalantar-Zadeh27–Reference De Nicola, Garofalo and Borrelli29). Dietary fibre from plants enhances intestinal motility, increases fecal potassium excretion, reduces toxin absorption(Reference Saar-Kovrov, Zidek and Orth-Alampour30) and modulates gut microbiota(Reference Stanford, Charlton and Stefoska-Needham31). Potassium bioavailability varies by source: ∼50–60 % for plant-derived, 70–90 % for animal-based and >90 % for processed foods(Reference Picard, Griffiths and Mager32). Processed foods often contain ‘hidden’ potassium (e.g., 693–930 mg/100 g in some items)(Reference Sherman and Mehta33). Processed fruit juices, lacking fibre and with disrupted cellular structure, have particularly high bioavailability(Reference Dicklin, Barron and Goltz34). These findings suggest that hyperkalaemia management should prioritise reducing processed food intake over restricting whole plant-based foods.
Consistent with some prior studies(Reference Bernier-Jean, Wong and Saglimbene12,Reference Gonzalez-Ortiz, Xu and Ramos-Acevedo35,Reference Ramos, González-Ortiz and Espinosa-Cuevas36) , we found no association between dietary potassium intake and serum potassium levels. The NIED cohort reported a weak correlation (R = 0·14, P < 0·05)(Reference Noori, Kalantar-Zadeh and Kovesdy10). Possible explanations include (1) low intake in our cohort insufficient to influence serum potassium and (2) other dietary components (fibre, carbohydrates and base production) affecting potassium handling(Reference Chan, Patwardhan and Ryan37–Reference Preston, Afshartous and Rodco40); potassium chloride supplements taken without food can rapidly raise serum potassium(Reference Preston, Afshartous and Rodco40,Reference Lee, Oh and McDonough41) , as shown in uremic dogs(Reference Winkler, Hoff and Smith42) and (3) homeostatic mechanisms robustly maintain potassium balance(Reference Fouque, Vennegoor and ter Wee7), with compensatory pathways in ESRD including enhanced colonic secretion (threefold higher than normal)(Reference Mathialahan, Maclennan and Sandle43) and insulin-mediated cellular uptake(Reference Palmer and Clegg44).
In sensitivity analyses excluding serum potassium from the multivariable models (model IV), the associations between dietary potassium intake and mortality remained largely unchanged. This finding suggests that the observed relationships were not driven by adjustment for baseline serum potassium and supports the robustness of our primary results. Given the absence of a significant association between dietary potassium intake and serum potassium concentrations in our cohort, serum potassium is unlikely to fully explain the relationship between dietary potassium intake and mortality. These findings further support the concept that dietary potassium intake may reflect broader dietary and nutritional characteristics beyond its effect on circulating potassium levels.
Subgroup analyses generally demonstrated consistent associations across clinically relevant strata, with no statistically significant interactions observed. However, these analyses should be considered exploratory because the study was not specifically powered to detect effect modification. Therefore, the absence of significant interaction should not be interpreted as definitive evidence that the associations are identical across all patient subgroups. Future studies with larger sample sizes are needed to further evaluate potential heterogeneity of effects.
In competing-risk analyses using non-cardiovascular death as the competing event, the association between plant-based potassium intake and cardiovascular mortality was attenuated and no longer statistically significant. This finding suggests that the observed relationship may be influenced by competing causes of death and should therefore be interpreted cautiously.
This study has several strengths, including its prospective multicentre design, detailed assessment of dietary potassium intake by food source and extensive adjustment for demographic, clinical and dietary factors. Several limitations should also be acknowledged. First, residual confounding remains possible despite comprehensive covariate adjustment and additional dietary-quality sensitivity analyses; low potassium intake may represent poorer overall nutritional status or dietary quality rather than a direct potassium-specific effect. Second, dietary intake was assessed only at baseline using three 24-h dietary recalls and may not reflect long-term dietary habits or changes in potassium intake during follow-up. Third, serum potassium was measured only at baseline, limiting our ability to evaluate chronic potassium control or variability over time. Fourth, the analyses examining dietary potassium intake and hyperkalaemia were cross-sectional and therefore cannot establish temporal relationships or predict future hyperkalaemia risk. Fifth, although competing-risk analyses using Fine–Gray models were performed, the number of transplantation events was relatively small, which may have limited statistical power. Sixth, multiple comparisons were conducted across potassium sources and clinical outcomes, increasing the possibility of chance findings. Finally, the study population was recruited from centres in southern China, which may limit the generalisability of our findings to other geographic regions and dietary settings.
In conclusion, lower dietary potassium intake, particularly from plant sources, was associated with higher all-cause mortality among maintenance haemodialysis patients. These associations remained robust across multiple sensitivity analyses and were not accompanied by higher serum potassium levels, suggesting that plant-based potassium intake may serve as a marker of healthier dietary patterns rather than a major determinant of hyperkalaemia risk. Our findings support a more individualised approach to dietary potassium management and raise concerns regarding excessive restriction of plant-based foods in MHD patients. Further prospective studies and randomised clinical trials are warranted to establish evidence-based dietary potassium recommendations in this population.
Baseline characteristics of study participants according to dietary potassium intake levels

Table1. Long description
The table presents baseline characteristics of study participants categorized by dietary potassium intake levels, divided into three tertiles. It includes 1034 participants in total, with 345 in each tertile. The table is structured with columns for total values and values for each tertile, along with p-values indicating statistical significance. Key characteristics include demographics such as age, gender, alcohol consumption, and smoking status. Co-morbid conditions like diabetes mellitus, hypertension, and cardiovascular disease (CVD) are also listed. Laboratory parameters include serum creatinine, potassium, calcium, phosphorus, albumin, triglycerides, cholesterol, and C-reactive protein. Dialysis-related parameters include SpKt/V, dialysis duration, and residual urine volume. Drug usage data covers beta-blockers, RAAS inhibitors, diuretics, and sodium bicarbonate. Dietary parameters include dietary energy intake, dietary protein intake, dietary potassium intake, plant-based and animal-based dietary potassium intake, other dietary potassium intake, dietary fiber intake, vegetable intake, and fruit intake. Each row provides mean, standard deviation, or median values as appropriate, and percentages for categorical variables.
Values are means ± SD or medians [IQR] for continuous variables as dictated by data type and column percentages for categoric variables.
Scr, serum creatinine; TCO2, total carbon dioxide combining power; RAAS, renin-angiotensin-aldosterone system, NaHCO3, sodium bicarbonate; DEI, dietary energy intake; DPI, dietary protein intake.
Supplementary material
For supplementary material/s referred to in this article, please visit https://doi.org/10.1017/S0007114526108460
Data availability statement
The data that support the findings of this study will be available from the corresponding author upon request, after the request is submitted and formally reviewed and approved by the Medical Ethics Committee of Nanfang Hospital.
Acknowledgements
We thank the participants, investigators and study staff for their contributions to this study.
During the preparation and revision of this manuscript, the authors used ChatGPT (OpenAI, GPT-5.5; https://chatgpt.com) for English language editing and refinement. The tool was used solely to improve grammar, spelling, clarity and readability. All scientific content, analyses, interpretations and conclusions were developed and verified by the authors. The authors reviewed and edited all AI-generated output and take full responsibility for the final manuscript.
Author contributions
Conceptualisation: C.Y.X. and M.L.; data collection: C.Y.X., Z.W., Y.Y.Y., Y.H., Y.W., Q.X.Z., Y.M.L., S.L.Y., Y.X.L., Y.H.Z., Y.Z.K., Q.J.W., S.H., Y.L., A.Q.L. and F.N.L.; data analysis: C.Y.X. and Z.Y.Y.; Writing original draft: C.Y.X.; Writing-review & editing: Z.Y.Y. All authors have read and agreed to the published version of the manuscript.
Financial support
This work was supported by the National Key Research and Development Program of China (2021YFC2500200 and 2021YFC2500204); Key Technologies R&D Program of Guangdong Province (2023B1111030004); Clinical Research Fund of Nanfang Hospital, Southern Medical University (2019CR021; 2023CR038); Clinical Research Program of Southern Medical University (LC2019ZD005; LC2024NF003); National Natural Science Foundation of China (82470760); President Foundation of Nanfang Hospital, Southern Medical University (2022H013) and The Program of Introducing Talents of Discipline to Universities, 111 Plan (D18005). The funding sources had no role in the design, analysis or interpretation of the data or the preparation, approval or decision to submit the manuscript for publication.
Competing interests
The authors declare no competing interests.