The study of language contact abounds with ideas about how lexical items from one language enter another, and how they are eventually converted into full-fledged native words. Many scholars believe that these items are taken from a donor language “as is,” that is, code-switched, but by virtue of being repeated often and widely enough, gradually assume more and more characteristics of the recipient language until they eventually become indistinguishable from it—bona fide loanwords (e.g., Myers-Scotton, Reference Myers-Scotton2002; Thomason, Reference Thomason, Janda and Joseph2003; Van Coetsem, Reference Van Coetsem2000). This is a reasonable scenario, and it accords well with a view of language change as gradual. On the other hand, it is also claimed that at any given point in time, it is impossible to distinguish code-switched from borrowed elements. Code-switches composed of a single word (coincidentally the canonical unit of both established loanwords and nonce borrowings) are the most contentious in this regard, but blanket refusals to differentiate all kinds of code-switches, single- and multiword, from borrowed forms persist. Some argue that previous attempts to make such a distinction must fail because the methodology is lacking (e.g., Eastman, Reference Eastman1992; Eliasson, Reference Eliasson1989; Gardner-Chloros, Reference Gardner-Chloros2009; Johanson, Reference Johanson, Extra and Verhoeven1993; Thomason, Reference Thomason2001; Winford, Reference Winford2003). Others insist that that there is no reason to do so, because the distinction is inherently fuzzy, or because they are instantiations of the same process, or represent different points on the same continuum (e.g., Bentahila & Davies, Reference Bentahila and Davies1991; Boyd, Reference Boyd, Hyltenstam and Viberg1993; Boztepe, Reference Boztepe2003; Clyne, Reference Clyne2003; Eliasson, Reference Eliasson1989; Field, Reference Field2002; Haspelmath, Reference Hasplemath, Haspelmath and Tadmor2009; Heath, Reference Heath1989; Myers-Scotton, Reference Myers-Scotton1993a, Reference Myers-Scotton2002, Reference Myers-Scotton2006; Thomason, Reference Thomason, Janda and Joseph2003; Treffers-Daller, Reference Treffers-Daller2005; Winford, Reference Winford, Isurin, Winford and de Bot2009).
It would seem that this question should be decidable on the basis of systematic empirical enquiry, but the cumulative advances of what little quantitative research there is in this field have apparently had little if any impact on the debate. We observe no more consensus on these issues now than was obtained 30 years ago, when the study of bilingual language mixing first became a hot topic. There are a few reasons for this. Some are inherent in the data of language contact. The product of past contact, the established loanword, fully integrated into the recipient-language lexicon, dictionary-attested perhaps for centuries, and unrecognizable to speakers as foreign in origin, reveals little about the pathway by which it came to achieve such status. And synchronic observations of the process of language mixing, in addition to being silent on the trajectory over time, are what gave rise to the long-standing controversy about whether and how to recognize its different manifestations. The situation is exacerbated by the fact that there is so little pertinent data, as will be detailed herein, the (possibly related) methodological predilection for butterfly collecting, and a concomitant devaluing of accountable analyses of large corpora of spontaneous bilingual speech.
Thomason (Reference Thomason2001:134), in reference to loanword integration, which, as a putatively gradual process, can only be measured quantitatively, queried how one could possibly count how often a borrowed item appeared in a language and concluded that “determining the frequency of appearance is a hopeless task.” Though by no means hopeless, it is not in fact possible to determine the relative proportion of borrowed forms without first situating them with respect to the native (i.e., nonborrowed) words in a language or corpus—as the principle of accountability (Labov, Reference Labov1969, Reference Labov1972) enjoins us. Yet bilingual corpora large and rich enough to host such comparisons are not a staple of contact linguistics as typically practiced. The bulk of the published data comes from anecdotal observations; the corpora that do exist are rarely rendered amenable to systematic research, and those that are accessible are seldom surveyed exhaustively using statistical methodology. As a result, linguists have many theories, but little evidence-based idea, of how frequent borrowed items are in general, how many persist and for how long, what actually happens to those that do, and whether they can be distinguished, by the analyst or the speaker, from other manifestations of language contact.
Another factor impeding progress in the area is the undeniable fact that lexical borrowing has not attracted the intellectual excitement generated by the question of how bilinguals manage two grammars, as they must when switching languages intrasententially. Instead, lone other-language incorporations, which are by far the predominant manifestation of bilingual mixing in every language pair empirically studied, are routinely treated by analysts as instantiations of code-switching (Ben-Rafael, Reference Ben-Rafael and Jacobson2001; Bhatt, Reference Bhatt1997; Myers-Scotton, Reference Myers-Scotton and Coulmas1997, Reference Myers-Scotton2006; Park, Reference Park2006; Yoon, Reference Yoon1992, to name but a few). This is the context in which we undertook the long-term research we report on here.
Recognizing that the controversies outlined have both synchronic and diachronic components, and in fact can only be resolved by performing both kinds of analyses, a first challenge was to locate data pertinent to the question of how foreign words and structures become native. A second was to develop and apply a methodology capable of quantitatively tracking the introduction, spread, and eventual integration of these elements into a recipient language, while taking careful account of the structural variability inherent in linguistic systems. We marshal this infrastructure to consider both the synchronic behavior and the diachronic development of single-word or lone other-language incorporations, and in the process, put three widely embraced assumptions to empirical test.
1. Lone other-language items introduced as nonce words typically increase in frequency and diffusion. Let us call this the diffusion assumption.
2. Lone other-language items are introduced in donor-language phonological, morphological, and syntactic form (i.e., as code-switches), but in tandem with their increase in frequency and diffusion, they are gradually integrated into recipient-language structure (become bona fide loanwords). We refer to this as the graduality assumption.
3. At any given point in time, and possibly throughout the process, single-word code-switches cannot be distinguished from (nonce) borrowings. This is the identity assumption.
The remainder of this paper is organized as follows. We first describe the unique dataset that enables us to carry out the analyses we report here, as well as the variationist methodology used to exploit it. We then address the diffusion and graduality assumptions, focusing first on the trajectory and then on the grammatical treatment over time of lone other-language items, by tracking those nonce forms that persist and spread, and comparing their behavior to that of ephemeral and inveterate nonce types, which turn out to be far more prevalent. The following section responds to the identity assumption, by examining the synchronic treatment speakers accord nonce forms vis-à-vis the other language-mixing strategies they employ, namely code-switching of multiword sequences and use of more frequent single-word items. Their degree of linguistic integration, that is, adaptation or lack thereof to recipient-language structure, is measured on five diagnostics specifically selected to reveal which grammar is operating at the moment the other-language item is accessed. These measures speak to both the graduality and identity assumptions. We conclude with some reflections on the processes bilingual speakers activate when they combine languages in bilingual discourse.
DATA AND METHOD
Data
The data we bring to bear on these assumptions are unusual enough in the study of language change, let alone language contact, to warrant describing them in some detail. They consist of three diachronically related spoken-language corpora of Quebec French, containing varying amounts and types of English material, collected over a real-time period of 61 years (1946–2007), and featuring an apparent-time span of nearly a century and a half between the dates of birth of the oldest and youngest speakers (1846–1994). This may represent a blink of the eye in comparison with the time frames historical linguists like to work with, but the limiting factor is that the processes (as opposed to the products) of language mixing can only be observed during actual speech production. We will nonetheless show in what follows that the interval is sufficiently long to measure the trajectory that lone other-language items follow over time.
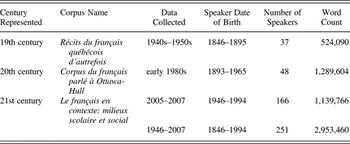
The earliest materials, drawn from the Récits du français québécois d'autrefois (Poplack & St-Amand, Reference Poplack and St-Amand2007), consist of audio recordings of elderly Québécois born between 1846 and 1895, which, as we have shown elsewhere, may be taken to represent 19th-century Quebec French. The speech data they contain, collected by folklorists in the 1940s and 1950s, are highly informal in nature, and although they represent a precontact stage vis-à-vis the contemporary context, nonetheless they contain ample incorporations from English, as illustrated in (1). These appear in italics in this and following examples.
(1) “Bien”, il dit, “tenez, m'en vas faire un bargain avec vous.” (19C.038.887)Footnote 1
“Well,” he says, “here, I'm gonna make a bargain with you.”
A second dataset, Corpus du français parlé à Ottawa-Hull (Poplack, Reference Poplack, Fasold and Schiffrin1989) was constructed in the early 1980s. It remains unique in terms of scale, representativeness (of speakers and speech styles), and focus on spontaneous speech production collected within a bilingual community in intense and long-term contact. The 48 Québécois retained for this study, of varying degrees of bilingual ability, employ a vast array of lone other-language items (Poplack, Sankoff, & Miller, Reference Poplack, Sankoff and Miller1988), as in (2), in addition to a variety of other language-mixing strategies.
(2) Puis là ils shootaient la balle, puis encore, envoye dedans la swamp! (20C.77.479)
And then they were shooting the ball, and again, right into the swamp!
The final corpus, Le français en contexte: milieux scolaire et social (Poplack, Bourdages, & Dion, Reference Poplack, Bourdages and Dion2009), was collected 25 years later (2005–2007) in the same area. The spontaneous speech materials retained here, exemplified in (3), were furnished by 166 bilingual francophones, mostly teenagers.
(3) Les bigs, les riches, ils ont—ils ont tout tout tout! (21C.155.810)
The big guys, the rich, they have—they have absolutely everything!
We refer to these datasets in what follows as 19th-, 20th-, and 21st-century French, respectively. As summarized in Table 1, in addition to their time depth, they provide approximately three million words of bilingual speech, more than enough to enable meaningful measures of frequency and persistence, and the 251 speakers retained are sufficient to measure diffusion. Properly exploited, these materials afford a rare opportunity to consider simultaneously both the synchronic behavior and the diachronic development of lone other-language items.
Characteristics of the data used for the current study

Note: Speaker and word count information refer to the subsamples analyzed here.
Method
The variationist comparative method that we have developed for study of these issues has been amply described elsewhere (e.g., Poplack, Reference Poplack and Preston1993; Poplack & Meechan, Reference Poplack and Meechan1998; Poplack & Tagliamonte, Reference Poplack and Tagliamonte2001; Tagliamonte, Reference Tagliamonte, Chambers, Trudgill and Schilling-Estes2001). Suffice it to recall here the major principles that inform this approach. The first involves the primacy of the spoken language, which, in the case at hand, is the only place where the processes of language mixing can be observed. The second is the recognition of the variability inherent in all speech. Where more than one language is present, this may manifest itself as apparent departures from the grammars of one or both. Ironically, because variability is so rarely acknowledged, even in unmixed languages, scholars of language contact often call for more homogeneity from bilingual production data than has ever actually been attested in monolingual speech. Part of our goal is to identify such variability and make use of it as a tool to measure integration.
A related principle is accountability, the commitment to quantitatively examining all the pertinent data, to counting, and to situating the phenomena of interest with respect to other competing forms and systems. In treating variability accountably, we are compelled to go beyond mere frequency counts to detect structure, and this is what enables us to assess, for instance, when superficially bare forms are displaying variable recipient-language marking patterns, or are simply unmarked.
Finally, application of the comparative method allows us to dispel many unsupported assumptions about the results of language contact. We contextualize the elements of interest by comparing them (1) among each other (i.e., with respect to other mixing strategies), (2) over time, and (3) with respect to unmixed counterparts as controls. We also compare the behavior of the bilingual speakers (switchers vs. borrowers) who produced the forms.
Measuring integration
To measure level of integration, we appeal to the behavior of linguistic features associated with one of the grammars in contact. As we have argued elsewhere (Poplack, Reference Poplack2012; Poplack, Sankoff, & Miller, Reference Poplack, Sankoff and Miller1988; cf. also Bullock, Reference Bullock, Bullock and Toribio2009), recipient-language phonology often colors donor-language items even in the absence of mixing (“foreign accent”), so phonological criteria are not reliable indicators of loanword integration. Accordingly, the diagnostics examined here involve the syntax and morphology: word order; tense-marking in verbal constructions; and the expression of reference, number, and gender in nominals. We compare the treatment of lone other-language items at conflict sites (Poplack & Meechan, Reference Poplack and Meechan1998), areas where the grammars of two languages differ, in rate and/or in conditioning. To the extent that a lone other-language item assumes features associated with one but not the other of the contact languages (e.g., absence of inflection in a context where the other language inflects), we can infer whether donor-language or recipient-language grammar is operating.
FREQUENCY AND DISTRIBUTION OF MIXING STRATEGIES
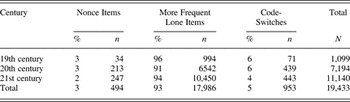
Before addressing any of the assumptions directly, it will be useful to characterize the data we will be analyzing. Numerous unusual or exceptional types of mixed constructions and intermediate categories have been cited in the literature. The format of our corpora, which are fully transcribed and computerized, enables us to locate and identify these readily, and to situate them with respect to each other. Nearly all turn out to fall into one of only three major mixing strategies—incorporation of lone nonce items from the other language, incorporation of lone more frequent items from the other language, and multiword switching to the other language. These in turn are very unevenly distributed (Table 2).
“Canonical” distribution of three categories of mixing strategies

We note in particular the extreme rarity of code-switches and nonce items on the one hand, and the huge disproportion of more frequent lone other-language items on the other. This pattern repeats itself over three independent corpora and time periods and, in fact, is familiar from previous reports on other datasets and language pairs; the preponderance of single-word other-language items vis-à-vis multiword fragments is the canonical distribution of language-mixing strategies.
THE DIFFUSION ASSUMPTION
To what extent do the lone other-language items introduced as nonce forms feed into the category of more frequent lone items, including established loanwords? The diffusion assumption holds that they typically increase in frequency and diffuse across speakers. This assumption in turn appears to stem from the inferences that (1) a nonce instantiation of a foreign word can be equated with the first stage of a lexical innovation, (2) more frequently occurring foreign words represent a later stage in this development, and (3) the transition between stages is manifested synchronically in the relationship between a nonce token of one English-origin lexical type (e.g., squeezait) and multiple tokens of an institutionalized loanword (e.g., chum). The (unstated but nonetheless operative) idea that the behavior of the latter can somehow enable us to predict the development of the former is dictated by the limitations of synchrony: a lexical type cannot be a nonce and more frequent item at the same point in time. In this portion of the analysis, we resolve this problem by drawing on our diachronic data to track, for the first time, the trajectory of specific nonce lone other-language items.
As is well known from the lexicographic literature on monolingual nonce-formations (e.g., Bauer, Reference Bauer1983; Hohenhaus, Reference Hohenhaus, Stekauer and Lieber2005, Reference Hohenhaus and Munat2007; Lipka, Reference Lipka1994; Schmid, Reference Schmid2008), and as will also become evident from the results of the ensuing analyses, the proper identification of nonce items is by no means straightforward. This is because the property of uniqueness, the sine qua non of a nonce form, cannot be verified for the speech community as a whole. Words that are unknown to some speakers may be familiar to others. Likewise, words that are rare in one corpus may be frequent in another. Absent a better solution, here we adopt standard but stringent text-related measures of frequency of occurrence. We recognize that their significance with respect to specific lexical types may be only approximate, but we will show that the aggregate linguistic behavior of the lone other-language items identified as nonce in these corpora is generalizable over other nonce lexical types, at least in the three speech communities under study.
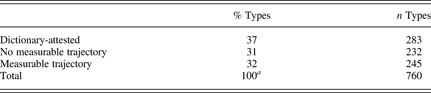
We began by locating, in each of the three diachronically related corpora, all lone English-origin words that met the following technical definition of nonce form: uttered exactly once, by a single speaker in a given corpus. This yielded a robust initial dataset of 2139 tokens of 760 lexical types. Relatively few of them turned out to be pertinent to the question of how nonce forms develop over time, however, as illustrated in Table 3. For one thing, more than a third turned out to already be dictionary-attested, despite occurring only once in our corpus.Footnote 2 Because these are arguably not innovations, we limit the data to the remaining unattested nonce types. Nearly half of those first appeared in the 21st century, meaning that their trajectory could not be measured. This left 245 types with a measurable trajectory, in other words, appearing as a nonce in one corpus and one or more times again in a later corpus. The analyses presented in what follows are thus restricted to these unattested lone other-language items first uttered once by a single speaker in the 19th- or 20th-century corpus.
Distribution of nonce lone other-language items (n = 2139)
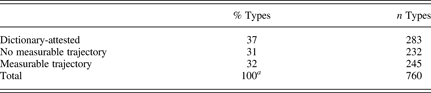
Note: aEight “false” nonces—occurring once at one time period, but more frequently at a preceding one—were also excluded.
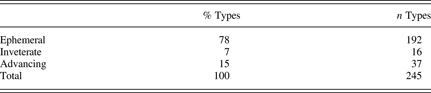
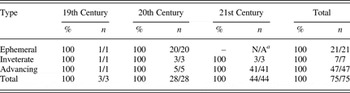
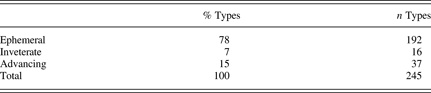
Table 4 summarizes the distribution of these nonce forms. The vast majority are ephemeral: they simply disappear. Another 16 types, to which we refer as inveterate, remain nonces, that is, they appear again only once at a later stage. Only 15% of the 245 eligible types persist and increase in frequency. These are the advancing nonces.
Distribution of nonce lone other-language items with a measurable trajectory (n = 245)
Frequency of advancing nonces
Because of their sparseness, we required only that nonce forms transcend noncehood (i.e., that they be uttered again) to qualify as advancing. But to achieve dictionary attestation, or even acceptance in the community, a form must enjoy a much higher level of frequency and diffusion than that. How much can an advancing nonce type be expected to increase over an intermediate time frame like that studied here?
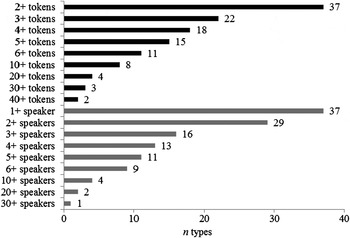
Figure 1 shows that of the 37 original advancing nonce types, only 8 could be qualified as frequent (based on Poplack, Sankoff, & Miller's [1988] criterion of 10+ occurrences): shit (n = 73), friend (44), pitch (38), drop (24), bullshit (17), hot (16), shot (15), and weird (11).Footnote 3 In terms of diffusion, they fare even worse. Only four types spread beyond 10 speakers: shit (32), pitch (22), hot (11), shot (11).
Token frequency (black) and diffusion across speakers (gray) of advancing nonces (based on tokens in a later corpus of lexical types that appeared as nonce forms in an earlier corpus).

We conclude that nonce lone other-language items are basically ephemeral. The overwhelming majority disappears after their first introduction. The few that do not disappear persist as nonce forms. Only a very small cohort actually increases, and almost none reaches even a minimal level of diffusion, by any measure. Thus, a first important finding is that so few lone other-language items actually stand the test of time. Nonce forms do not generally become widespread, as the diffusion assumption suggests. Instead, much as with monolingual nonce-formations and neologisms, only the tiniest proportion “catches on” (e.g., Hohenhaus, Reference Hohenhaus, Stekauer and Lieber2005; Schmid, Reference Schmid2008).
Also as with monolingual lexical expansion, there seems to be no way of predicting which ones they will be. Certainly the particular advancing lone other-language items documented here cannot be explained by recourse to any simplistic (but widespread) view of the enhanced borrowability of cultural versus core borrowings (e.g., Myers-Scotton, Reference Myers-Scotton1993a, Reference Myers-Scotton2006; Thomason, Reference Thomason2001).
THE GRADUALITY ASSUMPTION
We now consider the trajectory of the advancing nonce types. Are they introduced in donor-language linguistic form, only to become integrated into recipient-language structure as they increase in frequency and diffusion, as per the graduality assumption? This is a diachronic question; to address it, we must track the treatment of the same erstwhile nonce incorporation over time. In this portion of the analysis, then, the key data will come from the elusive advancing nonces, examined at each stage of their development, as illustrated with the verb pitcher ‘pitch, throw’ in (4).
We then situate their behavior with respect to the other types of nonce lone other-language items with a discernible trajectory: ephemeral and inveterate (Table 4). Level of integration is measured by the linguistic treatment accorded each of the three categories of nonce word, calculated on the basis of the diagnostics of verb inflection, plural marking, determiner realization, gender consistency, and adjective placement.
(4)
a. 19th century (nonce)
Toujours que la jument elle pitchait puis elle marchait, puis elle voyait. (19C.023.755)
Still, the mare, she was pitching, and she was walking, and she could see.
b. 20th century (2 tokens)
En septembre, il y a eu des kids qui ont pitché des roches dans les vitres, tu sais? (20C.073.819)
In September, there were kids who threw rocks at the windows, you know?
c. 21st century (26 tokens)
Il fallait pitcher du riz comme pendant le marriage, comme au début. (21C.154.694)
We had to throw rice like during the wedding, like at the beginning.
Verb inflection
Perhaps the most straightforward diagnostic is verbal morphology. When an English-origin verb is incorporated into French, the speaker must choose between French or English inflection, as illustrated in (5). According to the graduality assumption, a nonce verb form should feature only English morphology at its first introduction and in the early stages of diffusion, whereas subsequent tokens should appear more and more often with French morphology until the type is completely integrated into the French system.
(5)
a. A few planes crashed in the World Trade Center. (21C.157.70)
b. Le building est en feu, il y a une- un avion qui acrashé dedans. (21C.157.114)
The building is on fire, there's a- a plane that crashed into it.
The examples in (4) and (5) contradict this scenario, however: in (4a) French morphology appears at the very first mention of the form in the corpus, (5a) features English morphology on crash in a clause entirely in English, whereas in (5b), produced by the same speaker a few seconds later, French morphology appears on crash as a lone other-language item.
Given the inflectional poverty of both English and French, most verbs surface with no visible morphology at all, as in (6). These are necessarily silent with respect to integration.
(6) Je les blast [ ] tout de suite là-dessus. (21C.501.334)
I blast them right away about that.
We therefore limit these analyses to English-origin verb forms with morphology that is unambiguous as to language membership (7).
(7) Il arrête mi-chemin, il dropØ [FR 3rd p. sg. present indicative] toute son stuff, commence à brailler à cause c'est trop dur. (21C.165.56)
He stops mid-way, he drops [ENG 3rd p. sg. present indicative] all his stuff, starts crying because it's too hard.
Table 5 tracks the rate of French verbal morphology on the three classes of nonce verbs over time. Regardless of whether they are ephemeral, inveterate, or advancing, nonce verb forms are always integrated into French. The strategy, conjugate English-origin verbs using the appropriate 1st-conjugation (-er) morphology, applies categorically to all.
Rate of French affixation on three types of nonce verbs over time

Note: aAs detailed in the first section, nonce forms first occurring in the 21st century have no discernible trajectory; there is no way to determine whether they will turn out to be ephemeral. This category is thus not applicable here and in subsequent calculations.
On the measure of verb morphology then, there is no support for the idea that nonce forms become integrated into recipient-language grammar gradually, in tandem with increases in frequency and diffusion. They do so categorically at first mention.
Plural marking
The next diagnostic involves plural marking. English marks plural productively by affixing a phonotactically determined [s,z] to the noun, whereas the French plural marker, although orthographically also {s}, is phonetically null, as in (8).
(8) Il fallait qu'on corrige les fautes[Ø]. (21C.109.1386)
We had to correct the mistakes[s].
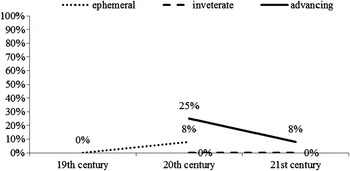
The graduality assumption also predicts that English-origin nonce nouns with plural referents should first be rendered with an English plural affix, and subsequent mentions should show ever fewer overt realizations as they become more frequent and widespread. Figure 2 tests this assumption by examining rates of overt plural marking of three categories of semantically plural nonce nouns over time.
Rate of English affixation on three types of plural nonce nouns over time (n = 106).

We first note that the rate of English [s] is in general extremely low (and French null affixation correspondingly high), regardless of type of nonce. This is not what would be expected under the graduality assumption. Moreover, what movement we can detect over time appears at first glance somewhat erratic. Although none of the ephemeral nonce items are overtly marked for plurality in the 19th century (0/11), 8% (3/38) appear with an overt [s] in the 20th century.Footnote 4 On the other hand, the 25% (1/4) English morphology displayed by advancing nonces in the 20th century does descend to 8% (4/48) by the 21st, which is more in line with the predictions of gradual integration.
However, closer inspection weakens even these modest trends. In fact, only eight nonce nouns of any category appeared with an overt [s] at any stage. And in all but one of these cases, the [s] is lexicalized and not a plural marker, as illustrated in (9). The collocation of guts in (9c) with the singular determiner du points up the opacity of [s] in these constructions.
(9)
a. Excuse mon anglais, mais les odds [z] sont là. (20C.078.645)
Excuse my English, but the odds are there.
b. Le juge il regarde les pros and cons [z], puis va pour le meilleur. (20C.076.1376)
The judge looks at the pros and cons, and goes for the best.
c. Moi personnellement, je ferais pas ça, aller à l’école de meme là, je trouve qu'il a du guts [s]. (21C.157.930)
I personally would not do that, go to school like that, I think he's got guts.
When the false plurals are excluded from calculations of marking rates, we find near-categorical integration into recipient-language grammar. Only once, out of 106 English-origin nonce forms with plural reference, was an overt [s] actually used to signal plurality (10).
(10) Un de mes amis, il dit, “on va aller manger des wieners [z]”. Puis c’était des saucisses! (20C.098.1400)
One of my friends, he says, “let's go eat some wieners.” And they were sausages!
With respect to the criterion of plural marking, then, there is no evidence to suggest that integration increases as nonce nouns gain in frequency. On the contrary, with only one exception, they start off integrated into French and remain that way.
Determiner realization
The next diagnostic, determiner realization, differs from the previous two insofar as both French and English admit both overt and null determiners in some contexts, as illustrated in (11). This is thus is a good example of a conflict site involving distribution, here, of bare forms.
(11)
a. And was likely higher in 1981, when Øprices hit an all-time height [sic]. (20C.082.673)
b. C'est rien que pour ouvrir uneporte, être Ødoorman, dire allô. (20C.112.902)
It's only to open a door, be a doorman, say hello.
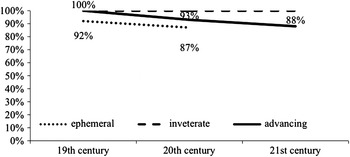
Null determiners are much more frequent in English than in French, with the result that a relative preponderance of them tends to be associated with the operation of English grammar. Figure 3 measures rate of overt determiner presence in the three types of nominal nonce formation.
Rate of determiner presence on three types of nonce nouns over time (n = 294).

The vast majority, of whatever ilk, do feature an overt French determiner, as would be expected if they were being treated as French, though the decrease over time, particularly evident in the case of the advancing nonces, again appears to contradict the graduality assumption. But simply equating rate with grammatical structure ignores the fact that although a null determiner is avoided in most French contexts, it is admitted, and even prescribed, in others, as illustrated in (12), and these in turn differ from legal contexts for null determiners in English (e.g. plurals, generics, and indefinites).
(12) Some legal contexts for null determiners in French:
a. Preceding a subject attribute:
J'engage une de vous autres pour être Øbabysitter. (20C.105.1651)
I'm hiring one of you guys to be a babysitter.
b. Following partitives and certain prepositions:
Okay, j'ai tellement deØbullshit dans mes arguments, ça a pas d'esti d'allure! (21C.505.58)
Okay, I have so much bullshit in my arguments it makes no damn sense.
c. One-word responses:
[IVer] C'est quelle ta position préféréé? [105] Pitcher. (21C.105.265)
Which is your favourite position? Pitcher.
d. In metalinguistic commentary:
C'est Ølarboard, puis Østarboard en anglais, puis Øtribord puis Øbâbord en français. (19C.040.597)
It's larboard and starboard in English, and tribord and bâbord in French.
Closer inspection revealed that all 33 English-origin nominals with a null determiner occurred in one of these legal contexts for zero determination in French. The apparent changes in rate of determiner presence depicted in Figure 3 are due to (fortuitous) differences in determiner requirements, as illustrated in the pairs in (13) and (14). The indefinite reference in the 19th-century example (13a) requires an overt indefinite determiner, for instance, whereas the one-word response in the 21st-century example (13b) does not.
(13)
a. 19th century:
“Mais,” il dit, “ma femme, prends unpitcher, puis va-t-en.” (19C.038.589)
“But,” he says, “my wife, take a pitcher and get out.”
b. 21st century:
Tu es quelle position? [105] ØPitcher. (21C.105.262)
What position are you? Pitcher.
(14)
a. 20th century:
Non, ça c'est de labullshit ça. (20C.076.1484)
No, that's bullshit.
b. 21st century:
Mais la guerre c'est toute une question de Øbullshit pour moi. (21C.175.223)
But war is all a matter of bullshit to me.
Once we take these facts into account, we see that here too, patterns of determiner usage are 100% consistent with those of the recipient language, immediately at the first introduction of the nonce form.
Gender assignment and agreement
The final conflict site to be analyzed diachronically involves grammatical gender. In contrast to English, where the few nominal gender indications that exist are displayed on a small subset of nouns with animate referents (e.g., man-cub, waitress), all French nouns carry gender, which is canonically marked on eligible determiners, adjectives, participles, or other modifying gender carriers, as in (15).
(15) Là après ça, Steve Vai est arrivé, la (f) crowd est partie folle (f) là. (21C.157.324)
So after that, Steve Vai got there, the (f) crowd went nuts (f).
By virtue of being slotted into a syntactic structure requiring a gender carrier, other-language nouns such as crowd receive gender automatically; in other words, gender assignment is a “free” consequence of syntactic integration. The measure of interest is thus not whether gender was assigned (as presence of a gender carrier entails presence of gender), or even which gender was assigned (a question treated in detail in Poplack, Pousada, & Sankoff, Reference Poplack, Pousada and Sankoff1982), but whether that gender fluctuates with each mention or gets fixed. Under the graduality assumption, we might expect the gender first assigned to a nonce noun to vary across the different iterations of that noun in the earlier stages and eventually become fixed as it increases in frequency and diffusion.
To test this assumption, we compared the degree of consistency in gender marking of early tokens of nominal nonce types with their more frequent uses over time. As with the ambiguous null verbal morphology, this endeavor is complicated by the fact that in actual production, most elements are neutral in terms of overt gender indications, as illustrated in (16).
(16) Ils ont la tête rouge, puis ils ont des (m? f?) freckles. (20C.109.1307)
They're redheads, and they have (Ø) freckles.
The analysis is therefore necessarily restricted to those lone other-language items that were accompanied by gender carriers that in fact identify gender (such as the determiner and participial adjective in (15)).
Restriction to those nonce types that (1) recurred at a later period (i.e., inveterate or advancing) and (2) were accompanied by identifying gender carriers inevitably results in a severely reduced dataset relative to those available for the other diagnostics, but one which nevertheless proves revealing.
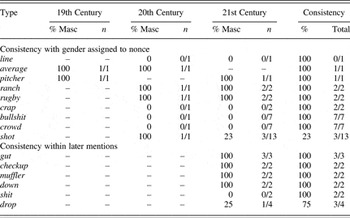
Table 6 calculates the number of masculine gender assignments to a noun over time, as well as an overall gender consistency score between nonce and later mentions. For those nonces displaying gender indications in Period 1, whether inveterate or advancing, we find, remarkably, that the gender assigned at the very first (nonce) mention is retained at subsequent mentions. In other words, there is close to 100% gender consistency, regardless of the ultimate frequency of the form. This is nicely exemplified with the treatment of crowd (15, 17, 18), first assigned feminine gender in the 20th century.
(17) 20th century:
Ça serait des menteries de vous conter qu'il y en avait pas, de sur- sur une (f) crowd de même de deux, trois-cents (20C.105.1178)
I'd be lying if I said there weren't any, in- in a (F) crowd like that of two, three hundred.
(18) 21st century:
a. Je continuais parce que, tu sais, sinon la (f) crowd aurait comme chié. (21C.157.504)
I went on, because, you know, otherwise the (f) crowd would have had a fit.
b. Ah, dans la (f) crowd, ouin. (21C.151.560)
Oh, in the (f) crowd, yeah.
c. Il jouait de même en sautant sur un- une jambe dans la (f) crowd, il a faite le tour dans la (f) crowd, il courait de même dans la (f) crowd au complet. (21C.157.321)
He played like that while hopping on one foot through the (f) crowd, he made the rounds through the (f) crowd, he was running like that through the (f) whole crowd.
d. Il montait, puis il allait sur la (f) crowd de même. (21C.157.344)
He went up, and then he went into the (f) crowd like that.
Consistency in gender assignment over time

Only shot, a lone other-language item assigned masculine gender in the 20th century (19a), displays some variability in the 21st (19b, 19c), consistent with the gradual integration scenario, although at 77% feminine, it too has achieved a high level of gender consistency.
(19)
a. J'en parle un (m) shot. (20C.081.1576)
I'm talking a (m) whole lot.
b. Souvent là, il y a du monde qui me laissent des dix piastres d’un (m) shot. (21C.173.156)
Often there are people who leave me 10 bucks at a (f) time.
c. Ça donne mal au coeur quand tu le bois juste d’une (f) shot. (21C.109.1868)
It makes you nauseous when you drink it all in one (f) shot.
As displayed in the lower half of Table 6, there was also 100% consistency in advancing nonces that occurred in gender-neutral contexts in Period 1, but whose gender consistency could be assessed as of Period 2. The one exception, shown in (20), appears to be semantically motivated. The token of drop assigned masculine gender (20a) refers to a snowboard move, whereas those assigned feminine (20b to 20d) all refer to a type of baseball pitch.
(20)
a. Descends puis tu fais un (m) drop là. Tu fais juste sauter. (21C.153.597)
Go down and make a (m) drop (=snowboard move). You just have to jump.
b. Sur la (f) drop tu tournes d'une autre manière. (21C.105.328)
On the (f) drop (=baseball pitch), you turn in a different way.
c. Admettons une curve, ou une (f) drop, ou une euh- moi j'en connais juste trois là. (21C.105.321)
Let's say a curve, or a (f) drop, or, uh, I only know of three.
d. La curve quand ça curve, la (f) drop, quand ça drope, puis euh la change-up. (21C.105.323)
The curve when it curves, the (f) drop when it drops, and the change-up.
With only two exceptions, then, results on this diagnostic again provide strong support for abrupt integration of nonce types into French grammar, through consistent agreement with the gender first assigned to the nonce form over time. This degree of gender consistency is particularly remarkable in view of the gender variability documented for unmixed French (Klapka, Reference Klapka2002), as in (21).
(21)
a. Prendre une (f) bière avec les gars. (20C.076.315)
Grab a (f) beer with the guys.
b. Bien, des fois, c'est pareil comme prendre un (m) bière, fumer un joint, tu sais? (20C.076.1134)
Well, sometimes, it's like having a (m) beer, smoking a joint, you know?
Evaluation of the graduality assumption
In this section, we have traced the development of specific lexical items from the time of their introduction as nonce forms over 61 years of real time. Taking as a measure of an item's integration its co-occurrence with grammatical elements typically associated with recipient-language grammar, we found no evidence that these items were integrated gradually. On the contrary, lone other-language items assumed French grammatical structure while still at the nonce stage. Even where rates of integration did not reach the 100% displayed by say, English-origin verbs, patterns of integration of the same nonce items at a later period were virtually always already visible in the earlier period. Thus the distribution of overt and null determiner expression on all lone other-language items always coincides with that of French; plural marking is 99.8% compatible with that of French; and even later gender assignments are consistent with those first assigned to all types for which this could be measured but one. With only one clear exception, nonce lone other-language items assume French grammatical structure at their first mention.
This suggests that when speakers access a lone other-language item, they make an instantaneous decision about whether to treat it as a borrowing or a code-switch. If they opt to borrow it, they produce it with all the requisite recipient-language morphosyntactic trappings, variability included, independent of considerations of frequency, diffusion, or listedness. What if they opt to code-switch? Based on the criterion of retaining donor-language grammar, speakers apparently do not avail themselves of this option with respect to lone other-language items. Of the 601 tokens of unambiguous nonce lone other-language items studied diachronically, only one could qualify as a code-switch (wieners in (10)). In other words, lone other-language items tend to be borrowed, and borrowings are introduced already as borrowings, even if the vast majority of them will not go on to become bona fide loanwords.
THE IDENTITY ASSUMPTION
The validity of our claim—that lone other-language items tend to be borrowed, with instantaneous morphosyntactic integration—rests on the correct identification of (nonce) borrowings, and as we observed, this is the subject of acrimonious debate. This brings us to the identity assumption: at any given point in time, (single-word) code-switches cannot be distinguished from (nonce) borrowing.
Determining how different manifestations of language contact such as borrowing and code-switching are handled simultaneously requires a synchronic analysis. But as we noted at the outset of this paper, at the root of the abiding controversy over the identity assumption is the question of how to classify the huge quantities of lone other-language items that make up such a disproportionate part of any synchronic corpus of language mixing (Table 2). Those who claim that single-word code-switching cannot be distinguished from (nonce) borrowing seem to take this (in the first instance methodological) issue as an article of faith. Indeed, code-switching theories such as the Matrix Language Frame model (Myers-Scotton, Reference Myers-Scotton1993a, et passim) are built on the identity assumption; it is thus fully in the interests of their proponents to endorse it.
Accordingly, rather than further belabor the (largely theory-internal) controversy over whether analysts can distinguish the strategies, in this section, we ask how bilingual speakers handle them, addressing in the process doubts that the categories of code-switching and borrowing have a discrete psychological or social reality (e.g., Gardner-Chloros, Reference Gardner-Chloros2009).
We now compare the way the same individuals treat other-language material occurring as (1) nonce forms, (2) more frequent items, and (3) unambiguous code-switches. Recall that nonce forms have been defined as unattested lone other-language items uttered once by a single speaker, more frequent items are those that occurred at least twice, and code-switches are multiword sequences of English preceded and followed by French. The three utterances in (22), all produced by Speaker 082, illustrate the categories on which the following analyses are based.
(22)
a. Nonce English-origin noun:
C'est une compagnie allemande et suisse qui fait les ball-bearings Footnote 5 SKW. (20C.082.190)
It's a Swiss-German company that makes SKW ball bearings.
b. More frequent English-origin noun:
Il y avait du gaz dans l'huile (20C.082.1588)
There was gas in the oil.
c. English(-origin) noun within a code-switch to English:
En voulant dire, “the hell with you” tu sais? (20C.082.2142)
Meaning “the hell with you,” you know?
Under the identity assumption, nonce forms (22a) and corresponding items in code-switches (22c) should display parallel linguistic behavior, and this in turn should differ from that of more frequent items (22b), which, as bona fide loanwords, are uncontroversially governed by recipient-language grammar.
Lexical constitution of mixing strategies
We begin by considering the lexical constitution of the three mixing strategies.
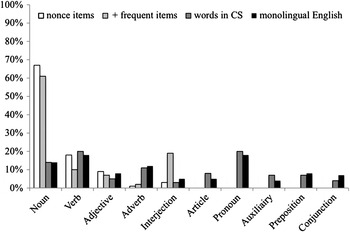
Figure 4 charts their distribution across grammatical categories, with content words clustered at the left, and function words at the right. Both nonce items (the white bars) and more frequent items (the pale gray bar) are almost entirely content words. The odd function word that does occur among the lone other-language items is used meta-linguistically, as in (23).
(23)
a. Je parlais de- d'une fille puis au lieu de dire she (pro), je disais he (pro). (20C.105.2305)
I was talking about a girl and instead of saying “she,” I would say “he.”
b. Il dit “C'est dur pour nous-autres le, la, les”, vois-tu, eux-autres c'est rien que ‘the’ (art). (20C.105.2270)
He says “it's hard for us, le, la, les,” you see, for them it's just the.
Distribution of English words by part of speech. Here, and in subsequent figures, CS = code-switch.

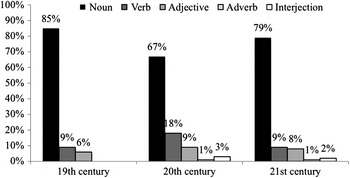
Words within multiword code-switches, however, show no restriction as to part of speech. Half of them are function words. Pronouns, for example, make up 20% of multiword code-switches to English, but are never used alone, surrounded entirely by French. Even content words are distributed differently across the two mixing strategies. Although nouns account for up to two-thirds of all lone other-language items, which is consistent both with the well-documented preference for borrowing nouns (e.g., Haugen, Reference Haugen1950; Muysken, Reference Muysken, Highfield and Valdman1981; Whitney, Reference Whitney1881) and their preponderance in nonce-formations more generally (Hohenhaus, Reference Hohenhaus, Stekauer and Lieber2005, Reference Hohenhaus and Munat2007; Lipka Reference Lipka1994), they make up only 14% of multiword segments. And this distribution is not a quirk of this corpus, but, as shown in Figure 5, remains stable over time. This is the canonical lexical constitution of mixing strategies. If nonce items originate as code-switches, these discrepancies remain unexplained.
Distribution of nonce lone other-language items by part of speech: 19th, 20th and 21st-century corpora.

On the other hand, under the hypothesis that nonce forms are not code-switches but borrowings, the discrepancy in distribution by part of speech is due to the fact that code-switches are fragments drawn unaltered from a donor language and are therefore governed by the grammar of that language. Consistent with this scenario, the English-origin words contained within them are distributed in the same way as those in unmixed English, represented in Figure 4 by the black bar.Footnote 6 On the other hand, the distribution of the lone other-language items, whether nonce or more frequent, resembles neither that of code-switches nor of unmixed English. Rather, even in the early stages, English-origin nonce items pattern with their more frequent counterparts, and both are readily distinguishable from multiword code-switches.
Linguistic integration
We now examine the linguistic treatment the same speaker accords each of her language-mixing strategies, revisiting the same diagnostics we examined with respect to the graduality assumption, and introducing a new one, adjective placement.Footnote 7 The logic of our argument is this: If nonce borrowings are indistinguishable from code-switches, speakers should treat their own nonce tokens of English no differently on each of these measures from the way they treat the corresponding English words contained in their multiword fragments of English. On the other hand, if borrowing lone other-language items is essentially different from code-switching multiword fragments, the former should behave just like the attested loanwords contained within the category of more frequent items.
Verb inflection
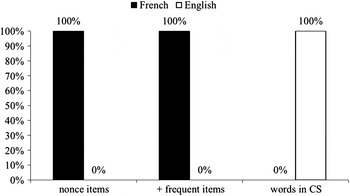
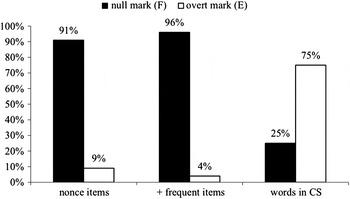
Figure 6 compares verbal morphology across the three categories of other-language verbs. It lends no support to the identity assumption. Instead, both nonce and more frequent lone other-language items conform to French morphological rules. By contrast, within multiword fragments of English, only English grammar is operative. On the measure of verb morphology then, speakers do not treat their single-word incorporations the same way they treat code-switches.
Language of affix on verbs in three language-mixing categories (n = 721).

Plural marking
We saw earlier that semantically plural nonce lone other-language items virtually always feature the French null plural affix. How do they compare with the other mixing strategies?
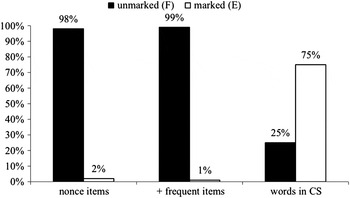
Figure 7 shows remarkable parallels between both sets of lone other-language items, nonce and more frequent. Almost all of them are rendered with the French phonetically null marker, whereas those occurring within code-switches almost always occur with an appropriate English marker. In each case, there are a few outliers, however. For the nonce forms, we already saw that most involved false plurals of the type illustrated in (9); the same is true of the more frequent lone other-language items (24).
(24)
a. Tu remets tes jeans [z], tu t'en vas. (20C.086.947)
You put your jeans back on, you go.
b. Moi j'avais des culottes britches [z]. (20C.080.251)
I had a pair of britches pants.
c. Puis dans chambre, bien là les shorts [s] tu changeais, n'importe quoi. (20C.080.2358)
And in the room, well, you changed your shorts there, whatever.
Marks on plural nouns in three language-mixing categories (n = 173).
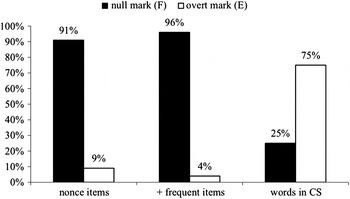
There is also a small component of phonetic variability, illustrated with the lone other-language item short(s) in (25). Such alternate realizations can only be phonetic, because there is no singular form with this meaning. Parenthetically, the same kind of phonetic variability also accounts for the 75% rate of overt plural marking in these speakers’ multiword code-switches to English (26), where (in an ideal prescriptive world) we might have expected 100%.
(25)
a. Ça fait assez longtemps j'ai pas lavé de shorts [Ø]. (20C.112.732)
I haven't washed any shorts for a long time.
b. En petites shorts [s] mettons, ou je sais pas quoi là, tu sais? (20C.028.98)
In little shorts, say, or whatever, you know?
(26)
a. Je vas voir la fille, je dis “You got two tickets [Ø]for Ottawa?” (20C.105.3294)
I go see the girl, I say, “you got two tickets for Ottawa?”
b. That guy won't stay in power at least for six or eight months [s]. (20C.080.587)
When calculations of marking rates are restricted to cases where [s] actually has a grammatical function, we find (Figure 8) that for both sets of lone other-language items, nonce and more frequent, integration into French reaches at least 98%.
Plural marks on plural nouns in three language-mixing categories.

Only in two cases, one a nonce form (10), the other a more frequent lone other-language item (27), did an overt [s] on a lone English-origin noun function as a plural marker, as do their counterparts in multiword code-switches. Based on the criterion of retention of donor-language grammar, these are code-switches (at the equivalence site between determiner and noun). By the same criterion, the remaining lone other-language items are not.
(27) Cinq-cents piasses par trois jours, avec tes tips [s]. (20C.086.320)
Five hundred bucks every three days, with your tips.
Determiner realization
Because, as previously noted, English admits many more null determiners than French does, the identity assumption would require that this disproportion be evident in nonce items and code-switches as well.
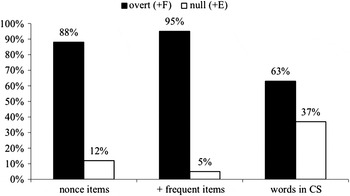
Figure 9 shows that nearly all of the more frequent lone other-language items do feature an overt determiner, as expected if they were being treated as French. The moderately lower rate of overt determiners on nonce nouns would appear to lend some support to the identity assumption, were it not for the fact that these all occurred in contexts where determiner absence is legal in French. The same is true of their more frequent counterparts, as illustrated in (28). Indeed, all 183 English-origin nominals with a null determiner occurred in one of these legal contexts!
(28)
a. C'est de se promener en Ø bikini en bicycle sur les rues. (20C.091.1228)
It's riding around on a bike in a bikini in the streets.
b. Il a mangé un coup de Ø bat dans le front. (20C.077.1332)
He got bashed in the forehead with a bat.
c. Moi, papa était Ø contracteur. (20C.082.926)
‘My dad was a contractor.
d. Moi je suis bien Ø chum avec lui. (20C.079.2165)
I'm very friendly with him.
Determiner usage on nouns in three language-mixing categories (n = 3676).

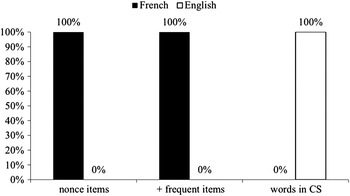
Once the structural facts are taken into account (Figure 10), it is plain that all lone other-language items, whether nonce or more frequent, are made to conform to the grammar of French, with no distinction between them, whereas nouns in multiword code-switches are treated as English.
Percentage of determiner usage consistent with patterns of French and English.

Adjective placement
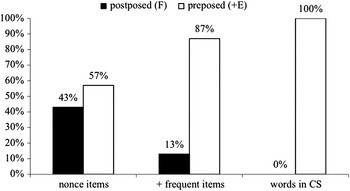
In English, adjectives precede their head, whereas in French, they canonically follow. As with null and overt determiners, however, the conflict is only partial, because the English order is also possible in French, albeit heavily restricted lexically. Under the identity assumption, nouns contained in multiword code-switches to English should contain only adjectives consistent with English word order (preposed), and the same should be true of English-origin nouns occurring as nonce items.
Comparison of adjective placement patterns in all three sets of English words (Figure 11) shows that nouns in multiword code-switches are in fact always preceded by their modifying adjectives, as illustrated in (29).
(29) Qu'est-ce qu'ils appellent un free-lance politician. (20C.082.1932)
What they call a free-lance politician.
Placement of adjectives with respect to nouns in three language-mixing categories (n = 300).

But over half the nonce forms, and perhaps more surprisingly, the large majority of the more frequent lone items (87%) are as well. Closer inspection reveals that here again, every one of the apparently anomalous tokens involves the small class of adjectives admitting (if not requiring) preposition in French. Adjectives belonging to the preposable class, illustrated in (30), are always preposed, whereas those belonging to the postposable class are always postposed (31).
(30)
a. Ah oui, les professeurs là, une vraie gang de fous là-dedans. (20C.085.161)
Oh yeah, the profs, a real bunch of crazies in there.
b. C'est juste s'assir en-avant de sa mautadite tivi toute la journée. (20C.100.753)
It's just sitting in front of the darn TV all day long.
(31)
a. Puis moi j'ai mon bar favori en bas de la côte. (20C.073.125)
And I have my favourite bar at the bottom of the hill.
b. C'est deux records anglais qu'elle a reçus là. (20C.186.814)
Those are two English [vinyl] records that she got.
On this diagnostic as well, speakers’ treatment of lone other-language items, whether nonce or more frequent, is always dictated by the grammar of French and always differs from that of English words contained within code-switches (Figure 12).
Percentage of adjective placement consistent with patterns of French and English.

Consistency in gender marking
The final conflict site to be analyzed synchronically involves grammatical gender. English supplies no indications as to gender, and English nouns contained in code-switches to English show none either. Thus, if the identity assumption were correct, consistent gender assignments would only be expected in the category of more frequent lone other-language items—if at all.
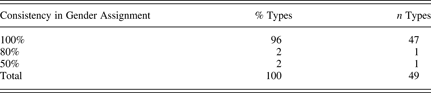
We could not test this assumption by comparing nonce tokens to more frequent lone other-language items, because nonce forms are by definition nonrecurrent, and consistency can only be assessed on the basis of two or more occurrences. Therefore, we compared gender assignments in more frequent lone other-language items to those of idiosyncratic lone other-language items, defined (Poplack, Sankoff, & Miller, Reference Poplack, Sankoff and Miller1988) as lone other-language items uttered at least twice, but only by a single speaker.
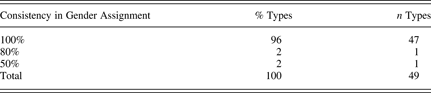
Table 7 charts consistency levels in the idiosyncratic lone other-language lexical types with overt indications of gender. Nearly all (96%) show 100% consistency. Another type (diamond drill) displays a lesser, but still extremely high consistency rate of 80% (32). The one apparently truly variable type has two mentions (33). In short, idiosyncratic lone other-language items, from the time of their second mention, are consistently assigned the same gender.
(32)
a. Il dit, “j'envoie la (f) diamond drill là”. (20C.082.392)
He says, “I'm sending the (f) diamond drill now.”
b. Demain la drill, la- la (f) diamond drill s'en vient. (20C.082.403)
Tomorrow the (f) drill—the (f) diamond drill is coming.
c. Mais il y avait la (f) diamond drill d'arrivée (20C.082.413)
But there was the (f) diamond drill that had come.
d. J'ai dit, “Écoutez mes vieux, prenez une (f) diamond drill, faites quelque chose!” (20C.082.2535)
I said, “listen, guys, take a (f) diamond drill, do something!”
e. Bien, c'est ça qu'on veut prouver avec le (m) diamond drill. (20C.082.319)
Well, that's what we're trying to prove with the (m) diamond drill.
(33) Il faisait rien à son (m) barbershop. Puis il avait une (f) belle (f) barbershop. (20C.095.944)
He didn't do a thing at his (m) barbershop. And he had a (f) nice (f) barbershop.
Consistency in gender assignment to idiosyncratic other-language items
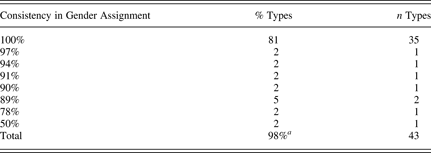
In comparison, their polar opposites, the 43 widespread (10+ speakers, 10+ tokens [Poplack, Sankoff, & Miller, Reference Poplack, Sankoff and Miller1988]) types, display a somewhat lesser, though still very high rate of gender consistency: 81% are categorically marked for the same gender (Table 8). All but two of the others have a consistency level of close to 90%. Only one widespread type (baseball) is truly variable—half of its 22 tokens are assigned feminine gender, and the other half masculine, with no discernible change in meaning.
Consistency in gender assignment to widespread other-language items
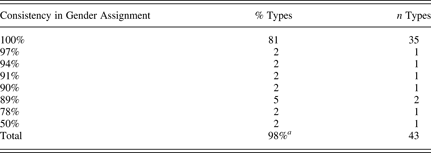
Note: a Due to rounding.
The fact that the more frequent lone other-language items display slightly less gender consistency does not impeach the level of consistency achieved by idiosyncratic nonce types. If anything, the result requiring explanation is the extraordinary amount of gender agreement altogether, given such a robust precedent for gender variability in unmixed French (21). The answer must reside in the nature of nonce or near-nonce formations. It is simply easier to achieve consistency (on anything) between two tokens than among 217 (shop), and within a single speaker (although cf. example (33)), as opposed to many.
Taken together, these results confirm that gender is all but fixed at the (near-) nonce stage. As the grammar of English (which gives rise to code-switches) provides no instruction in this regard, speakers can only be drawing on the grammar of French. On this measure once again, then, nonce borrowings are clearly distinguishable from code-switches.
Speaker propensity to produce multiword code-switches and nonce lone other-language items
The foregoing analyses suggest that whatever difficulties analysts may experience in teasing code-switches apart from (nonce) borrowings, these are manifestly not shared by bilingual speakers. This should allay any doubts as to the psychological reality of these two strategies. In this section, we show that the strategies are also differentiated socially. Which speakers code-switch and which ones nonce borrow? If single-word nonce borrowing (22a) can be equated with multiword code-switching (22c), those who make copious use of one should be equally likely to use the other. Figure 13 plots the relative propensity to code-switch (calculated for each speaker from raw numbers of multiword switches per recording) and nonce-borrow (based on the proportion nonce lone other-language items represent of their borrowed types).Footnote 8 It shows that the two strategies are clearly not correlated.
Speaker propensity to produce multiword code-switches and nonce lone other-language items. Propensity to CS: occasional = 0–3 (28 speakers, 25% of sample); moderate = 4–17 (58 speakers, 50% of sample); copious = 18–132 (30 speakers, 26% of sample). Propensity to nonce borrow: occasional = 0%–6% (34 speakers, 28% of sample), moderate = 7%–13% (56 speakers, 47% of sample), copious = 14%–39% (30 speakers, 25% of sample).

We do observe an increase in copious nonce use (the black bar) as we progress from occasional to copious switchers. But the same correlation obtains for occasional nonce users (the white bar), where the inverse would be expected. Thus copious code-switchers are as likely to be occasional as copious (nonce) borrowers, whereas occasional switchers are least likely to be occasional borrowers—or copious ones, for that matter. In other words, there is no difference between sparse and copious nonce borrowers in terms of their propensity to switch. Given that both strategies require active recourse to the other language (i.e., a certain degree of bilingual proficiency), this result is inexplicable under the assumption that code-switching is equivalent to (nonce) borrowing. On the contrary, these are alternative, not correlated strategies.
Evaluation of the identity assumption
This section considered the assumption that at any synchronic moment in time, single-word code-switches cannot be distinguished from nonce borrowings. Operationally defining nonce items as unattested lone other-language items uttered once by exactly one speaker, more frequent lone other-language items as those occurring twice or more, and code-switches as multiword fragments of the donor language, we examined how the same speakers treat other-language items in each of these categories. Our hypothesis: If the recipient-language grammar could be shown to be operating, the other-language item could be assumed to have been borrowed. If the donor-language was operating, then the other-language item was switched. To test it, we revisited the diagnostics we saw earlier to be straightforwardly associated with one or the other of the languages in contact. On none of them could the identity assumption be confirmed. Instead, in all areas but their overall frequency and distribution, lone other-language items, both nonce and more frequent, always differ from multiword code-switches: in their constitution, in speaker propensity to use them, and in their linguistic behavior, where discernible. With only two exceptions among the 7265 tokens examined in this section, this behavior is always dictated by recipient-language, not donor-language grammar.
DISCUSSION AND CONCLUSIONS
In this paper we have put to empirical test three widely accepted but understudied assumptions about bilingual mixing strategies. Making a fundamental distinction between the processes of actively drawing from one language during discourse in another (as in nonce borrowing and code-switching) and lexical retrieval of the product of language mixing (previously stored established loanwords), we set out to observe the former systematically in the data of production. We accomplished this by drawing on a unique corpus containing copious amounts of spontaneous bilingual speech collected from large numbers of bilingual speakers over a time frame of 61 years. These data and rigorous methods of exploiting them enabled us to track for the first time the diachronic development of nonce other-language items over time, while comparing the way speakers employ their mixing strategies synchronically.
All of this machinery revealed, first, that the overwhelming majority of other-language material consists of lone items, confirming reports to this effect on many other speech communities and language pairs. Dividing these into those that met the technical definition of nonce word and those that occurred more frequently, we found that almost all had already been established, to a greater or lesser degree, in the recipient-language lexicon. Because established loanwords can be accessed with little or no knowledge of the other language, they do not involve the process of mixing. Only a very small proportion turn out to be of the type that require active recourse to the other language. These are the nonce other-language items, the vast majority of which suffer the well-documented fate of their monolingual counterparts. They disappear after their first mention. Thus, even in a corpus as substantial as the one on which these analyses were based, very few materials even lend themselves to the study of the trajectory of loanword development. This dearth of appropriate data and the challenge of analyzing them systematically no doubt conspire in the widespread endorsement of the idea that nonce words typically increase in frequency and diffusion, which we labeled the diffusion assumption.
To be sure, given that most monolingual nonce forms never even achieve the status of neologisms (Hohenhaus, Reference Hohenhaus, Stekauer and Lieber2005, Reference Hohenhaus and Munat2007; Schmid, Reference Schmid2008), there is little reason to expect that all or even many foreign items would go on to become bona fide loanwords (especially for scholars who believe them to be code-switches). Still, what is surprising here is how very few of them persist at all, and the even smaller proportion of those that diffuse to so much as a moderate extent. This finding is particularly revealing in view of the recent proliferation of claims that other-language incorporations lead to convergent change, by introducing novel features that are then transferred to the recipient language (e.g., Backus, Reference Backus2005; Thomason, Reference Thomason2001; Toribio, Reference Toribio2004; Winford, Reference Winford2005).
Much as nonce incorporations have commonly been assumed to gradually spread from their original innovators to ever-larger portions of the speech community, so their linguistic integration has been characterized as increasing with subsequent mentions. Where the data permitted a test of this graduality assumption, the startling result was that it could not be supported. The advancing nonces whose behavior could be analyzed diachronically were integrated into recipient-language morphology and syntax, but not in tandem with increases in frequency and diffusion, as so many have assumed. Instead, integration occurs abruptly, at the first mention of the nonce item. Moreover, it is so highly structured as to include the detailed treatment of the inherent variability affecting the recipient language. Thus even other-language items appearing in superficially noncanonical forms or collocations (e.g., with preposed adjectives, null determiners or bare verbs) could be shown to have been integrated, by virtue of reproducing variable recipient-language patterns.
Why is the linguistic integration of nonce items abrupt (quasicategorical) when so much linguistic change is gradual? The answer may reside in the psychosocial reasons for using nonce items in the first place. We know that lexical need is a minor phenomenon at best (Poplack, Sankoff, & Miller, Reference Poplack, Sankoff and Miller1988). Conspicuousness and attention-seeking, two oft-cited motivations in the monolingual context, are more serious contenders. But these are at war with the pragmatic goal of ensuring that one's message is decodable to the listener. There is evidence to suggest that the chances are better, even if the word is unfamiliar, if it is formed on the basis of a familiar (morphological and/or syntactic) pattern (Schmid, Reference Schmid2008). Another plausible suggestion is that the type of concept activated by the nonce item automatically primes word-class-specific word-formation patterns, such that an other-language noun activates recipient-language determiner and adjective placement strategies, say. And the very strong tendency of adult speakers not only to abide by regular morphological rules, but to stick to the most productive of them (ibid.) is also mirrored in the integration of borrowed items (cf. the preference for 1st-conjugation verb morphology).Footnote 9 All of these possibilities are consistent with our contention that it is the recipient-language grammar that is operating at the moment the lone other-language item is accessed.
Just how much conspicuousness is tolerable or desirable? Foreign words are arguably far more salient than are native words used in novel ways, and even the latter are more salient when not coined according to established word-formation rules. Bilingual speakers may be seeking the best of both worlds by going after the communicative benefits conferred by lone other-language items, while minimizing their enormous salience (further magnified in the very public local discourse surrounding the ills of bilingualism and its linguistic products) by integrating them immediately into recipient-language grammar.
Whatever the correct explanation, the abrupt integration of lone other-language items suggests that when speakers go to access an other-language item, they make an instantaneous decision about how to treat it. They may opt to borrow it, in which case they assign it all the appropriate recipient-language grammatical structure, including its variable properties, which is really remarkable. The other alternative is to simply leave the other-language item as is, which implies incorporating it along with its associated grammatical properties, a process to which we have been referring as code-switching. The results of the research reported here, as well as much previous work, shows that this almost never happens with single words.
Why the avoidance of single-word code-switching? We cannot lay it at the doorstep of typological constraints, because the languages studied here are similar enough to admit a wide variety of legal code-switching sites. And speakers do avail themselves of them, if only occasionally, in constructing well-formed multiword switches (see (22c), for example). The social circumstances of the speech community, which has been in very long-term and intense contact with English, is certainly no impediment. Perhaps most perplexing, we have seen that incorporation of lone other-language items, even nonce lone other-language items, is a common occurrence. Yet despite their surface resemblance to single-word switching, and the fact that both require active access to the other language, the grammatical treatment speakers accord them, even the same speakers, is diametrically opposed. We can only speculate that speakers eschew code-switching single words, in the sense of switching both lexicons and grammars (as they do when engaging in multiword code-switching), because the cognitive and processing costs of doing so for a lone other-language item are appreciably greater than those incurred by simply allowing the already activated grammar to continue operating, handling native and etymologically foreign forms the same way.
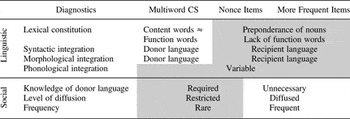
Now it may be objected, even by those who admit a distinction between borrowing and code-switching, that there is no real reason to expect lone other-language items to behave like words internal to multiword code-switches. Based on our own considerable research on the topic, we certainly had no expectation that they would. Admittedly, a better comparison would have been between lone other-language items and single-word code-switches. But applying objective measures to detect the latter, in lieu of theory-internal criteria, we found only two examples! The appeal to words contained in multiword code-switches is rather intended as a heuristic in response to claims that they are the same, or are located on the same continuum. If either of these were correct, the lone other-language items would have to display at least some commonalities with words contained in multiword code-switches. They do not, at least with respect to the five diagnostics examined here. Work carried out within the same accountable methodological framework confirms this finding, based on many other diagnostics and language pairs (e.g., Adalar & Tagliamonte, Reference Adalar and Tagliamonte1998; Eze, Reference Eze1997; Ghafar Samar & Meechan, Reference Ghafar Samar and Meechan1998; Torres Cacoullos & Aaron, Reference Torres Cacoullos and Aaron2003; Turpin, Reference Turpin1995).Footnote 10 As depicted in Table 9, nonce borrowings share nothing with single-word code-switches but their etymological origin. They share all their linguistic properties with established loanwords, which in turn mirror those of the language into which they are incorporated. The only exceptions involve their nonlinguistic (i.e., social) characteristics of recurrence and diffusion. It follows that nonce borrowings are not code-switches. They manifestly can (and must) be distinguished from code-switches.
Characteristics of language-mixing strategies

This brings us to a final assumption, one which we have not challenged here: the uniformity assumption. To what extent are the findings we have presented speech-community-specific, and which, if any, may qualify as universals of bilingual language-mixing behavior? A definitive answer must await many more empirical studies. We do know that the particular strategy of linguistic integration adopted, albeit dictated in the first instance by the structure of the recipient language, is ultimately conventionalized in the community. Thus, Igbo speakers alternate between integrating English tensed verbs inflectionally or via light verbs (Eze, Reference Eze1997); Louisiana francophones adapt untensed English verbs as bare roots (Dubois & Sankoff, Reference Dubois, Sankoff, Auger and Rose1997), whereas Quebec francophones choose inflections (Poplack, Sankoff, & Miller, Reference Poplack, Sankoff and Miller1988); Wolof speakers may postpose French adjectives to Wolof nouns or adjectival verbs (Meechan & Poplack, Reference Meechan and Poplack1995); job receives masculine gender in France but feminine in Canada; and so on. But though the shape the borrowed form assumes may be colored by community convention, we submit that the actual mechanism of loanword integration, the act of transforming other-language material into native material, is universal.
In sum, the vast majority of other-language material properly belongs to the category of borrowings. This is the insight behind the asymmetrical view of “code-switching”, whereby one language provides the grammatical morphemes, as proposed in the Matrix Language Frame model (Myers-Scotton, Reference Myers-Scotton1993a, passim), and other models that consider lone other-language items to be code-switches. To some extent, the debate over the status of lone other-language items may be viewed as terminological, but the findings of this study provide incontrovertible evidence that to sustain the claim that they are code-switches requires positing two kinds of code-switches, one for single words and one for longer fragments. The undeniable differences between lone other-language items and multiword code-switches, on the one hand, and the virtual lack of single-word code-switches, on the other, coupled with the overwhelming preponderance of lone other-language items in every bilingual dataset that has been quantitatively analyzed, together demonstrate that any model of language mixing with pretensions to constituting a “unified” theory of language contact phenomena is in fact a theory of lexical borrowing. Therefore, distinguishing code-switching and borrowing is not a “non-issue,” as asserted by Myers-Scotton (Reference Myers-Scotton1993b). It is perhaps the thorniest issue in the field of contact linguistics today. It will only be fully resolved by the cumulative results of many more accountable analyses of bilingual speech production.
In conclusion, cognizant of the controversy generated by the term nonce borrowing over the last several decades, we have been at pains to adopt a theory-neutral stance on the identification and status of other-language material, categorizing it in the first instance according to objective criteria such as uniqueness, frequency, and length. We do know that many of the more frequent lone other-language items are attested loanwords or widespread borrowings, however. The fact that the unattested nonce items behave just like them on all of the linguistic measures examined, coupled with the demonstration that speakers treat them consistently differently from multiword code-switches, leads to the inescapable conclusion that the unattested nonce lone other-language items too are borrowings, only without the extralinguistic characteristics of established loanwords: frequency, diffusion, and dictionary attestation. In other words, these are precisely the nonce borrowings first reintroduced into current discussions by Sankoff, Poplack, and Vanniarajan (Reference Sankoff, Poplack and Vanniarajan1990). The results of this study confirm once again the validity of this category as a class of borrowings. They also confirm the feasibility—and more important, the necessity!—of distinguishing them, not from other borrowings, as they are identical to them in linguistic structure, but from code-switches, single- and multiword. This necessity does not emerge from any theory-internal considerations, as alleged by, for example, Bentahila and Davies (Reference Bentahila, Davies and Jacobson1998), Clyne (Reference Clyne2003), Eliasson (Reference Eliasson1989), Gardner-Chloros and Edwards (Reference Gardner-Chloros and Edwards2004), Jacobson, (Reference Jacobson and Jacobson1998), Muysken (Reference Muysken2000), Nishimura (Reference Nishimura1995), and Santorini and Mahootian (Reference Santorini and Mahootian1995), but from the simple fact that these are different strategies, with different underlying structures, and generated by different grammars.