Introduction
Large-signal vector characterization has spread widely in microwave engineering; one of the most significant and established outcomes of this field is certainly the introduction of the X-parameters [Reference Root, Verspecht, Sharrit, Wood and Cognata1]. These are a mathematical formulation for a theoretically exact non-linear behavioral modeling, suitable for a direct and fast characterization of a device and systems [Reference Li, Hsu, Zhang and Huang2–Reference Wood and Collins4]. We contribute to this topic by introducing the use of X-parameters to characterize broadband high-power Doherty PAs (DPAs) [Reference Bathich and Boeck5,Reference Probst, Denicke and Geck6] and with the prospect of its design optimization. Broadband DPAs require the design of broadband DPA output combiners, capable of absorbing the large device output parasitic capacitances, and overall capable of implementing the correct load modulation between the main and drain devices, as well as the recombination of the devices drain currents into the summing node. These features depend on a number of design circumstances related to the quality of the design of such an output network. Nevertheless, they depend also on the accuracy of the model of the device and the performance of the input network, which should be capable of properly splitting the input power over the bandwidth of the output combiner. Depending on the implementation of the input network, the actual amplitude and phase of the two driving signals depends on the impedance of the input device, and hence on the non-linear state of the two devices. In addition, the best termination of the two main and peak devices, as well as their load modulation, depends on the mutual interaction between the two devices: thus an accurate characterization of the DPA devices as a whole is required. This motivates our investigation, which introduces the concept of the simultaneous modeling of the pair of main and peak devices. This characterization is possible by the technique of large-signal vector measurements [Reference Cidronali, Accillaro and Manes7] and the effective extraction of the three-port X-parameters [Reference Casini, Cidronali and Manes8]. The X-parameters permit the inclusion of the mutual interaction between the devices and the non-ideal effects introduced by the input amplitude and phase driving. These two effects determine the effective load modulation, and thus have an impact on the optimum design of the output combiner. The characterization of the X-parameters permits the description of a non-linear device, over a given carrier bandwidth and a number of harmonics. Although recently effective methods were introduced for the inclusion of long time scale dynamics effects [Reference Verspecht, Horn and Root9,Reference Roblin, Root, Verspecht, Ko and Teyssier10] in the present paper we limit our analysis to static non-linear behavior.
This paper extends the results of [Reference Cidronali and Collodi11], in which we demonstrated the feasibility of the approach. Here, we provide an insight into the characterization of the X-parameters of the DPA sub-circuit composed of a pair of PTVA042502FC Silicon LDMOS devices, along with the input DPA network; we provide also a discussion of the main factors affecting the CAD models of the arrangement of the pair of power devices in a conventional DPA. Lastly, we provide a comparison between measurements and simulations carried out by the three-port X-parameters characterization of the input sub-circuit of the DPA in the 700–960 MHz band.
Design principles of three-port main and peak devices test fixture
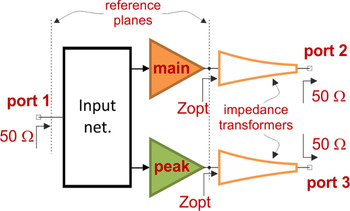
In this section we describe the basic design principles for both the input and output networks suitable for the characterization of broadband high-power Doherty amplifiers sub-circuits that are based on very large devices, like Silicon LDMOS. These networks were adopted for the development of the test fixture, shown schematically in Fig. 1, where the two power devices are embedded between the two networks whose descriptions are reported in the two following sections.
Schematic block diagram of the sub-circuit DPA test fixture.

Design principles of the broadband DPA input network
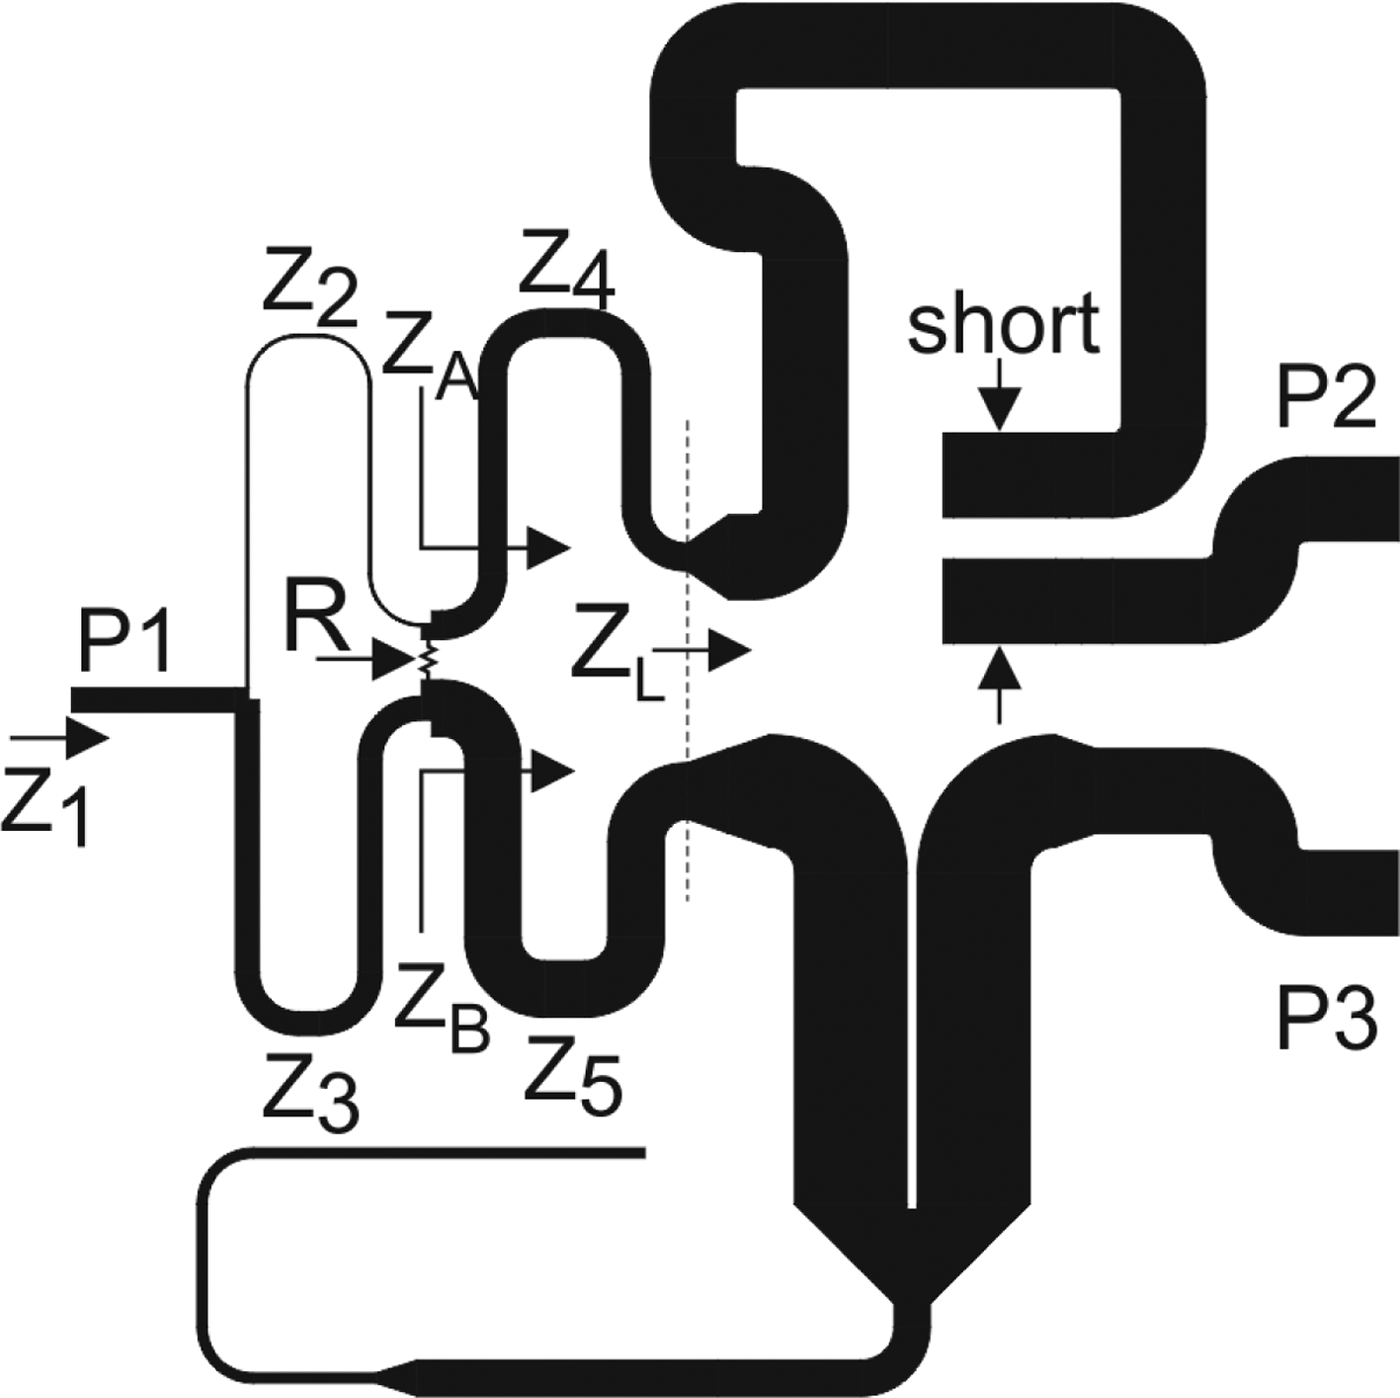
As outlined above, we consider two devices interconnected at their gate terminals to a passive input network, with the purpose of obtaining a three-port sub-circuit suitable for the subsequent development of the entire DPA. In accordance with the general requirements of broadband operation, the input network should have broadband capabilities in terms of both power splitting and impedance matching. For this purpose, we developed the microstrip technology network shown in Fig. 2, which is composed of the following parts: an uneven broadband two-stage unequal power divider, a reference line with electrical length of π (cascaded to the upper output port) and a broadband Schiffman phase shifter (cascaded to the lower output port) [Reference Lucarelli, Maddio, Collodi and Cidronali12–Reference Ahn14]. Given the output power splitter ratio k 2, and a real positive number A to be used as a degree of freedom, the output impedances to the first stage of the power splitter are Z A = k 2 · A and Z B = A. The impedance of the four branches composing the splitter are  $Z_2 =\sqrt {AZ_0k^2(1+k^2)}$,
 $Z_3 =\sqrt {AZ_0({1+k^2}/{k^2})}$,
 $Z_4 =k\sqrt {AZ_L}$, and
 $Z_5 =\sqrt {AZ_L}$. The resistance connecting the first stage of the splitter is R = A(1 + k 2) [Reference Ahn14]. The splitting ratio adopted in this design is
 $k=\sqrt {2}$, which corresponds to a − 2 and − 5 dB splitting between the two ports; with respect to schematic diagram in Fig. 2, the impedances resulting from the design optimization are Z A = 66.8, Z B = 33.4, Z 2 = 100, Z 3 = 50, Z 4 = 40.8, Z 5 = 28.9, while R = 100OhmΩ. The transmission lines with impedance characteristics Z 2, Z 3, Z 4, and Z 5 are impedance transformers, thus their electrical length is π/4.
Two-stage uneven splitter and broadband 90 degree phase delay.

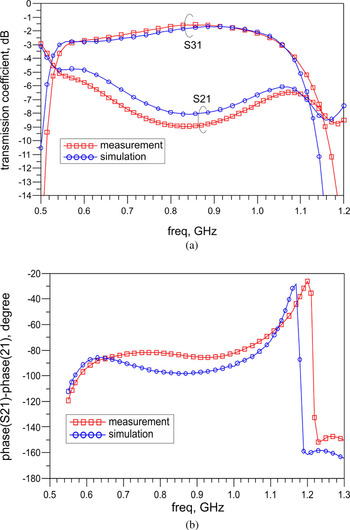
The asymmetric splitter is cascaded with a broadband 90-degree Shiffman phase shifter using a stepped impedance open stub and a coupled-line with a weak coupling to relax the constraints on the implementation. The phase shifter is implemented with the characteristic impedance of 25OhmΩ, by using the design principles described in [Reference Liu, Liu, Shen, Li, Yu and Lu15]. The 90-degree power splitter described above has been designed and optimized in the frequency band of 600 MHz to 1 GHz, with an expected power transmission of − 1.2 and − 6 dB respectively at ports 3 and 2. The network at its input port shows an impedance of 50OhmΩ, while at both the output ports the impedance is 25OhmΩ. The inclusion of the reference line is optimized to track the phase shift of the output impedance inverter over the frequency band. The results of the prototype characterization, fabricated on a 10 mil plastic substrate εr = 3.5, are reported in Fig. 3, for both the simulated and measured phase difference between output port, Fig. 3(b), and the magnitude of the transmission coefficient at the two ports, Fig. 3(a). The comparison reveals a good accuracy of the simulation across the entire range of analysis, from 500 MHz to 1.2 GHz, while the useful range for its use in a DPA architecture could be considered in principle about 850 MHz with a total bandwidth of 300 MHz.
Uneven quadrature power splitter characterization, cf Fig. 2. (a) Amplitude of the transmission coefficients. (b) Phase between transmission coefficients.

The input network is completed cascading the above described splitter, with a lumped element π-type matching network for each branch, which transform the 25 OhmΩ output impedance to respectively the main and peak devices input impedance.
Design principles of the output network
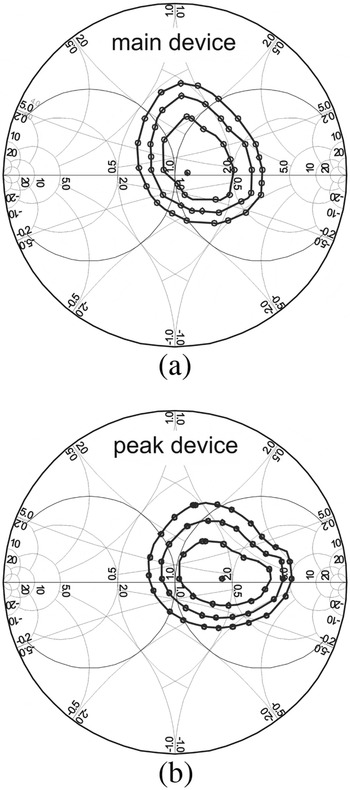
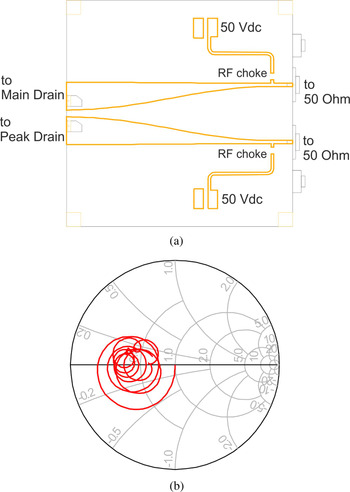
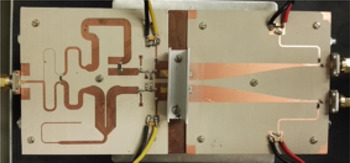
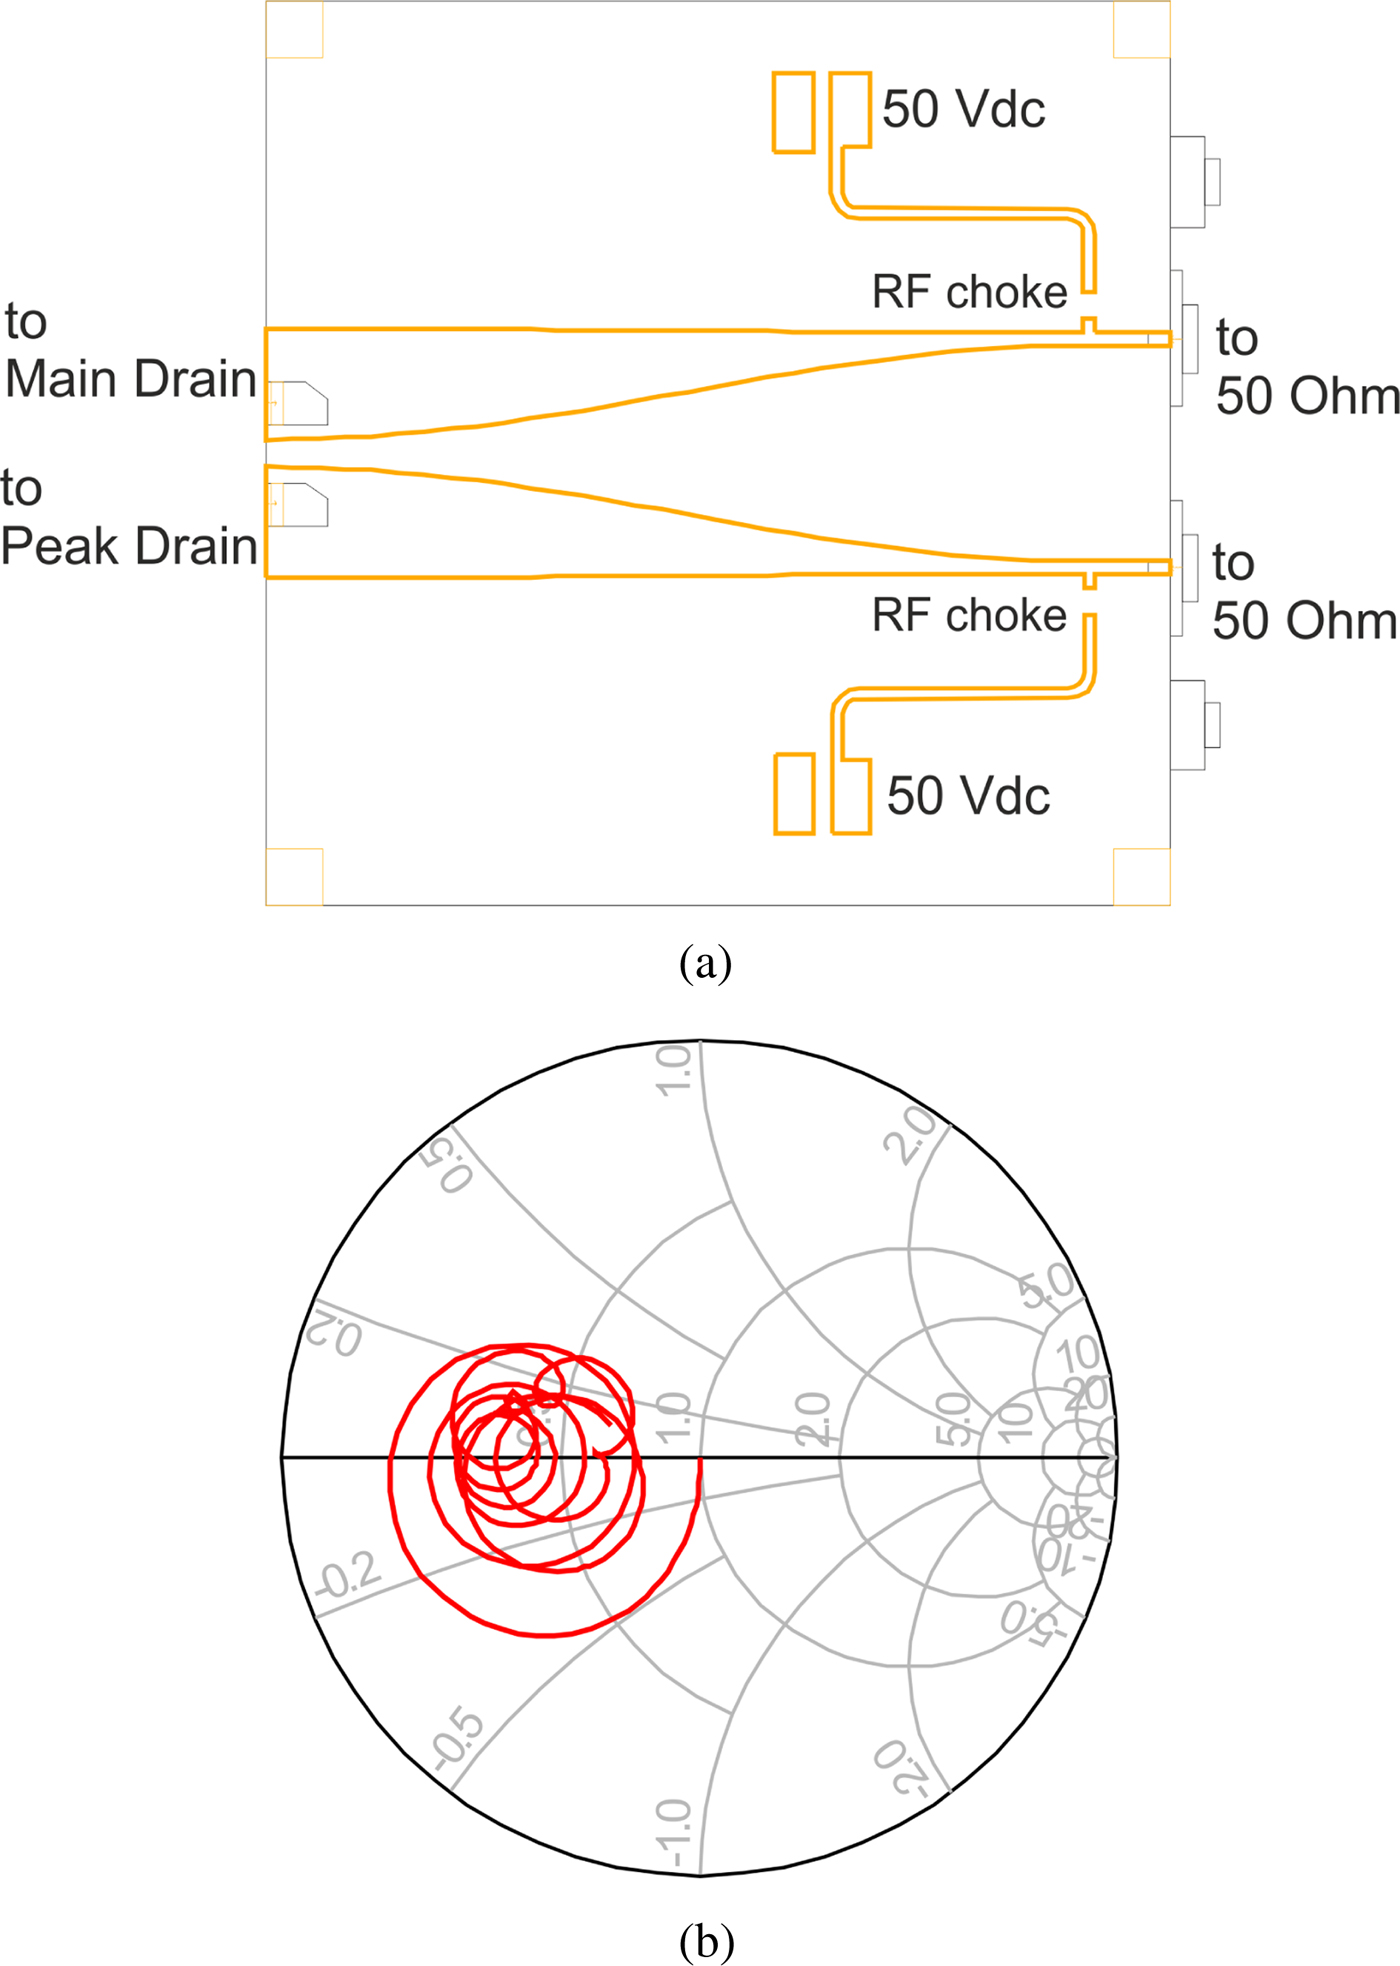
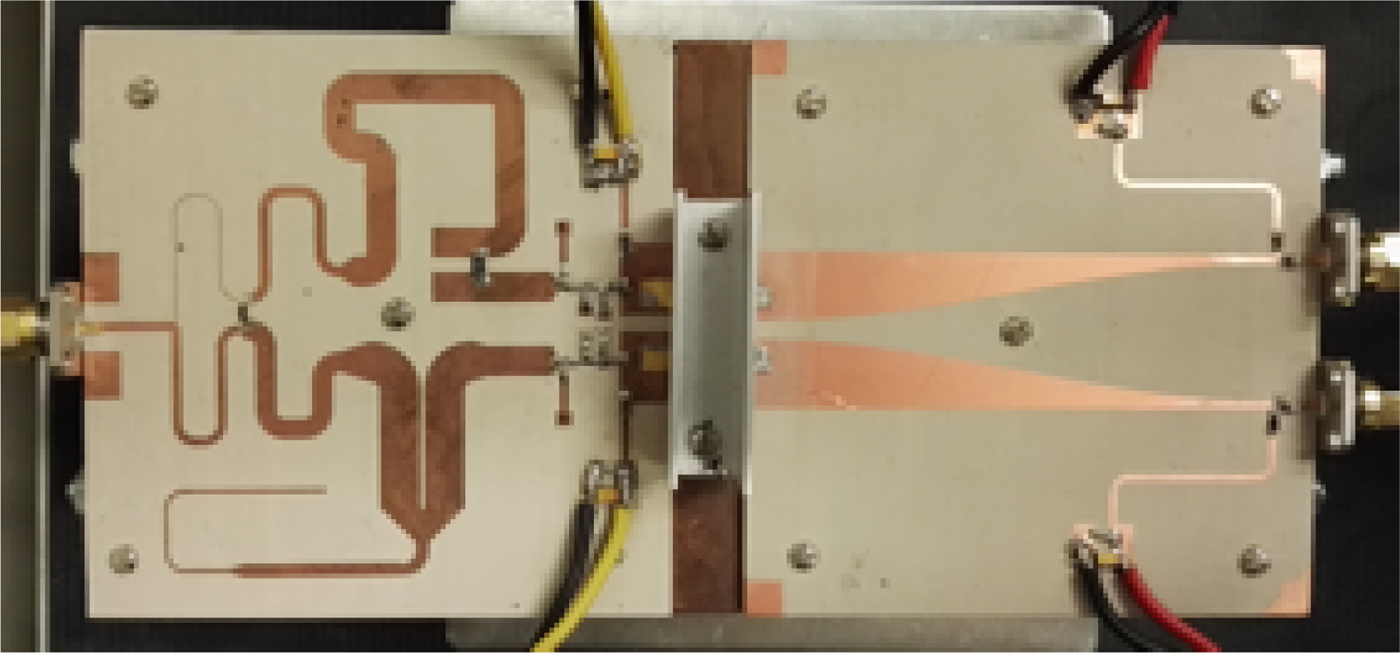
The key point of this paper is the large-signal vector characterization of the main and peak devices of the DPA as a three-port device, by the test fixture of Fig. 1. As far as the drain terminations are of concern, the test fixture should terminate the two devices at their optimum device impedance. There are two main reasons why this is required. The first is related to the design purpose, that requires the power devices to be terminated with the optimum impedance value to maximize the power delivered to the load, possibly by implementing a trade off between efficiency and linearity constraints. Secondly, the accuracy of the model to be extracted from the measurements depends on the non-linear state of the device, and hence its terminations used during the characterization stage. Thus, a non-linear characterization should be carried out by embedding the device with terminations very similar to those that will be used in operation: this guarantees the proper use of the model and minimizes the need for extrapolation. For this purpose, a preliminary phase of load–pull simulations were carried out in order to identify the best load terminations for both the main and peak devices. The results are reported in Fig. 4(a) and 4(b), for the main and peak devices respectively, at a carrier frequency of 750 MHz. At this stage, the bias point of Vd = 50 V is supplied to both the devices, with the main device biased at 800 mA, and the peak at its threshold. The data shown in Fig. 4 assume a de-embedding of a parasitic capacitor of about 24 pF for both devices, while the optimum terminations are about 5.5 and 7.8 OhmΩ for the main and peak devices respectively. The next step of the design of the test fixture consists of the design of an output network capable of transforming the 50 OhmΩ load to the optimum impedance, over the specified bandwidth. In this work, we adopted a tapered transmission line capable of providing the impedance transformation across the specified bandwidth of 700–960 MHz. A limitation of this approach consists in the maximum width of the taper, which is dictated by the device drain terminal spacing. In this case, a reduction of the width can be implemented by using artificial line synthesis [Reference Cidronali, Giovannelli, Maddio, Del Chiaro, Schuberth, Magesacher and Singerl16]. By considering that during the operation of the DPA, the load modulation changes the impedance seen by both the peak and the main devices, we used 10 OhmΩ as a trade off between the feasibility of the taper and the actual value for the terminations. In Fig. 5(a) we show the output network of the test fixture, which is composed of two tapered transmission lines, shaped by the Klopfenstein rule [Reference Klopfenstein17], and arranged in a pair consistent with mechanical constraints. The numerical electromagnetic simulated response is reported in Fig. 5(b) in terms of the reflection coefficient at the drain termination port between 0 and 10 GHz. The broadband behavior is required to maintain the approximation of the value of the termination over the design bandwidth and at the harmonics. A picture of the final assembly of the test fixture for the large-signal vector characterization is presented in Fig. 6. In the picture are visible also the input networks between the broadband splitter and the devices gate, as well as the gate bias networks. The assembly uses a thermal sink, which turns out to be particularly important for maintaining the temperature of the device below a critical level.
Main and peak device load pull analysis at 750 MHz, Z 0 = 5OhmΩ. (a) Main device. (b) Peak device.

Output network of DPA test fixture. (a) Layout of the test fixture. (b)Reflection coefficients at the termination port between 0 and 10 GHz, Z 0 = 25OhmΩ.
Picture of the test fixture prototype assembled for large-signal vectorial characterization.
Large-signal vector characterization of the DPA sub-circuit
The sub-circuit composed of the input network described in section “Design principles of the broadband DPA input network” was connected to a pair of PTVA042502FC Si-LDMOSs included in the same package; this section of the test fixture constitutes the sub-circuit to be characterized. The test fixture is then completed by the output networks described in section “Design principles of the output network”, along with all the required bias networks. In this section we discuss the measurement set up and the characterization results of the test fixture shown in Fig. 6.
Non-linear-VNA setup
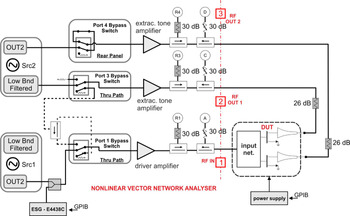
The purpose of the test fixture is to provide a connection between the calibrated ports of the three-port large-signal vector measurement setup [Reference Cidronali, Giovannelli, Maddio, Del Chiaro, Schuberth, Magesacher and Singerl16] and the DPA sub-circuit. The measurement setup is based on a three ports nonlinear-VNA (NVNA), where two sources are actuated at operating frequencies and levels capable of stimulating the RF device pair with a large signal from the input network, and simultaneously injecting tick signals [Reference Cidronali, Gupta, Jargon, Remley, DeGroot and Manes18] for the extraction of the X-parameters. The schematic block diagram of the characterization setup is shown in Fig. 7, where an external generator is aimed at providing the large-signal stimulus for the characterization.
Schematic block diagram of the non-linear-VNA-based characterization setup.
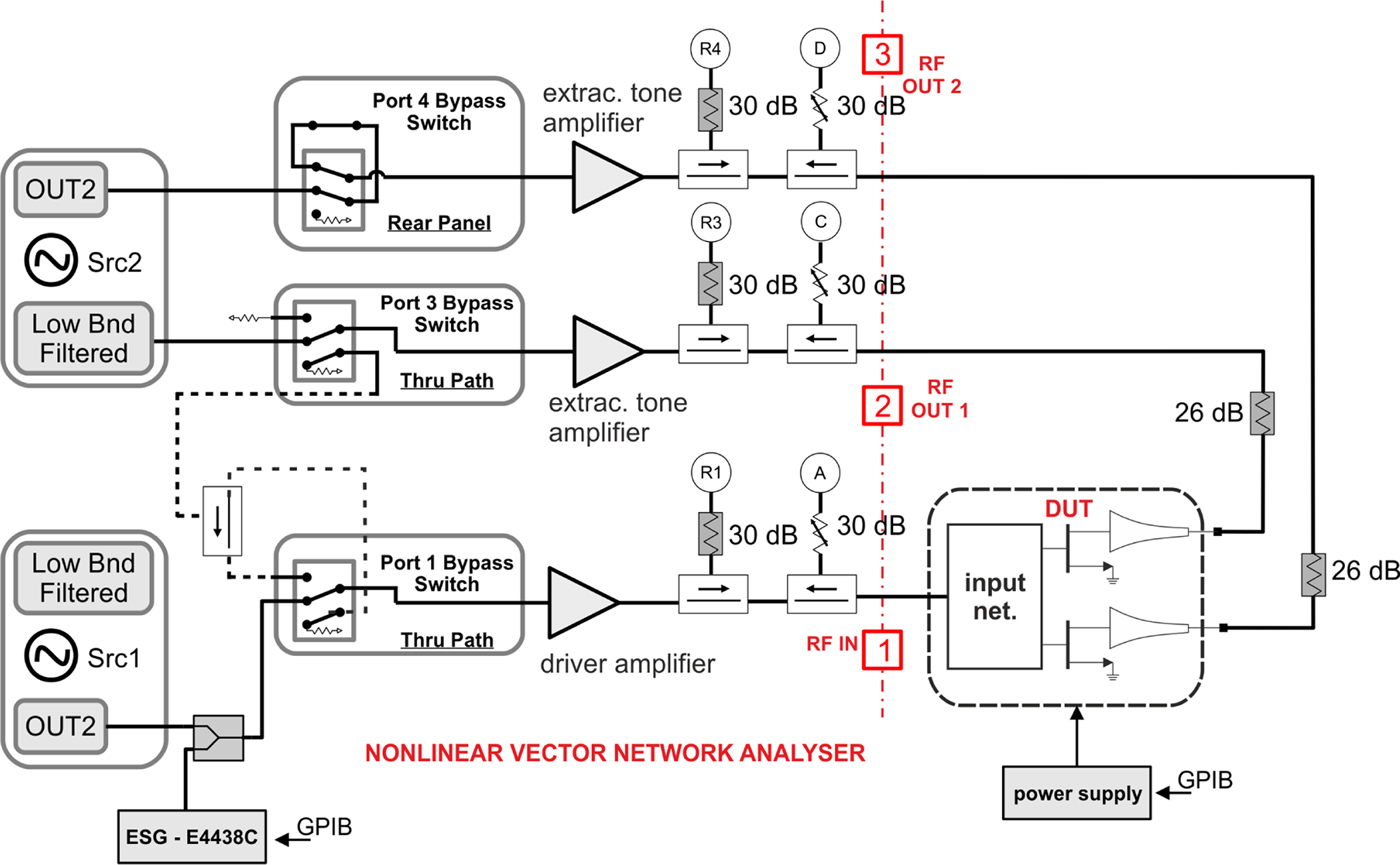
A driver amplifier is included in the path to the input port of the DPA sub-circuit, and it is capable of driving the device under test (DUT) up to 40 dBm over the design bandwidth. Two additional amplifiers are also included at the output ports with the aim of amplifying the extraction tone applied to ports 2 and 3 of the DUT, for the purpose of the X-parameters extraction. According to a general rule, the extraction tone should be on the order of − 20 to − 30 dBc in magnitude with respect to the carrier and the harmonics at the output of the DUT. Thus the driver amplifiers involved need a sufficient gain and dynamics. A pair of high-power attenuators complete the setup and ensure the proper signal levels.
In this setup, the main limitation is imposed by the extraction tone amplifiers, which should provide a sufficient tick signal level over a bandwidth defined at its lowest end by the lowest frequency of a 11, and at its highest by the highest a 11 harmonics, considered in the characterization. For instance, with reference to Fig. 8, for an output power of 50 dBm, at least 20 dB of attenuation is needed at ports 2 and 3: this makes the tick signal tone generated at ports 2 and 3, about 50 dBm − 30 dBc + 20 dB = 40 dBm at the fundamental frequency and capable of providing comparable levels also at the harmonics. In addition, the driver amplifier must drive the DUT and provide the extraction tone with levels which are − 20 to − 30 dBc lower than the fundamental tone across the measurement bandwidth.
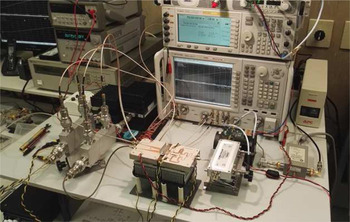
Picture of the non-linear-VNA setup arrangement for the test fixture prototype characterization.
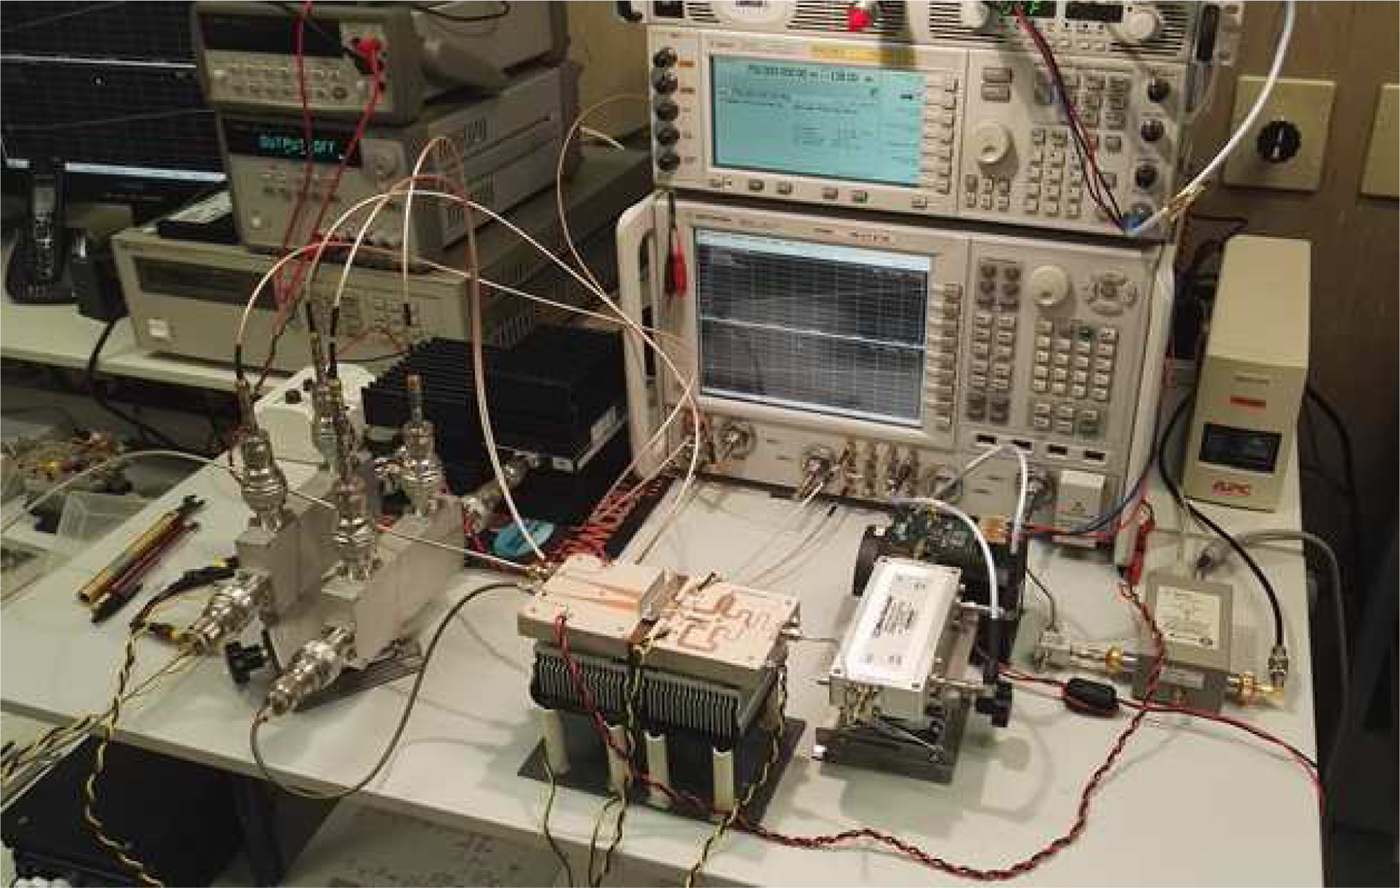
This arrangement actually makes the NVNA suitable for the extraction of three-port X-parameters, with the independent incident wave applied at port 1, namely a 11, where the second index indicates the fundamental of the excitation. In the setup, ports 2 and 3 are those connected to the output of the main, respectively, peak device.
A picture of the laboratory setup of the three-port non-linear-VNA is shown in Fig. 8. There can be recognized a four-port vector network analyzer properly modified with external high-power bidirectional couplers connected to the DUT and to the internal receivers of the analyzer. The output port of each coupler defines the calibrated section of the measurement setup. In addition, the picture shows the high-power attenuators, while the extraction tone amplifiers are behind them and not visible in the picture. The phase reference of the system is connected at port 2 of the test-set, and it is adopted for both the calibration phase as well as run-time during the measurement test. In accordance with the use of high-power devices, the characterization is actuated by pulsed measurements with 10% duty cycle.
Three-port X-parameters model of the DPA subcircuit
The model adopted in this study is based on the definition of the non-linear scattering functions, F ik, that relate the input spectral components a jl with the output spectral components b ik [Reference Peyton Jones and Billings19]
 $$ b_{ik}=F_{ik} (a_{11}, a_{12}, \ldots, a_{11}, \ldots ), $$
where i,j are respectively the ith and jth input and output ports and k,l the corresponding harmonic indexes. Introducing the term P = a 11/|a 11|, which corresponds to the phase of a 11, and assuming a single-tone excitation at port 1, we can linearize (1) about |a 11| with respect to a jl · P −l; this permits of introducing the parameters
 $$ \eqalign{ XB_{ik} ( \vert a_{11} \vert ) &= F_{ik} ( \vert a_{11} \vert , 0, 0, \ldots), \cr XS_{ik,jl} ( \vert a_{1,1} \vert ) &= \left. {{\delta F_{ik}} \over {\delta (a_{\,jl}\cdot P^{-l})}} \right\vert _{ \vert a_{11}\vert }, \cr XT_{ik,jl} ( \vert a_{1,1} \vert ) &= \left. {{\delta F_{ik}} \over {\delta (a_{\,jl}\cdot P^{-l})^\ast}} \right\vert _{\vert a_{11}\vert }, } $$
and in turn applying the harmonic superposition principle [Reference Root, Verspecht, Sharrit, Wood and Cognata1] which leads to
 $$ b_{ik}=XB_{ik}+ \sum_{i,j \neq 1,1} {XS_{ik,jl} P^{k-l}a_{\,jl}}+ XT_{ik,jl} P^{k+l}a^\ast_{\,jl} $$
where i;j=1,2,3 and k;l = 1, …, max{harmonic}; a 11 is the incident wave at the input port, while b ik is the scattered wave at the i-th port and k-th harmonic.
From (2) we recognize that the term XB ik corresponds to a non-linear mapping of a 11 to b ik, while from (2) and (3), that XS ik,jl and XT ik,jl correspond to the terms of a non-analytic harmonic superposition, by which is included the dependence of the b ik phase upon the a jl phase. In particular, the terms XT ik,jl take into account the fact that F ik can not be analyticFootnote 1.
Moving on the measurement setup discussed in section “Design principles of the broadband DPA input network”, the acquired raw data were properly de-embedded [Reference Lee, Lin, Lin and Lee20] from the magnitude and delay inserted by the output tapered transmission line: this procedure permits extracting the incident and reflected waves at the drain terminals of the two devices, starting from those measured at ports 2 and 3 of the test fixture. Based on these data, the characterization permits achieving a three-port behavioral model suitable for the large-signal analysis of the DPA, as well as its optimization.
The experiments discussed herein below are limited to 3 harmonics; this means that the non-linear mapping parameters XB ik are in total 9 (that is 3 port times 3 harmonics); according with the number of DUT ports, that is 3, and the number of higher order of harmonics, that is 3, the XS ij,kl and XT ij,kl parameters are respectively 34 = 81. Thus in total we have 9+81+81=171 X-parameters, which are complex numbers, function of |a 11|, and frequency.
In the following, we will discuss the behavior of the DPA sub-circuit on the basis of the main X-parameters as derived by the characterization technique described in the previous section.
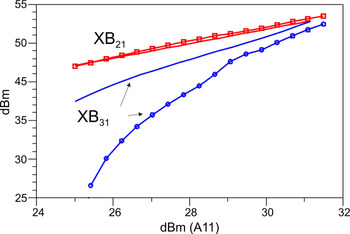
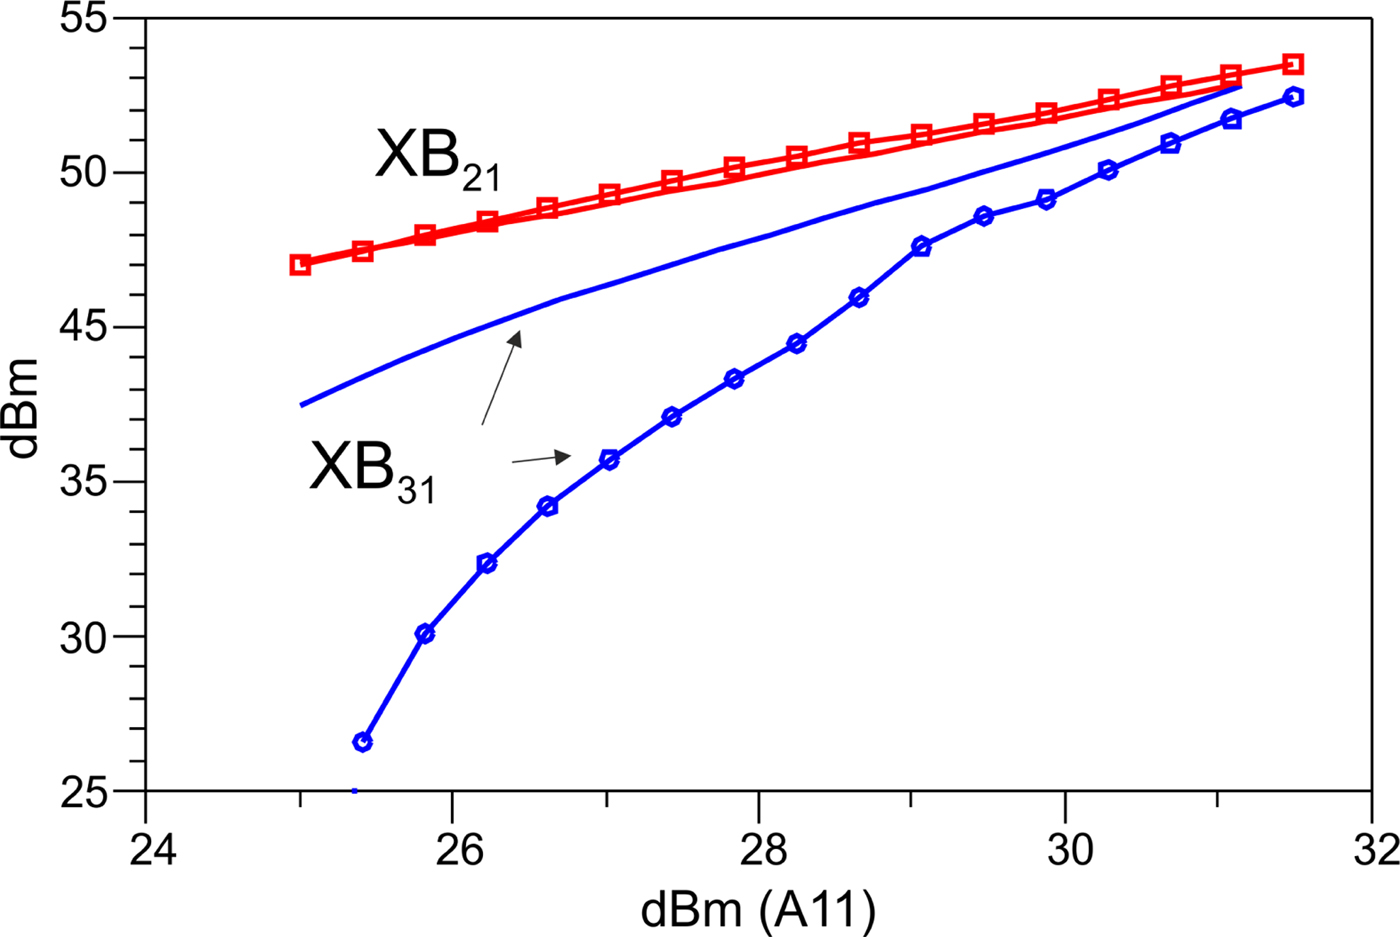
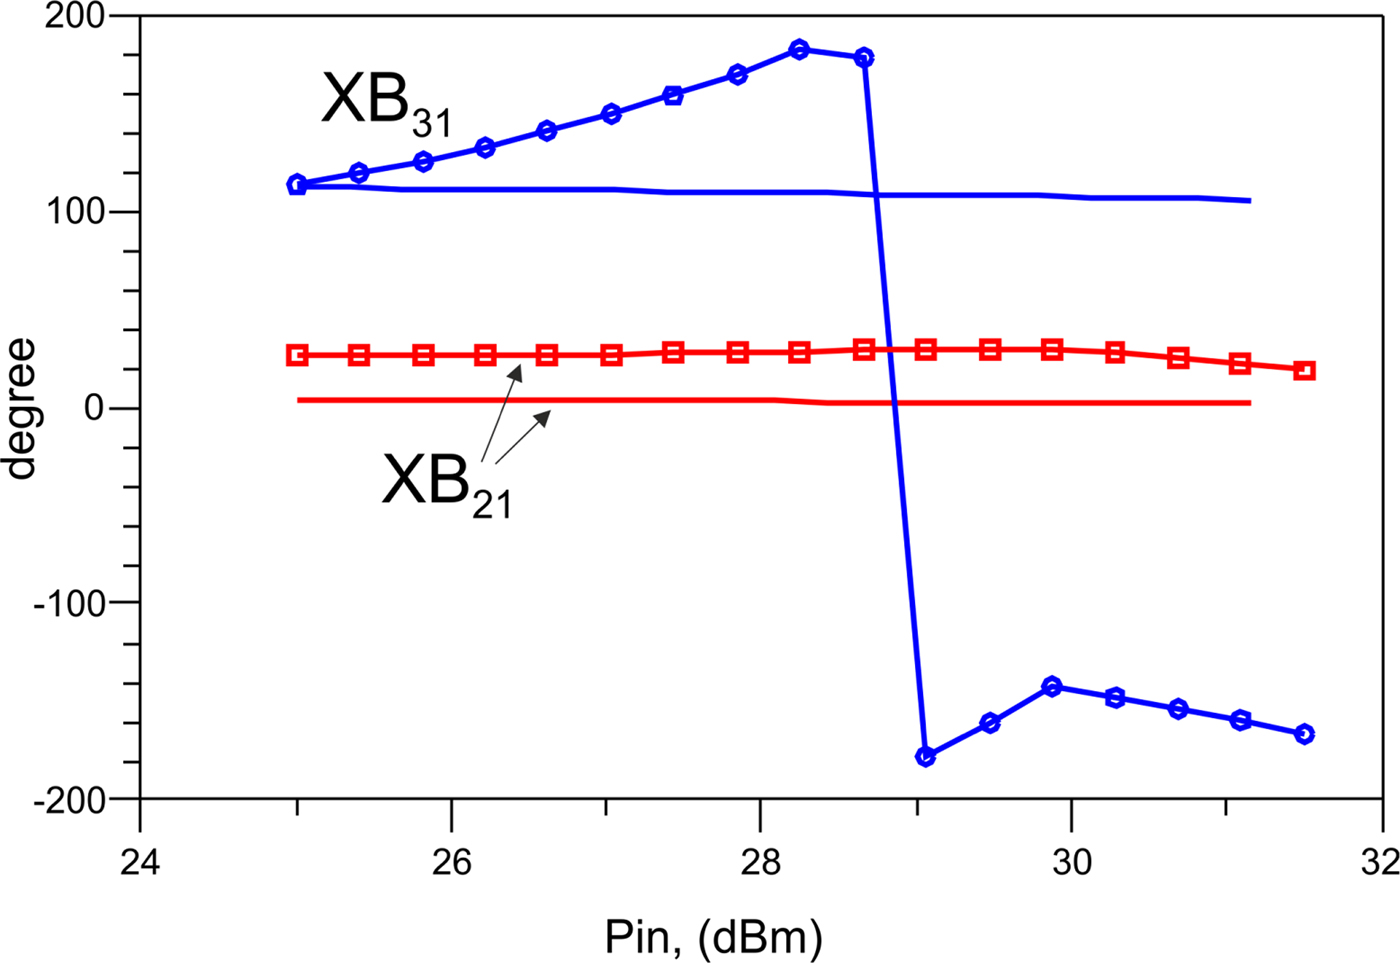
The first set of parameters under consideration consists on the non-linear mapping parameters XB 21 and XB 31, which relate the fundamental of the incident wave at port 1 to the fundamental of the scattered waves at the output ports of the sub-circuit, namely the main, port 2, and the peak, port 3, devices respectively. Their behavior at the carrier frequency of 850 MHz is shown in Fig. 9 as a function of |a jl|. In the figure we compare the X-parameters extracted by the large-signal characterization of the sub-circuit and the corresponding X-parameters extracted by CAD simulations using the vendor's model. We see that for XB 21, which corresponds to the main device operating in AB class, we obtain a significant coherence between the two models; while the measured XB 31 differs significantly from the corresponding parameter obtained from simulated data. This can be attributed to the better accuracy of the CAD model in the class-AB region rather than in the class-C region. A similar comparison of the phase terms of XB 21 and XB 31 is shown in Fig. 10, where the phase response of the CAD model is approximately constant over the entire range of amplitude of the stimulus, while the corresponding parameters extracted from measurements exhibit a non-constant behavior, in particular XB 31, which corresponds to the peak device. It is worth noting that only for the lowest amplitude is the phase difference between the non-linear response consistent with the 90 degree delay induced by the input network. For higher powers, the phase difference for the CAD model remains approximately constant, while the X-parameters extracted by the measurement deviate from this expected response.
Comparison between measured (symbols) and simulated (continuous) XB 21 and XB 31 magnitudes at 850 MHz.
Comparison between measured (symbols) and simulated (continuous) XB 21 and XB 31 phases at 850 MHz.
The discrepancy between the modeled and measured X-parameters is to be mainly attributed to the fact that the power devices are contained in the same package very close to each other, whereas the CAD model is provided as a pair of identical device models, with an elementary description of the mutual interaction between the two intrinsic devices. This latter, associated to the inherently low accuracy of class-C operating mode, makes the CAD model incapable of capturing the higher order of interaction between devices, as described in particular below.
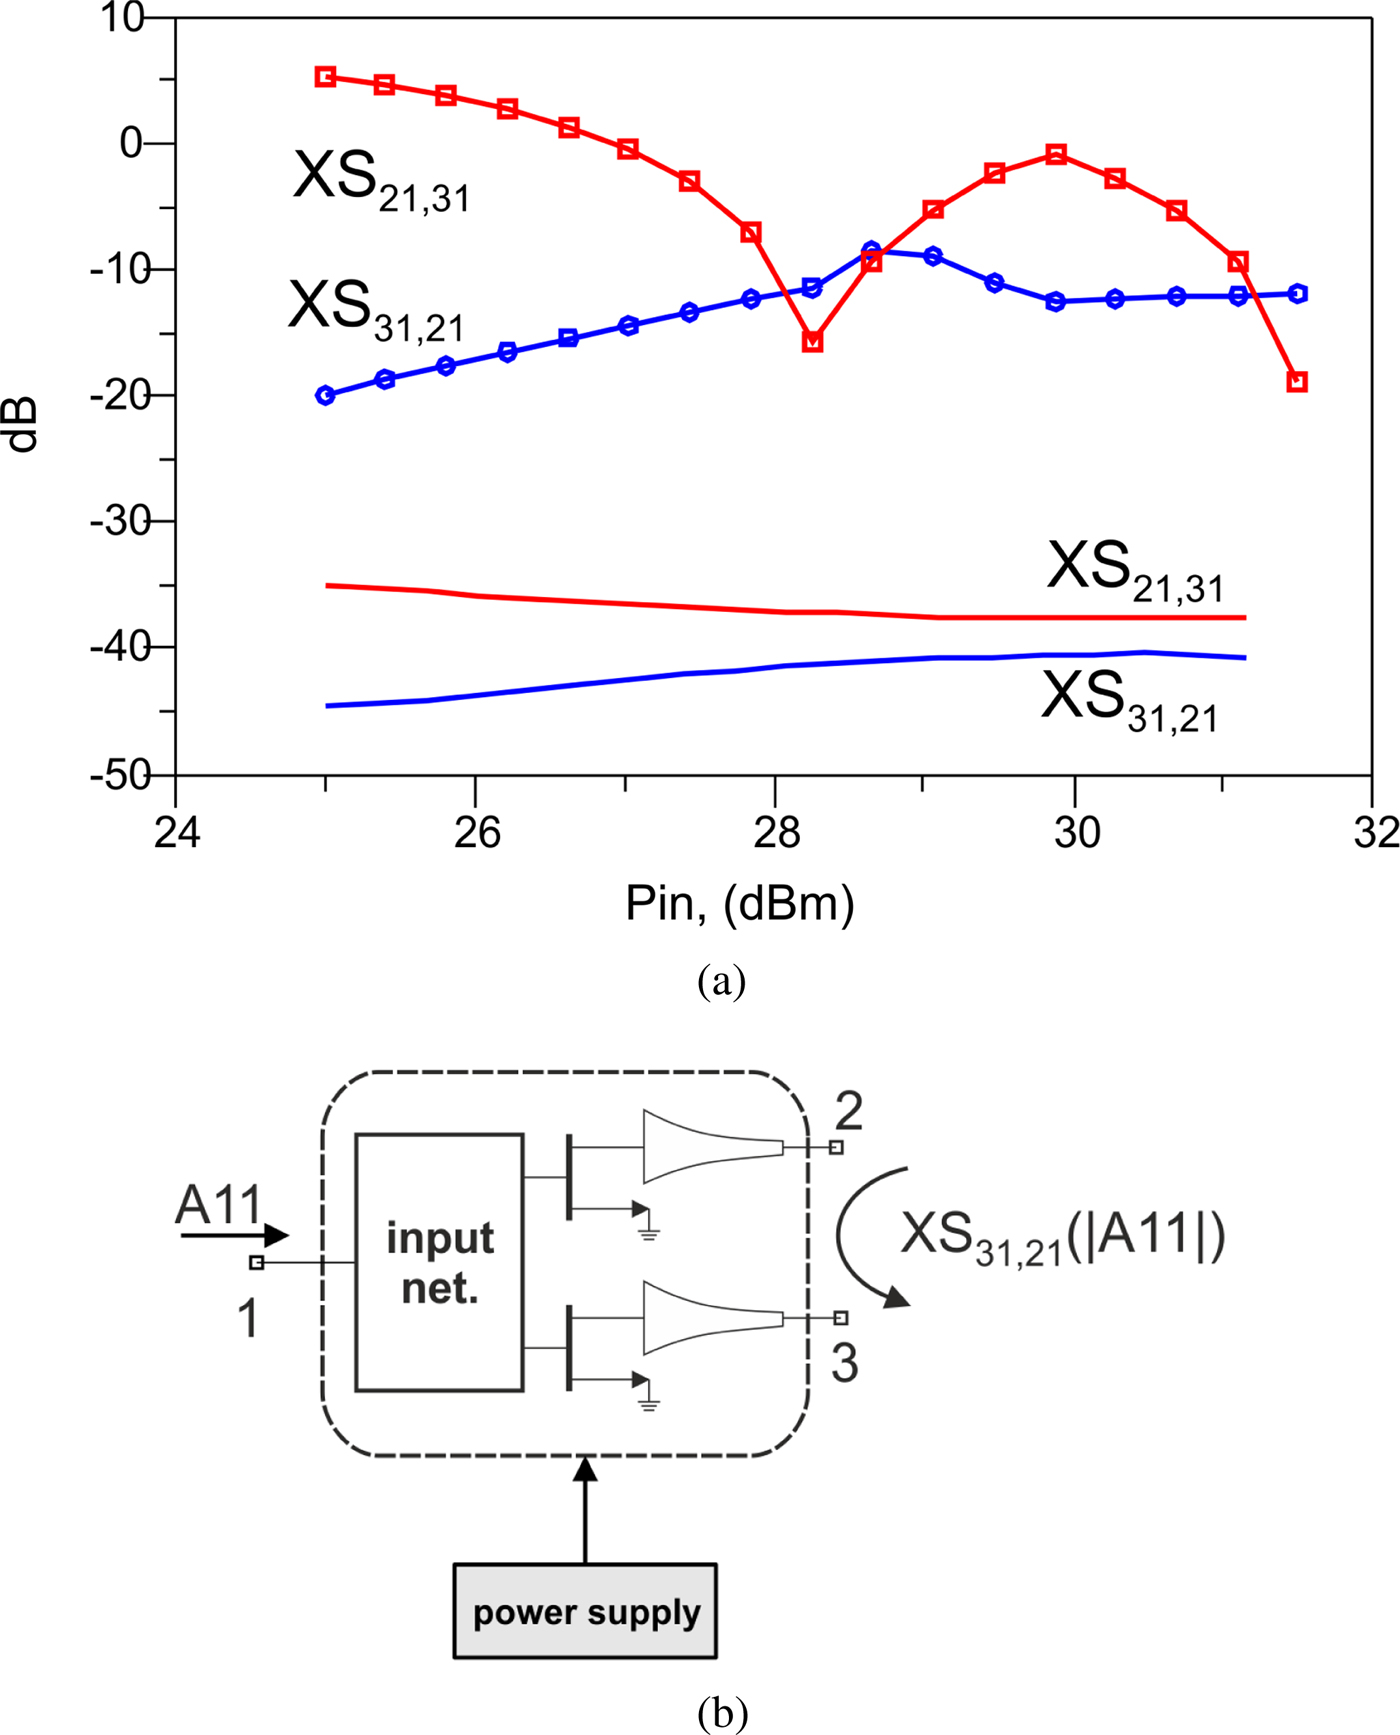
An insight into the interaction between the devices in the DPA sub-circuit is provided by the parameters XS 3121 and XS 2131, shown in Fig. 11(a), which relate the linearized response at the fundamental frequency between the peak and the main devices, and vice-versa, for XS 3121, respectively, XS 2131; Fig. 11(b) shows schematically the setup concerning the parameter characterization. The graph in Fig. 11(a) shows quantitatively that the behavior of the X-parameters extracted from CAD simulations differs greatly from that from the large-signal characterization, in particular, those measured are significantly higher than those obtained from the CAD model. Also in this case the behaviors reflect an incorrect characterization of the interaction between the devices, that can be attributed to both an incorrect modeling of the intrinsic device interaction within the package, as well as the path that arises through the input network that connects the gates of the two devices.
X-parameters related to the output devices cross talks. (a) Comparison of simulated (continuos) and measured (symbols) XS 31,21 and XS 21,31 parameters at 850 MHz. (b) Schematic setup for the definition of XS 31,21; similarly for XS 21,31.
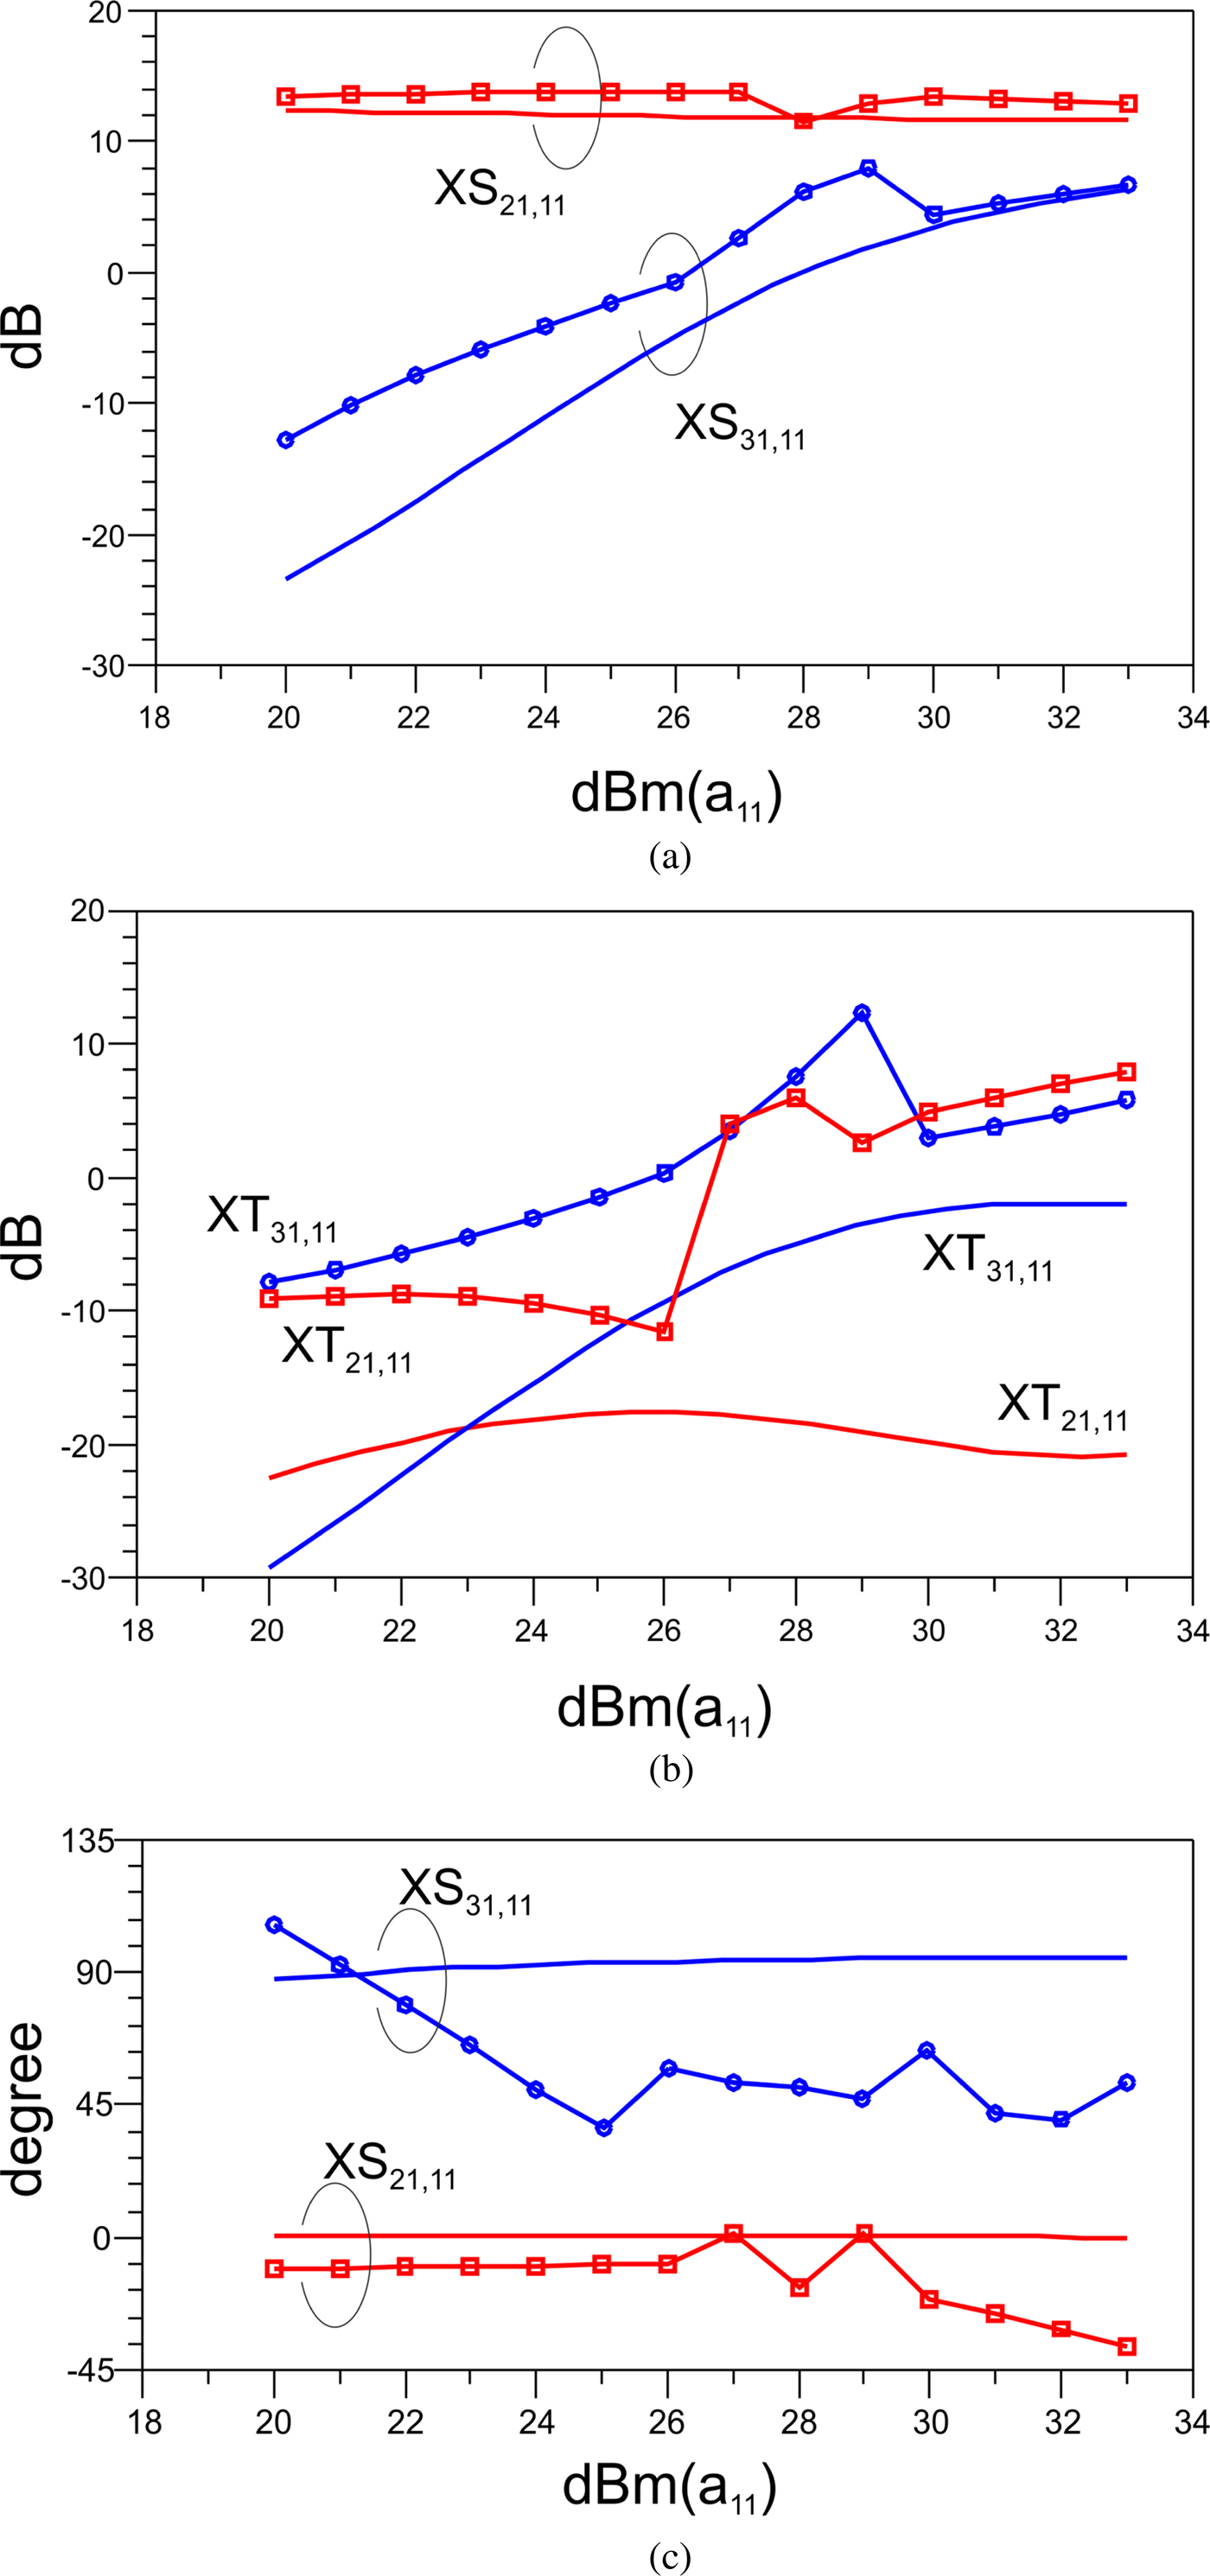
To complete the overview of the X-parameters, Fig. 12 presents a comparison of some XS and XT parameters obtained from the measurements and from the circuit model. Recall that XS ik,jl and XT ik,jl consist respectively on the linearization of the non-linear mapping associated to the non-linear scattering function, about |a 11|, with respect to a jl · P −l and  $(a_{jl}\cdot P^{-l})^\ast$; this helps with the considerations that follow. From Fig. 12(a) we observe a behavior that resembles those already shown for the non-linear mapping of Fig. 9. In particular we can clearly observe that the parameters exhibit a behavior qualitatively similar to the derivative of the corresponding non-linear mapping functions. Fig. 12(b) reports a comparison of the measured and modeled XT 31,11 and XT 21,11, which are the terms that include the non-analyticity of the describing function F ik. From the comparison it is evident that the model suffers from low accuracy with respect to this feature of the behavior of the device. Consequently, a comparison in terms of phase is reported only for the terms XS 31,11 and XS 21,11, and is provided in Fig. 12(c) over the entire range of power levels at the frequency of 850 MHz. From the curve we can observe that the peak device exhibits a power-dependent phase response, much more evident than that exhibited by the main device; this behavior is not reproduced by the X-parameters extracted from the model simulations.
Comparison of XS and XT parameters at 850 MHz; simulation: continuous curves, symbols: experiments. (a) Magnitude of XS 31,11 and XS 21,11. (b)Magnitude of XT 31,11 and XT 21,11. (c) Phase of XS 31,11 and XS 21,11.
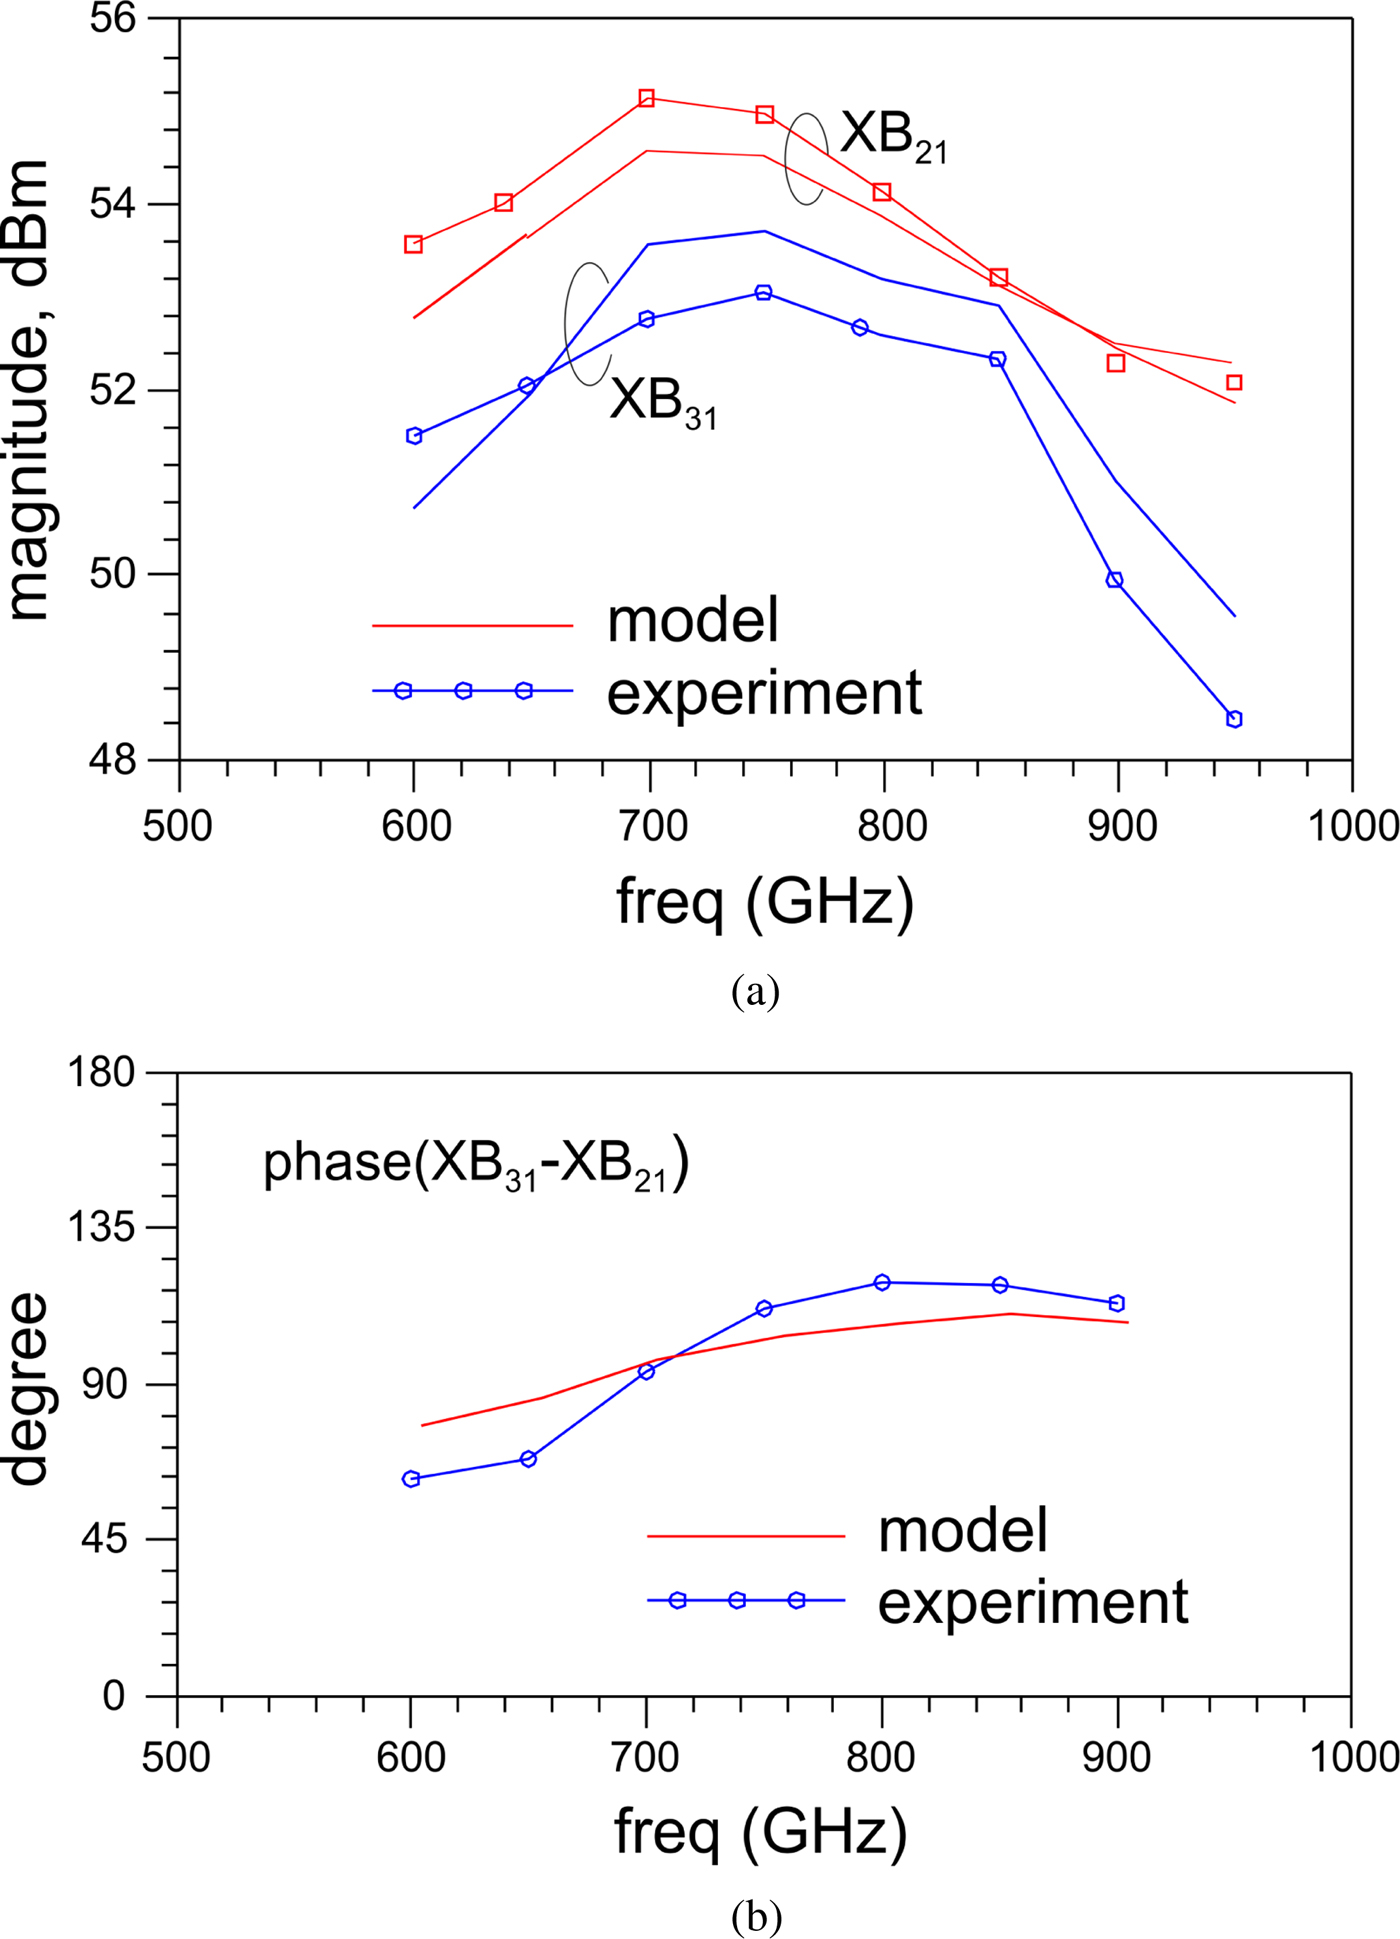
Lastly, Fig. 13 compares the parameters XB 21 and XB 31 at a carrier power of 31 dBm, over the 600–960 MHz frequency band. The two models exhibit qualitatively the same behavior, confirming that the non-linear mapping function is well represented by the two models. In terms of the bandwidth response of the subcircuit, we can observe that while the phase response, cf. Fig. 13(b), associated to the model is within ± 9 degree over more than 200 MHz of the bandwidth, the experimental results show a much narrower band response, namely 80 MHz about 700 MHz for the same phase deviation. The limitation of the bandwidth response is also exhibited by the magnitudes of the parameters in Fig. 13(a), which reports qualitatively equal responses with amplitude significantly decreasing above 800 MHz. The band pass behavior exhibited by the magnitude of the parameters XB 21 and XB 31 is revealed in b 21 and b 31 as the latter are the main contributions to the output waves; an optimized DPA output network can equalize the final DPA response over the bandwidth.
Comparison of measured (symbols) and simulated (continuos) XB 21 and XB 31 parameters at 31 dBm input power across the frequency band. (a)Magnitude of XB 31 and XB 21. (b) Phase difference between XB 31 and XB 21.
Application of the X-parameters model to Doherty PA analysis
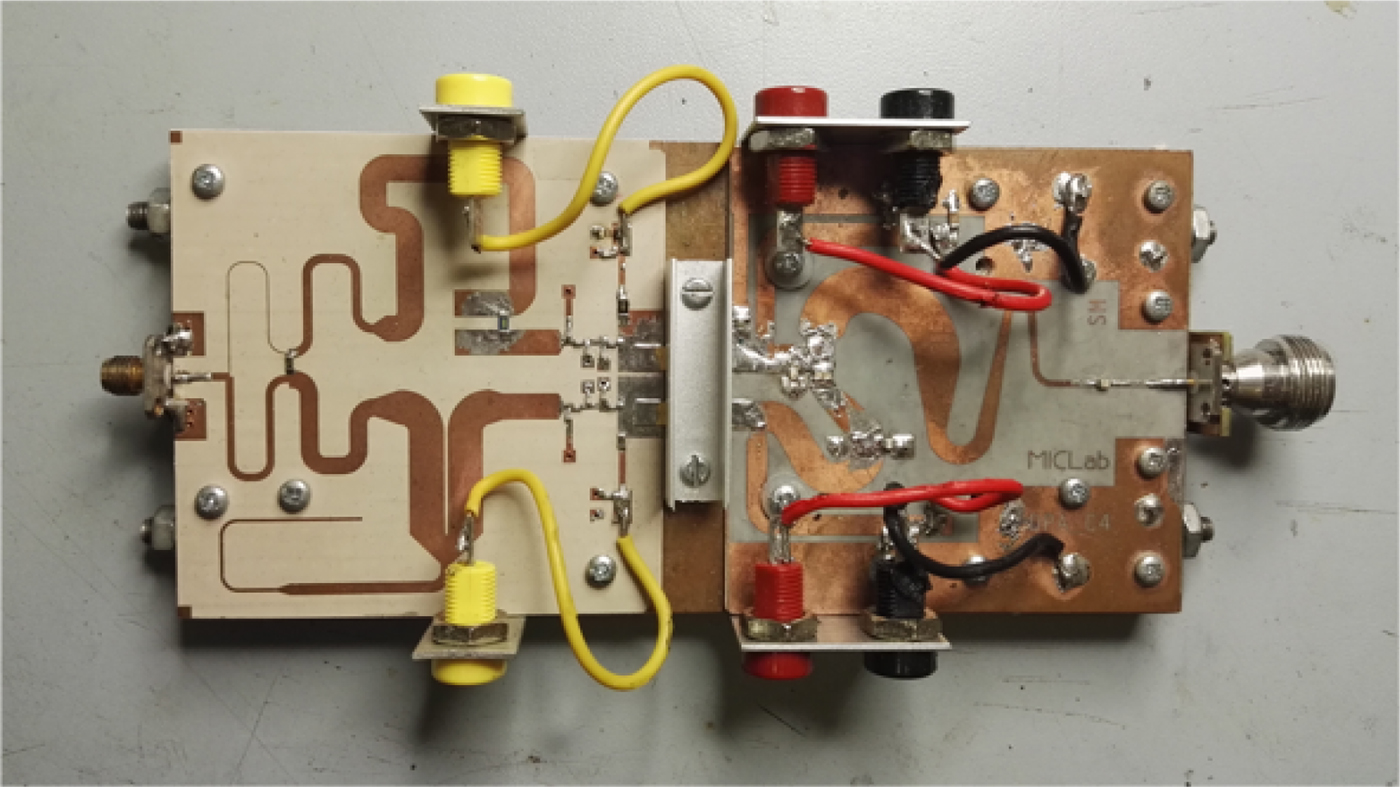
In order to test the X-parameters model in a realistic case, we assembled the DPA prototype shown in Fig. 14. It integrates the input network and the device pair discussed in section “Large-signal vector characterization of the DPA sub-circuit”, along with the output network developed in [Reference Cidronali, Maddio, Giovannelli and Collodi21], for the same operating frequency band and the same power devices considered in this paper.
Picture of the DPA prototype analyzed by the three-port X-parameters.
The rationale of this part of the paper consists in discussing the simulation accuracy of the model approach herein presented, regardless of the performance of the DPA, while demonstrating the possibility of adopting the X-parameters of the DPA device pair considered as whole for the analysis of broadband DPA, and finally, suggesting its possible application to DPA design optimization.
For this purpose, in a CAD schematic, the three-port X-parameter model discussed in section “Large-signal vector characterization of the DPA sub-circuit” was connected to the output network circuit schematic of the DPA. The latter consists of the output combiner, the bias network, and the output matching network, implemented according to the original design, [Reference Cidronali, Maddio, Giovannelli and Collodi21].
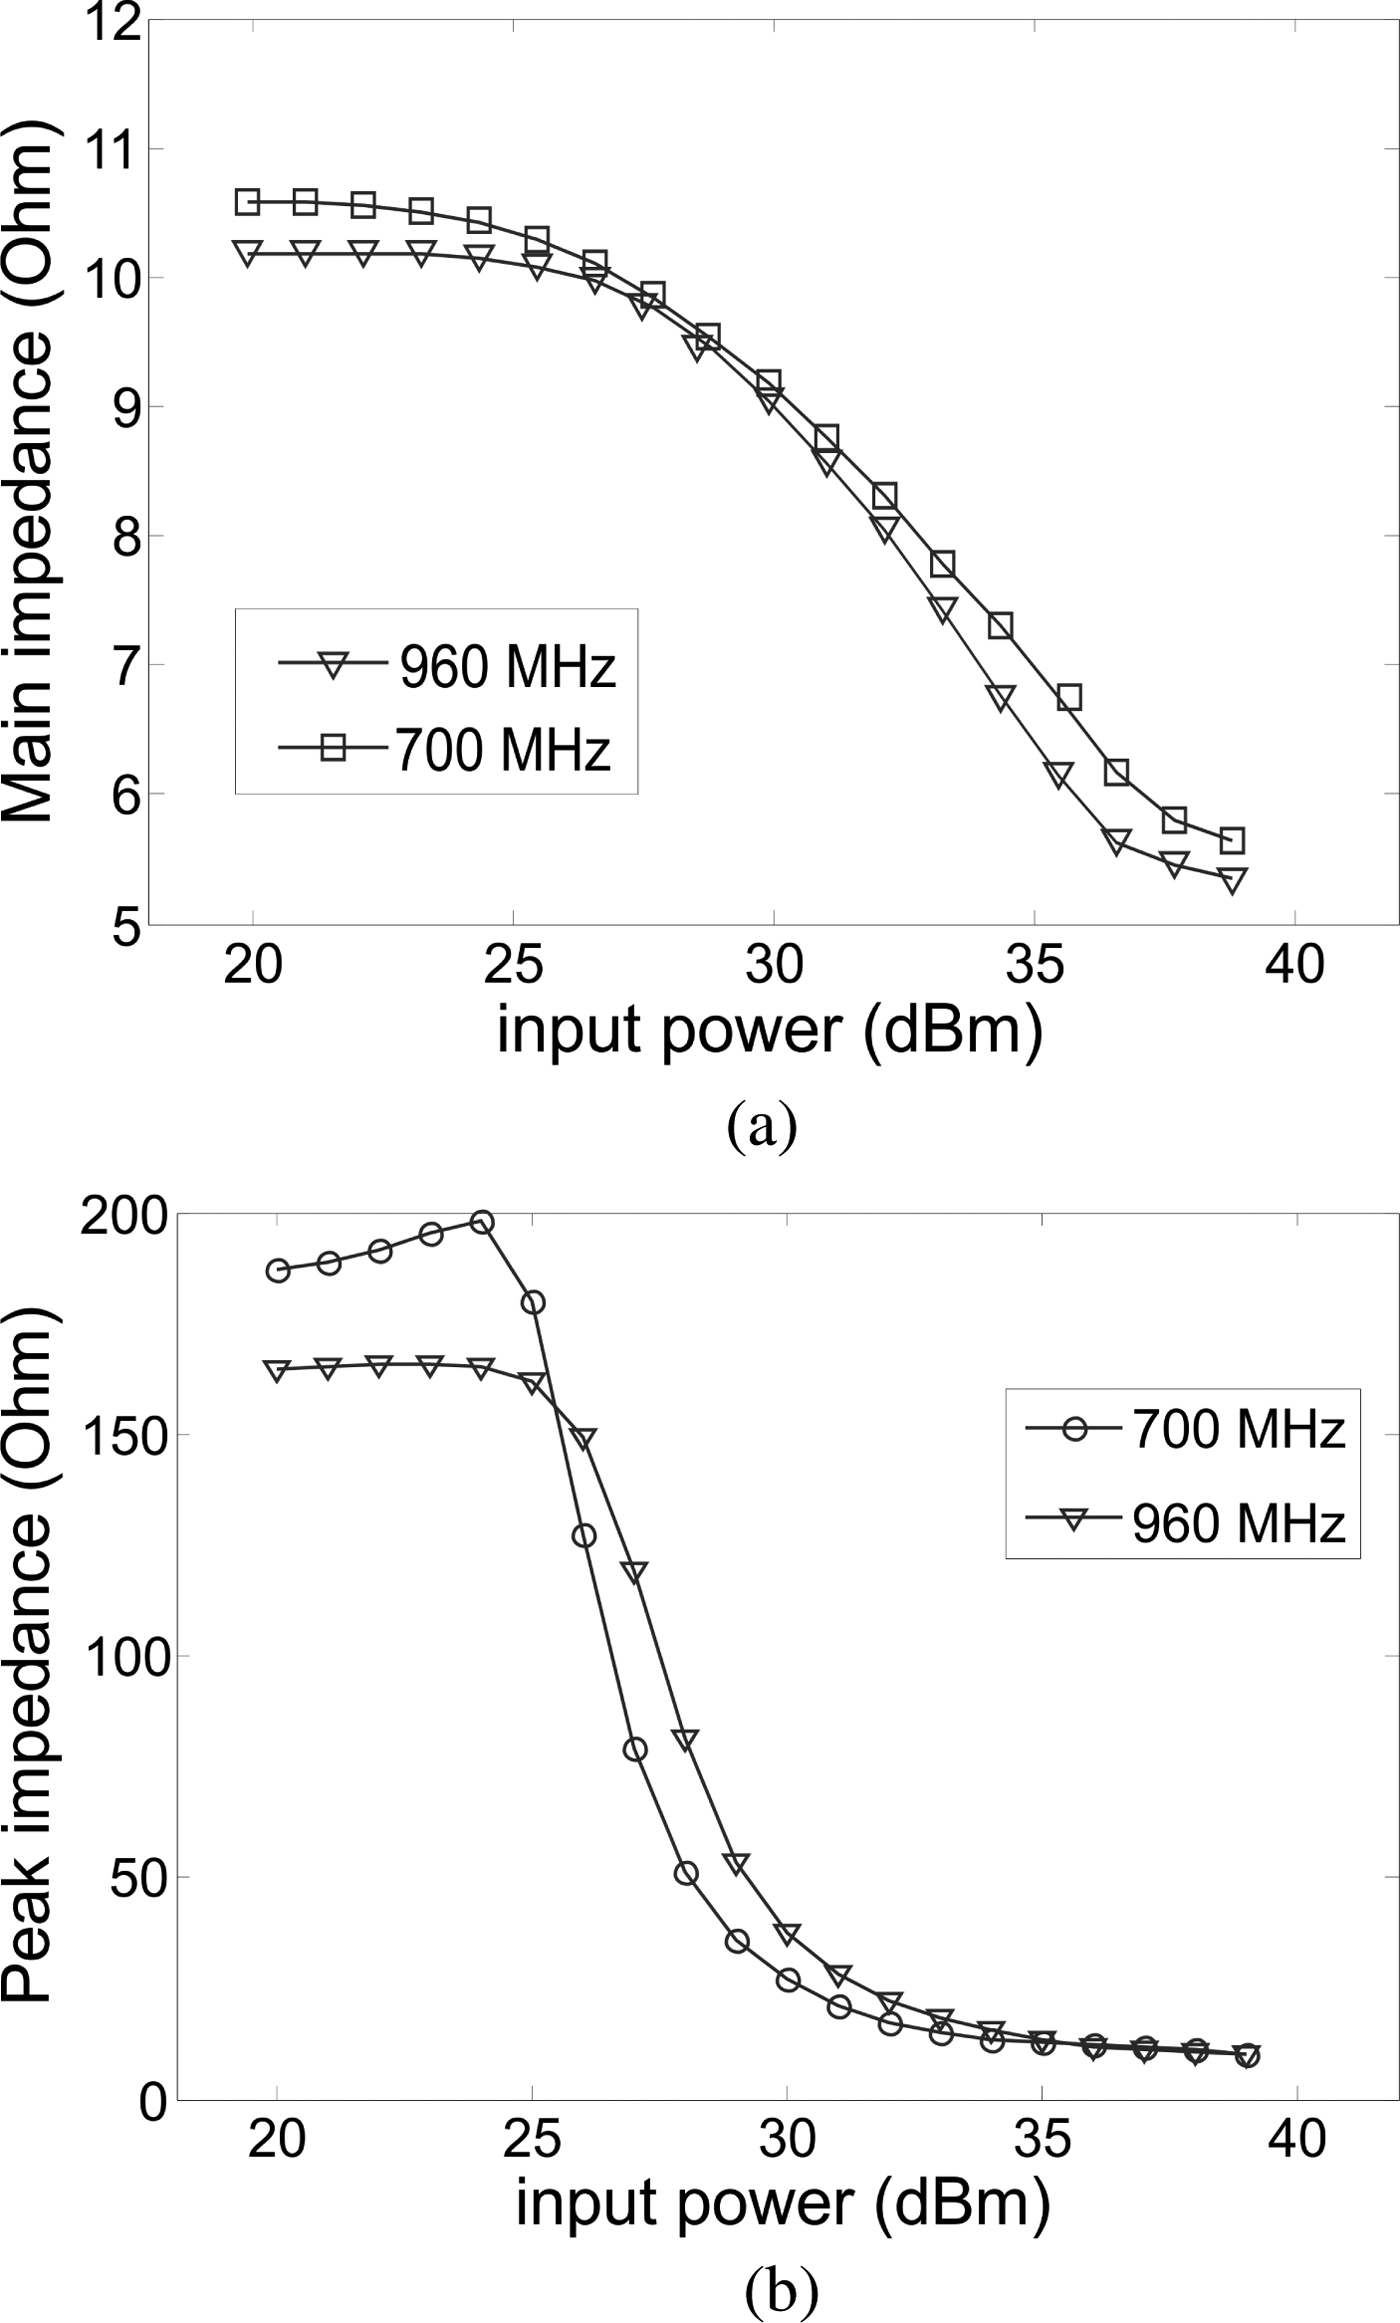
By running circuit simulations with a harmonic balance analysis engine, we have obtained an important insight into the DPA circuit. It consists in the resulting load modulations at the peak and main drain devices. These are extracted from the simulated data by including ideal direction couplers at the drain terminals and are reported in Fig. 15, over the designed frequency bandwidth and for the entire range of input signal levels. In particular, from Fig. 15(a) we can observe the turn on of the peak permits modulating the main termination from 10 to 5OhmΩ over the bandwidth, which is an acceptable set of values, according with the required optimum value resulted by the load–pull analysis, cf. Fig. 4(a). Similarly, from Fig. 15(b), the peak device at the lower power sees, toward the summing node, a termination higher than 160 OhmΩ over the bandwidth, which decreases to about 10 OhmΩ at full power. Although the mutual load modulation between the two power devices is acceptable, from this analysis it appears that it can be furthermore optimized. This objective can be pursued by involving the three-port X-parameters herein discussed, already in the DPA design and optimization stage. This investigation is beyond the scope of the present work.
Load modulation as the function of operating frequency, simulated by X-parameters at 850 MHz; measurements: symbols, simulation: continuous curves. (a) Main device load modulation. (b) Peak device load modulation.

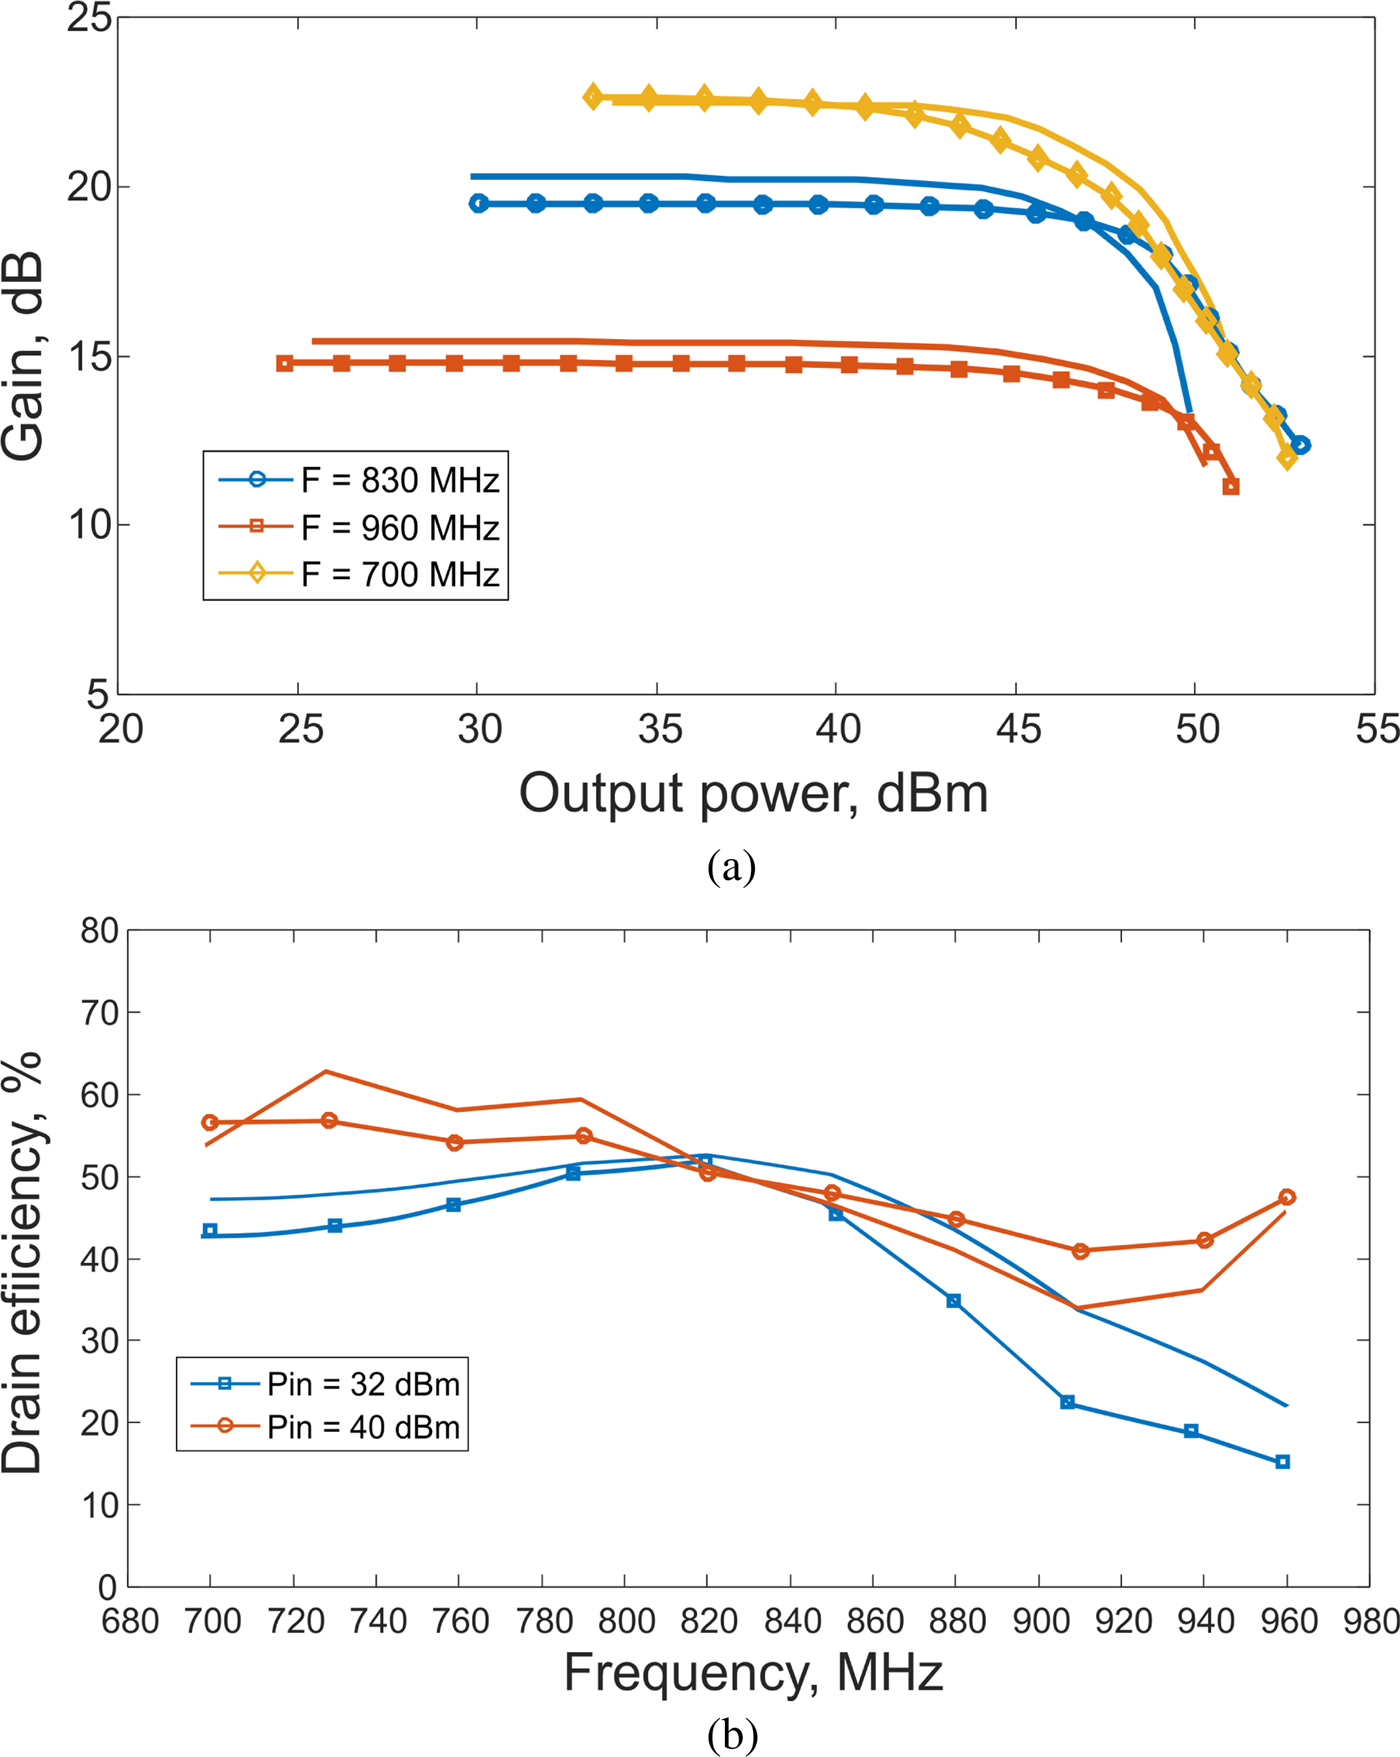
A comparison of the measured and simulated data by using the three-port X-parameters characterization for the DPA sub-circuit is reported in Fig. 16. In particular the power gain of the DPA prototype is reported in Fig. 16(a); the values range from 14.9 to 22.6 dB with a general decreasing trend at higher frequencies. From the curves we see that the accuracy of the model over the bandwidth and power level is significant, with a slight degradation about the compression at the center frequency. The compression of the power gain starts at power levels larger than 48 dBm but it is not monotonic in general, with a predicted lower level at the center frequency range. Nevertheless, this effect is to be attributed to the incorrect modeling of the output impedance inverter, which involves several surface-mounted capacitors that exhibit nominal value tolerance and model accuracies that can justify this frequency behavior. From the data we can observe that the peak power reaches 54.2 and 51.2 dBm at 700 and 960 MHz respectively; at these extremes of the analysis frequency band we can observe the significant accuracy of the three-port X-parameters model. The corresponding comparison for the continuous wave (CW) drain efficiency (DE) is reported in Fig. 16(b). The data show that the estimated maximum DE is 61% at the power peak of 54.2 dBm with a maximum DE at 8 dB of input back-off of 43% at 700 MHz; over the entire bandwidth, the accuracy shown by the CAD simulation by the three-port X-parameters of the sub-circuit is rather high.
Comparison between measurements and simulations with three-port X parameters characterization of the DPA subcircuit. (a) DPA gain magnitude versus operating frequency and output power. (b) DPA CW drain efficiency versus operating frequency and output power.
Conlusions
This paper has discussed the development of a three-port X-parameters model of the Doherty sub-circuit, composed of a PTVA042502FC Si-LDMOS device along with an input network. The model turns out to be suitable for the analysis of broadband Doherty high-power amplifiers, and has good prospects for use in their design. The characterization of the sub-circuit was possible by a large-signal vector characterization setup capable of handling three-port high-power devices. This was enabled by a test fixture of the sub-circuit, which included tapered transmission lines to make the two power devices terminated with the optimum impedance to preserve approximately the same impedance between characterization and operating conditions. The three-port X-parameters model, when involved in the analysis of the DPA load modulation effect, reveled the level of optimization of the mutual load modulation between the power devices, and it is capable of capturing interactions between the two devices that were not observed by the use of the CAD model, which does not take into account the actual packaging of the two devices, and does not accurately model the devices in different classes of operation.
The model is capable of characterizing the sub-circuit over a given bandwidth, although additional work is required to include long-term dynamic effects [Reference Verspecht, Horn and Root9,Reference Roblin, Root, Verspecht, Ko and Teyssier10] into the description provided by the present paper.
Author ORCIDs
Alessandro Cidronali, 0000-0002-1064-7305.
 Alessandro Cidronali received the Laurea and Ph.D. degrees in electronics engineering from the University of Florence, Florence, Italy, in 1992 and 1997, respectively. Currently, he is an Associate Professor with the Department of Information Engineering, University of Florence, where he teaches courses on electron devices and integrated microwave circuits. From 1999 to 2003, he was a Visiting Researcher with the Motorola Physics Science Research Laboratory. From 2002 to 2005, he was a Guest Researcher with the Non-Linear Device Characterization Group, Electromagnetic Division, National Institute of Standards and Technology (NIST). Under the frame of the IST-EU FP6 Network TARGET (IST-1 - 507893 - NOE), he served as a Workpackage Leader for the transmitters modeling/architectures for wireless broadband access work packages. His research activities concern the study of analysis and synthesis methods for non-linear microwave circuits, the design of broadband microwave integrated circuits, and the development of computer-aided design (CAD) modeling for microwave devices and circuits. Prof. Cidronali was a recipient of the Best Paper Award presented at the 61st ARFTG Conference, and the IEEE Microwave Magazine 2016 Best Paper Award. From 2004 to 2006, he was an Associate Editor for the IEEE Transaction on Microwave Theory and Techniques. Currently he is the member of IEEE Microwave Theory and Techniques Society TC-20 Wireless Communications and TC-27 Vehicular Technologies and Communications.
 Giovanni Collodi was born in Florence, Italy, in 1966. He received the M.S. degree in electronic engineering (first-class honors) and Ph.D. degree in computer science and telecommunication engineering from the University of Florence, Florence, Italy, in 1996 and 2002, respectively. His doctoral work focused on MMIC circuit design and device modeling.From 2001 to 2004, he was a Postdoctoral Researcher with Arcetri Astrophysical Observatory, Department of Information Engineering, University of Florence, Florence, Italy. In 2002, he was also a Visiting Researcher with the Physical Sciences Research Lab Motorola, Tempe, AZ, USA. In the same period, he was a Contract Professor of electronics with the University of Florence. During his postdoctoral work with Arcetri Astrophysical Observatory, he was involved with the ATACAMA Large Millimeter Array radio telescope project (integrated circuit design). In 2005, he became an Assistant Professor with the Department of Information Engineering, University of Florence, where he focused his interest on developing systems for wireless applications. In 2006, he began his involvement with the Interdepartmental Center Technology and Microsystems for Quality and Environmental Safety (CITMQSA). Since 2007, he has taught a course on technology and systems for wireless application. His interest is now focused on the development of microwave systems.