





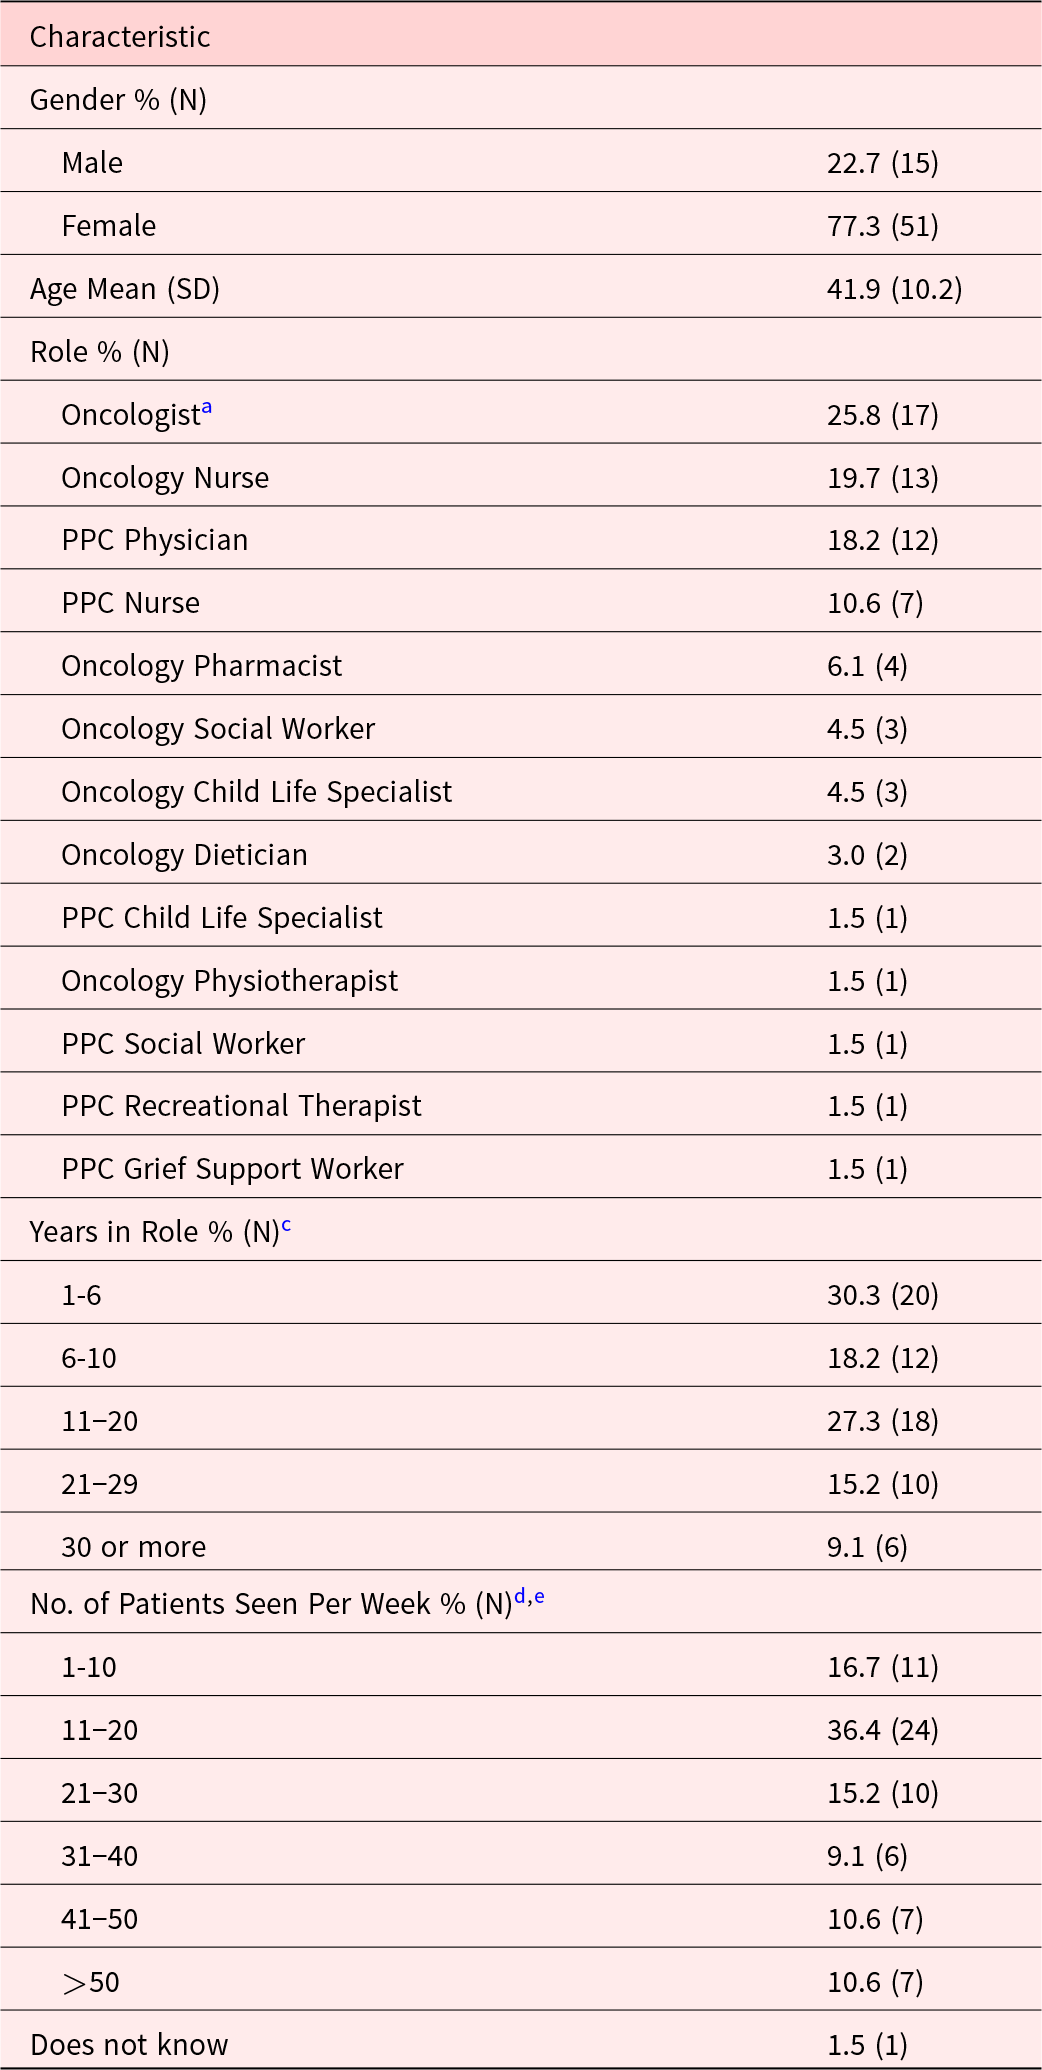
The Authors regret that errors were identified in Table 1 of the published article. The corrected Table 1 appears below.
Participant Demographics (N=66)

Table 1 Long description
Participant demographics for 66 clinicians are summarized by gender, age, professional role, years in role, and typical weekly patient volume. Most participants were female (77.3%, 51) and 22.7% (15) were male; mean age was 41.9 years (standard deviation 10.2). The largest role group was oncologists at 25.8% (17), followed by oncology nurses at 19.7% (13) and pediatric palliative care physicians at 18.2% (12); all other roles each accounted for about 11% or less. Years in role were most commonly 1 to 5 years (30.3%, 20) or 11 to 20 years (27.3%, 18), with fewer reporting 30 years or more (9.1%, 6). Weekly patient volume most often fell in the 11 to 20 range (36.4%, 24), while 16.7% (11) saw 1 to 10 patients and about one in five saw more than 40 patients per week (21.2%, 14). Counts and percentages reflect how trainees were grouped within clinician categories, and some values were derived from reported ranges or from on service or clinic weeks.
a,b Resident and Fellow Trainees were counted among Oncologists and PPC Physicians. There were n = 4 Oncologist Fellows and n = 1 PPC Resident in their respective categories.
c,d When participants reported a range of years, the average was taken between the lower and upper values.
e Patients Seen per Week refers to when clinicians are on service and/or in clinic.


 Open access

