Introduction
Human pregnancy is associated with marked increases in renal hemodynamics. The glomerular filtration rate (GFR) increases by 50% in normal pregnancy, mainly due to the increase in renal plasma flow (RPF) and also the permeability of the filtration barrierReference Bramham and Rajasingham 1 and decreased glomerular oncotic pressure.Reference Milne, Lindheimer and Davison 2 The activity of the renin–angiotensin–aldosterone system (RAAS) is increased during pregnancy to ensure the physiological adaptations necessary for this phase,Reference August and Sealy 3 , Reference Skinner 4 which may be accompanied by an increase in urinary protein excretion; this is more prevalent in cases of diabetes during pregnancy.Reference Reece, Coustan and Hayslett 5
In 2010, the world’s adult population with diabetes mellitus (DM) was estimated at around 285 million and by 2030 is expected to increase by 54%.Reference Tramonti and Kanwar 6 The modified intrarenal RAAS activation has been considered a major cause of renal damage that occurs in diabetes,Reference Brezniceanu, Liu and Wei 7 , Reference Liu, Brezniceanu and Wei 8 as treatment with blocking angiotensin II in animals in which DM was induced by streptozotocin and in humans led to the normalization of urinary protein excretion and the reduction of renal structural changes.Reference Remuzzi, Perico and Amuchastegui 9 – Reference Zatz, Dunn and Meyer 11
It is widely known that the risk of adverse effects for both mother and children is higher in patients with pre-gestational diabetes (types 1 and 2) compared with the general population.Reference Taylor and Davison 12 Similarly, it is known that the unregulated blood glucose during the second and third trimesters of pregnancy is associated with increased rates of premature birth, preeclampsia (PE), macrosomia, and maternal and perinatal morbidity and mortality.Reference Galindo, Burguillo and Azriel 13 , Reference Remsberg, McKeown and McFarland 14 In general, women with diabetes and nephropathy have increased proteinuria due to the increased GFR and increased perinatal complications.Reference Purdy, Hantsch and Molitch 15 – Reference Irfan, Arain and Shaukat 17
However, there are no reports in the literature about renal structural and functional effects from diabetes induced during pregnancy and maintained in the postpartum period, which are the objectives of this study.
Method
Animals
This study was submitted and approved by the Institutional Animal Care and Use Committee of Federal University of Uberlândia (056/14). For the non-pregnant group, female Wistar rats were divided into the following groups: Group 1 [G1 – non-pregnant control rats – females that received intraperitoneal injection (ipi) of 0.9% saline solution] and Group 2 [G2 – non-pregnant diabetic rats – females that received ipi of alloxan (100 mg/kg) (Sigma-Aldrich, UK) diluted in 0.9% saline solution]. For the pregnant group, female Wistar rats (two to three per male) were caged overnight with a male. Vaginal smears were taken on the following morning. All dams were housed and fed individually and were divided into following groups: Group 3 (G3 – control mothers – mothers that received ipi of 0.9% saline solution on the first day of pregnancy) and Group 4 [G4 – diabetic mothers – mothers that received ipi of alloxan (100 mg/kg) diluted in 0.9% saline solution on the first day of pregnancy].
The rats in all groups were fasted for about 24 h for alloxan-induced diabetes or saline administration. A 20% glucose solution was used within 24 h to prevent the death of rats by hypoglycemia. The type 1 diabetic state was confirmed 2 days after induction by measuring blood glucose; only those animals with glycemic levels greater than or equal to 150 mg/dl were considered diabetic. About 50 days after delivery of G3 and G4 and at a corresponding time for G1 and G2, the animals were subjected to functional [determination of systolic blood pressure (SBP), and glomerular filtration rate (GFR)] and structural studies, as well as immunohistochemistry.
A total of five animals were used in G1, while in G2 19 rats were alloxan-induced diabetes, but only six survived to the end. We select 18 rats to G3 and in G4 57 were diabetes induced, 14 parturients and only 12 survived up to 50 days postpartum.
SBP
The assessment of SBP was evaluated indirectly by plethysmography in the rats from 4 groups proposed, 50 days after delivery, at the Laboratory of Biological Activity Registry from Biomedical Sciences Institute (ICBIM) of the Federal University of Uberlândia (UFU). The animals were previously heated in a chamber for a few minutes and then submitted to PAS measurement using a cuff and an electrode placed directly on the tail of these animals by 5 days. Before the effective measurement of SBP (5th day), the animals went through a habituation period of 4 days. The captured signals were amplified by PowerLab software (ADInstruments) and converted by LabChart 7 Pro (ADInstrutments) into SBP values in mmHg.
Renal function studies
Rats were placed in metabolic cages for a period of 24 h for adaptation. After this, they remained in the cages for a further 24 h and urine and blood samples were collected. GFR (ml/min) was evaluated by creatinine clearance (Gold Analisa Diagnóstica Ltda, Belo Horizonte, Brazil) and creatinine was measured in plasma and urine samples using a colorimetric method.Reference Yan, Li and Su 18
Kidneys removal
After functional studies, female rats were anesthetized and had their kidneys removed for histological and immunohistochemical analyses. The kidneys were fixed in methacarn solution for 24 h and then rinsed in 70% ethanol.
Histological and morphometric analysis
Masson’s trichrome staining enables the analysis of renal tissue, as well as measurements of total renal sectional area (µm2). In addition, measurements of the total glomerular area (µm2), glomerular tuft (µm2) and capsular space areas (µm2) of 20 random glomeruli/blade were determined 40× magnification. The quantification of the above areas was performed using the Image J program (Version 1.4).
Picrosirius red staining was used for the quantification of collagen. In this step, images were captured on the entire blade at 10× magnification and the Threshold tool of the Image J program (Version 1.4) was used to quantitate the percentage (%) of the area marked with collagen.
Immunohistochemical analysis
Renal tissue sections were incubated with primary monoclonal anti-α-smooth muscle actin (SMA) antibody (1:1000 – DAKO Corporation), anti-p-JNK (1:30 – Santa Cruz Biotechnology) and anti-p-p38 (1:400 – Sigma Chemical Company) overnight at 4°C and anti-proliferation cell nuclear antigen (PCNA) antibody (1:1000 – Sigma Chemical Company, Israel) for 30 min at room temperature. The sections were then subjected to further incubation with a secondary mouse anti-IgG antibody (1:200 – monoclonal – Vector Laboratories, Burlingame, CA, USA). Immunohistochemical staining was detected by avidin-biotin-peroxidase system (Vector Laboratories), stained with DAB (3,3-diaminobenzidine) (Sigma Chemical Company, Israel) and the sections were counterstained with methyl green (α-SMA, p-p38 and PCNA) or Harris Hematoloxylin (p-JNK).
Immunohistochemical evaluation
Immunohistochemistry for anti-α-SMA and anti-p-JNK was evaluated by analyzing the percentage of glomeruli or renal cortex labeled by assigning a score between 0 and 4 as follows: 0 was equivalent to 0–5% staining; 1 indicated 5–25%; 2 indicated 25–50%; 3 indicated 50–75%; and 4 indicated 75–100% staining.Reference Kliem, Johnson and Alpers 19 The numbers of PCNA-positive and p-p38-positive cells in each glomerulus or cortical interstitial grid field were determined in all renal cortex samples, and the mean counts were calculated for each kidney.
Statistical analysis
Statistical significance between the experimental groups was assessed using GraphPad Software Prism 5.0 (Trial). Data were analyzed using the non-parametric Kruskal–Wallis test followed by the Dunn post-test. These data were expressed as the mean±standard error of the mean (s.e.m.). In all cases, the level of significance was set at P<0.05.
Results
Confirmation of diabetes state
Blood glucose was higher in G2 (338±77.02 mg/dl) and G4 (403±57.09 mg/dl) when compared with G1 (108±7.29 mg/dl) and G3 (118±5.87 mg/dl), with no differences between G2 and G4. Furthermore, diabetic animals from G2 (60.20±16.01 ml) and G4 (58.78±11.26 ml) presented increased urinary volume in relation to G1 (13.20±1.46 ml) and G3 (16.72±1.96 ml), with no statistical differences between them.
Function studies
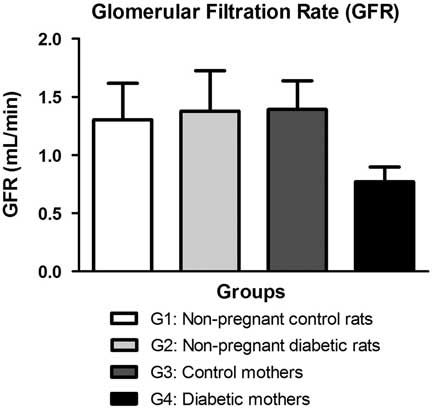
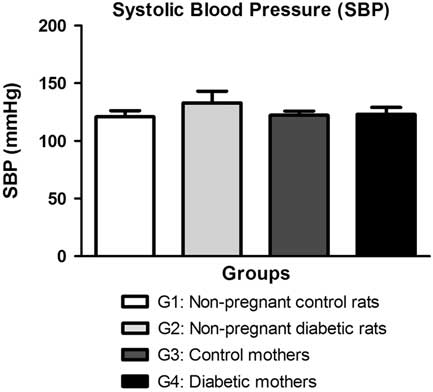
There were no significant differences between the groups to GFR, but G4 showed a tendency to reduction (0.77±0.13 ml/min) when compared with other groups (G1: 1.30±0.31; G2: 1.38±0.35; G3: 1.39±0.25 ml/min) (Fig. 1). SBP measured by plethysmography showed no significant differences between the groups (Fig. 2).
Glomerular filtration rate (GFR) determination by creatinine clearance. G1 (non-pregnant control rats), G2 (non-pregnant diabetic rats), G3 (control mothers) and G4 (diabetic mothers). Data are expressed as mean±s.e.m.

Systolic blood pressure (SBP) determination by plethysmography. G1 (non-pregnant control rats), G2 (non-pregnant diabetic rats), G3 (control mothers) and G4 (diabetic mothers). Data are expressed as mean±s.e.m.

Kidney weight/body weight ratio and histological, morphometric and immunohistochemical analysis
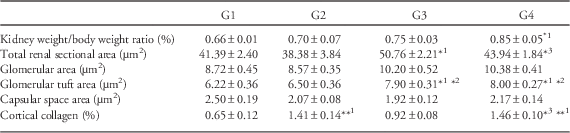
Kidney weight/body weight ratio was higher in G4 (0.85±0.05%) when compared with G1 (0.66±0.01%), with no significant differences between the other groups (Table 1).
Data from histological and morphometric analysis

Data are expressed as mean±s.e.m.
*1 P<0.05 (v. non-pregnant control rats: G1); *2 P<0.05 (v. non-pregnant diabetic rats: G2); *3 P<0.05 (v. control mothers: G3); **1 P<0.01 (v. non-pregnant control rats: G1).
G3 presented increase of total renal sectional area (50.76±2.21 µm2) when compared with G2 (38.38±3.84 µm2) and there was a significant reduction in G4 (43.94±1.84 µm2) in relation to G3 (Table 1). The statistical analysis showed no differences in relation to glomerular area and the capsular space (Table 1) between the groups. However, glomerular tuft area was higher in G3 (7.90±0.31 µm2) and G4 (8.00±0.27 µm2) when compared with G1 (6.22±0.36 µm2) and G2 (6.50±0.36 µm2) (Table 1).
Animals from G2 (1.41±0.14%) and G4 (1.46±0.10%) presented a higher distribution of cortical collagen when compared with the respective controls (G1: 0.65±0.12%; G3: 0.92±0.08%), with no differences between them. G4 presented higher collagen expression than G1 (Table 1).
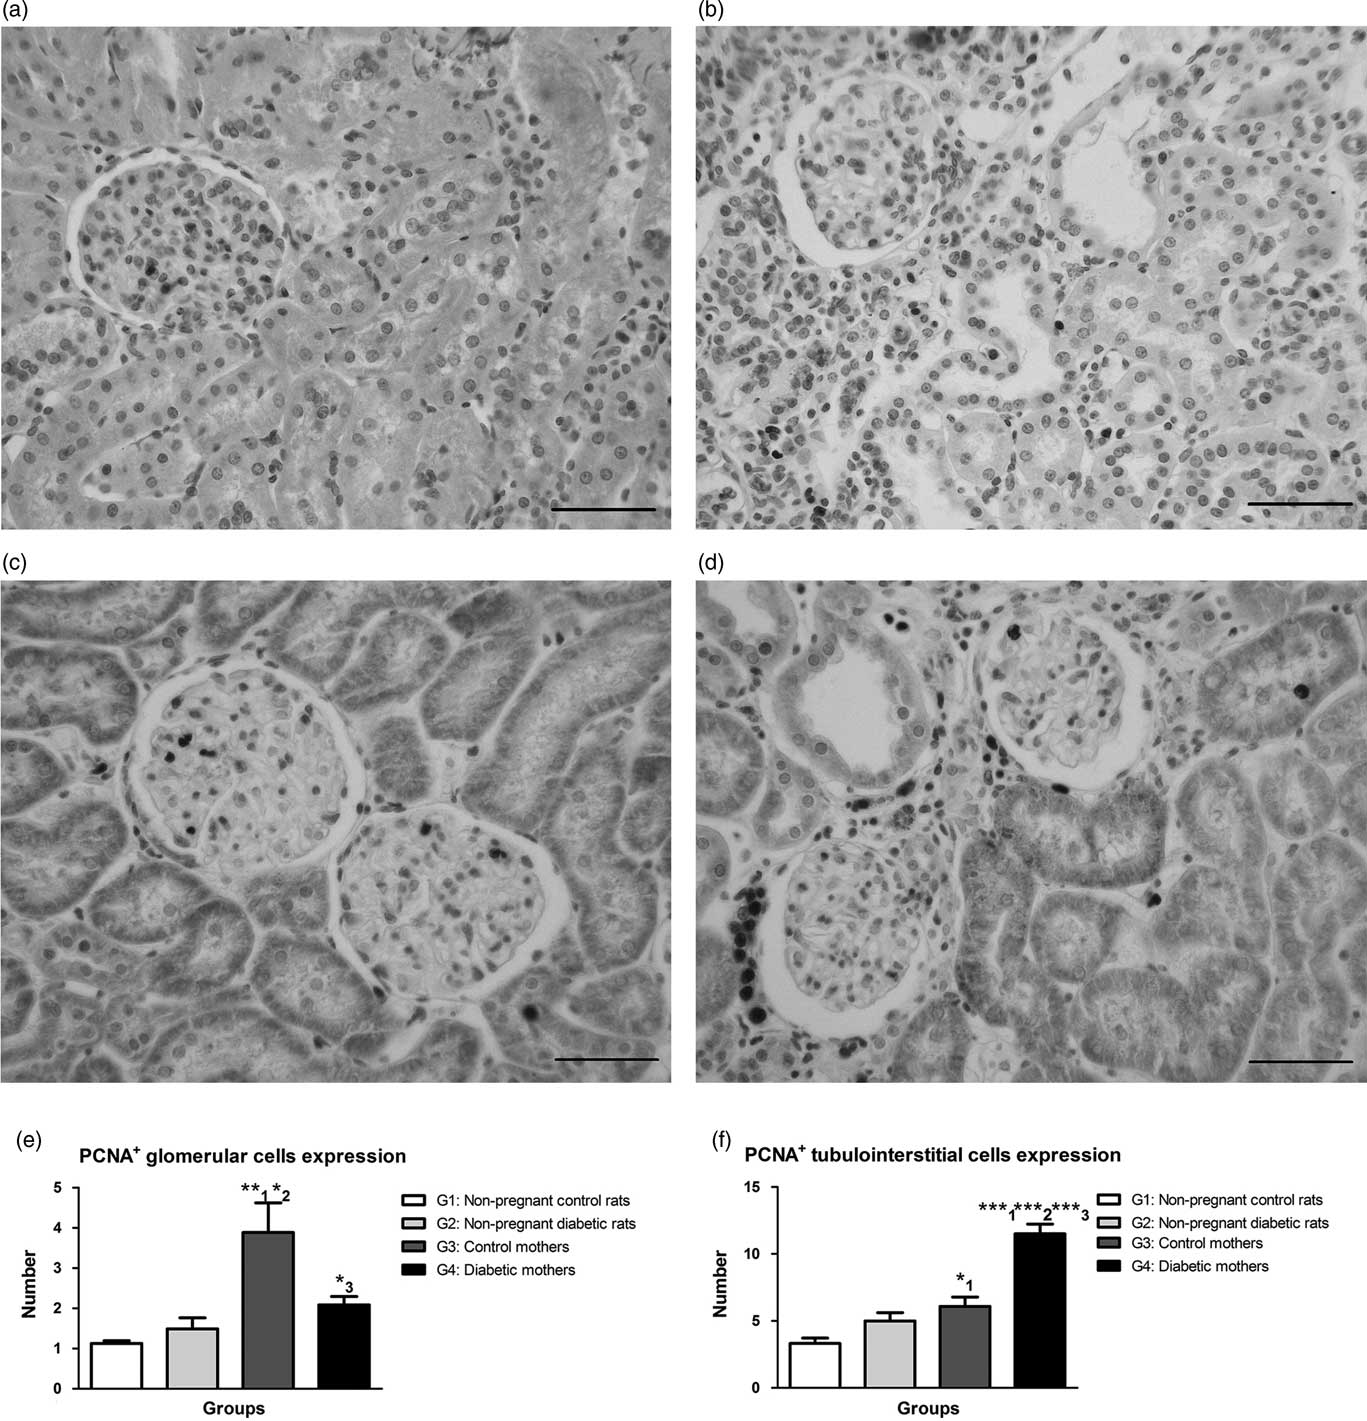
PCNA immunohistochemistry for the detection of cells undergoing proliferation revealed an augment level of glomerular cell proliferation in G3 (3.87±0.73+cells) when compared with G1 (1.13±0.07+cells) and G2 (1.49±0.28+cells), while G4 had a reduction of PCNA+ glomerular cells (2.08±0.21+cells) when compared with mothers of G3 (Fig. 3e). Furthermore, G3 (6.08±0.70+cells) had an increase in PCNA+ cells in the tubulointerstitial (TBI) compartment in relation to G1 (3.31±0.40+cells). On the hand, G4 (11.50±0.74+cells) showed more proliferating cells when compared with the other groups (Fig. 3f).
Immunostaining for PCNA in the renal cortex. G1 (non-pregnant control rats) (a), G2 (non-pregnant diabetic rats) (b), G3 (control mothers) (c) and G4 (diabetic mothers) (d). PCNA+ cells per glomeruli (e) and tubulointerstitial (f) compartment expression in the renal cortex. Data are expressed as mean±s.e.m.; **1 P<0.01 (v. non-pregnant control rats: G1); *2 P<0.05 (v. non-pregnant diabetic rats: G2); *3 P<0.05 (v. control mothers: G3); *1 P<0.05 (v. non-pregnant control rats: G1); ***1 P<0.001 (v. non-pregnant control rats: G1); ***2 P<0.001 (v. non-pregnant diabetic rats: G2); ***3 P<0.001 (control mothers: G3). Scale bar=50 μm.

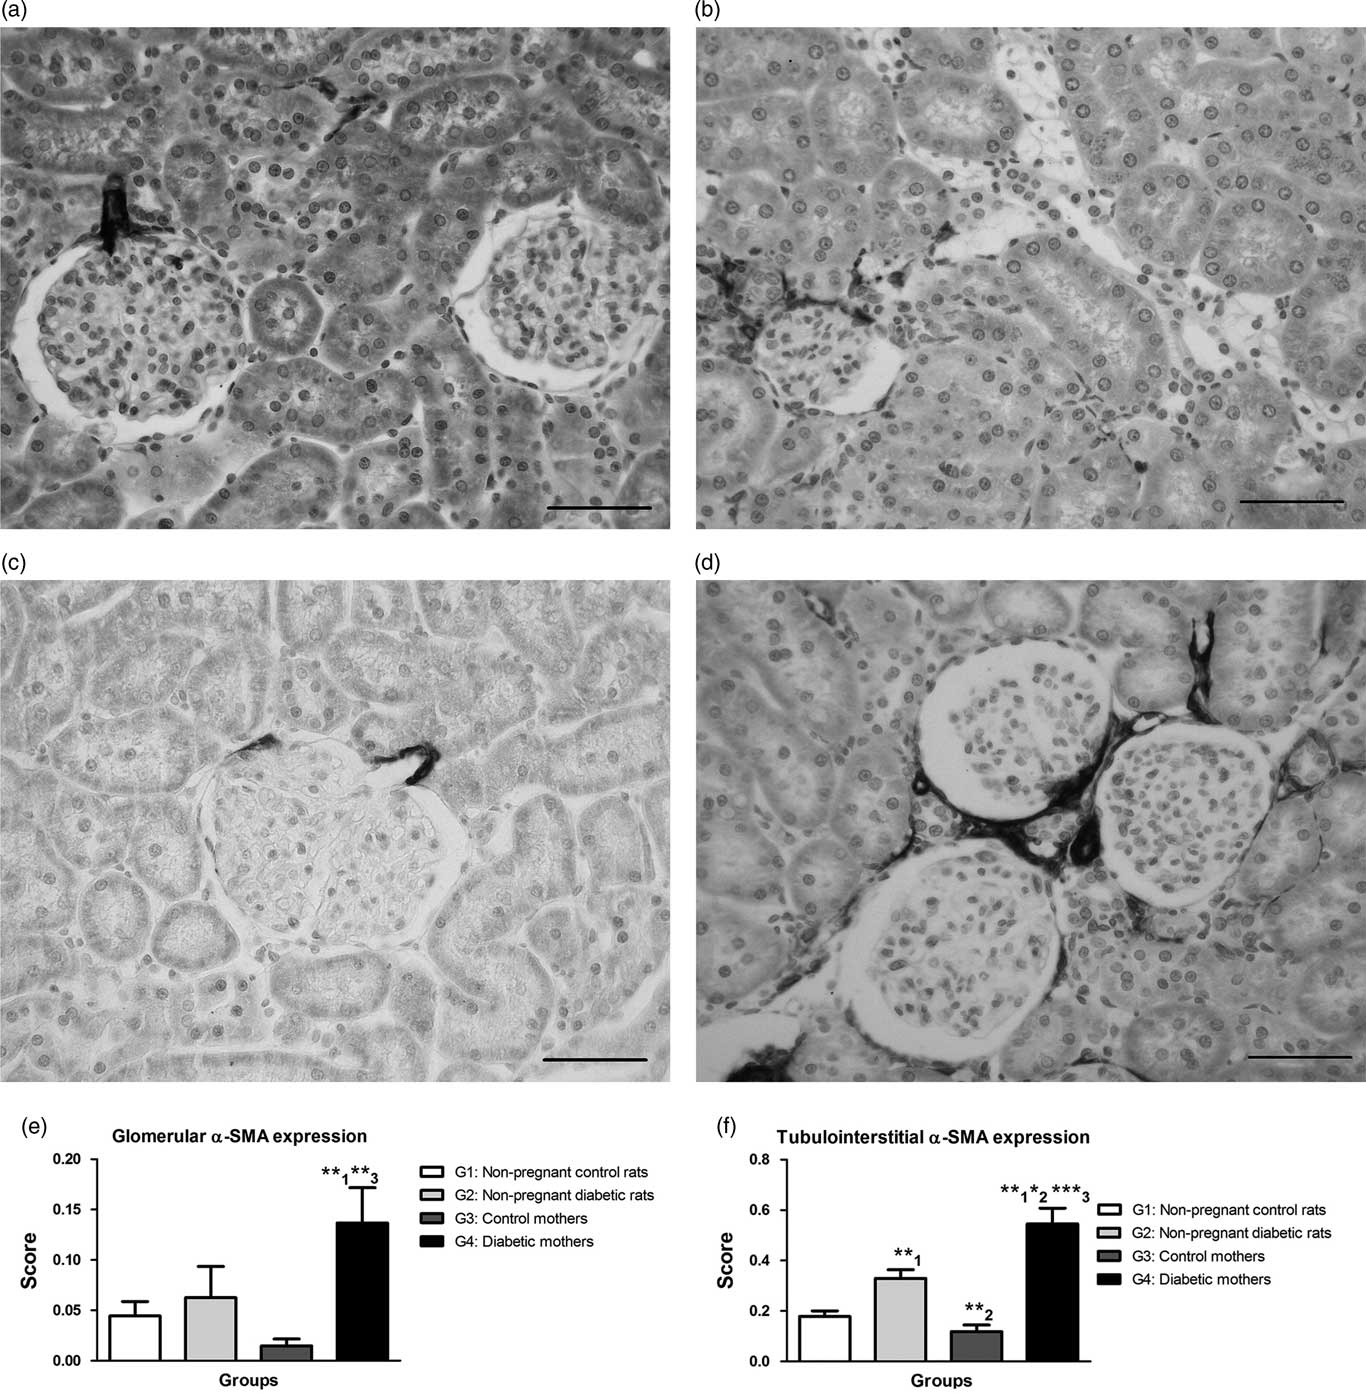
Immunohistochemical analysis showed that G4 (0.14±0.03) presented increased glomerular α-SMA expression when compared with G1 (0.04±0.01) and G3 (0.01±0.00) and a tendency to increase when compared with G2 (0.06±0.03) (Fig. 4e). The α-SMA TBI expression revealed that G2 (0.33±0.03) had greater expression that controls from G1 (0.18±0.02), as well as augmented expression of this protein on TBI in G4 (0.55±0.06) when compared with the other groups (Fig. 4f).
Immunostaining for α-SMA in the renal cortex. G1 (non-pregnant control rats) (a), G2 (non-pregnant diabetic rats) (b), G3 (control mothers) (c) and G4 (diabetic mothers) (d). Glomerular (e) and tubulointerstitial (f) α-SMA expression in the renal cortex. Data are expressed as mean±s.e.m.; **1 P<0.01 (v. non-pregnant control rats: G1); **3 P<0.01 (v. control mothers: G3); **2 P<0.01 (v. non-pregnant diabetic rats: G2); *2 P<0.05 (v. non-pregnant diabetic rats: G2); ***3 P<0.001 (v. control mothers: G3). Scale bar=50 μm.

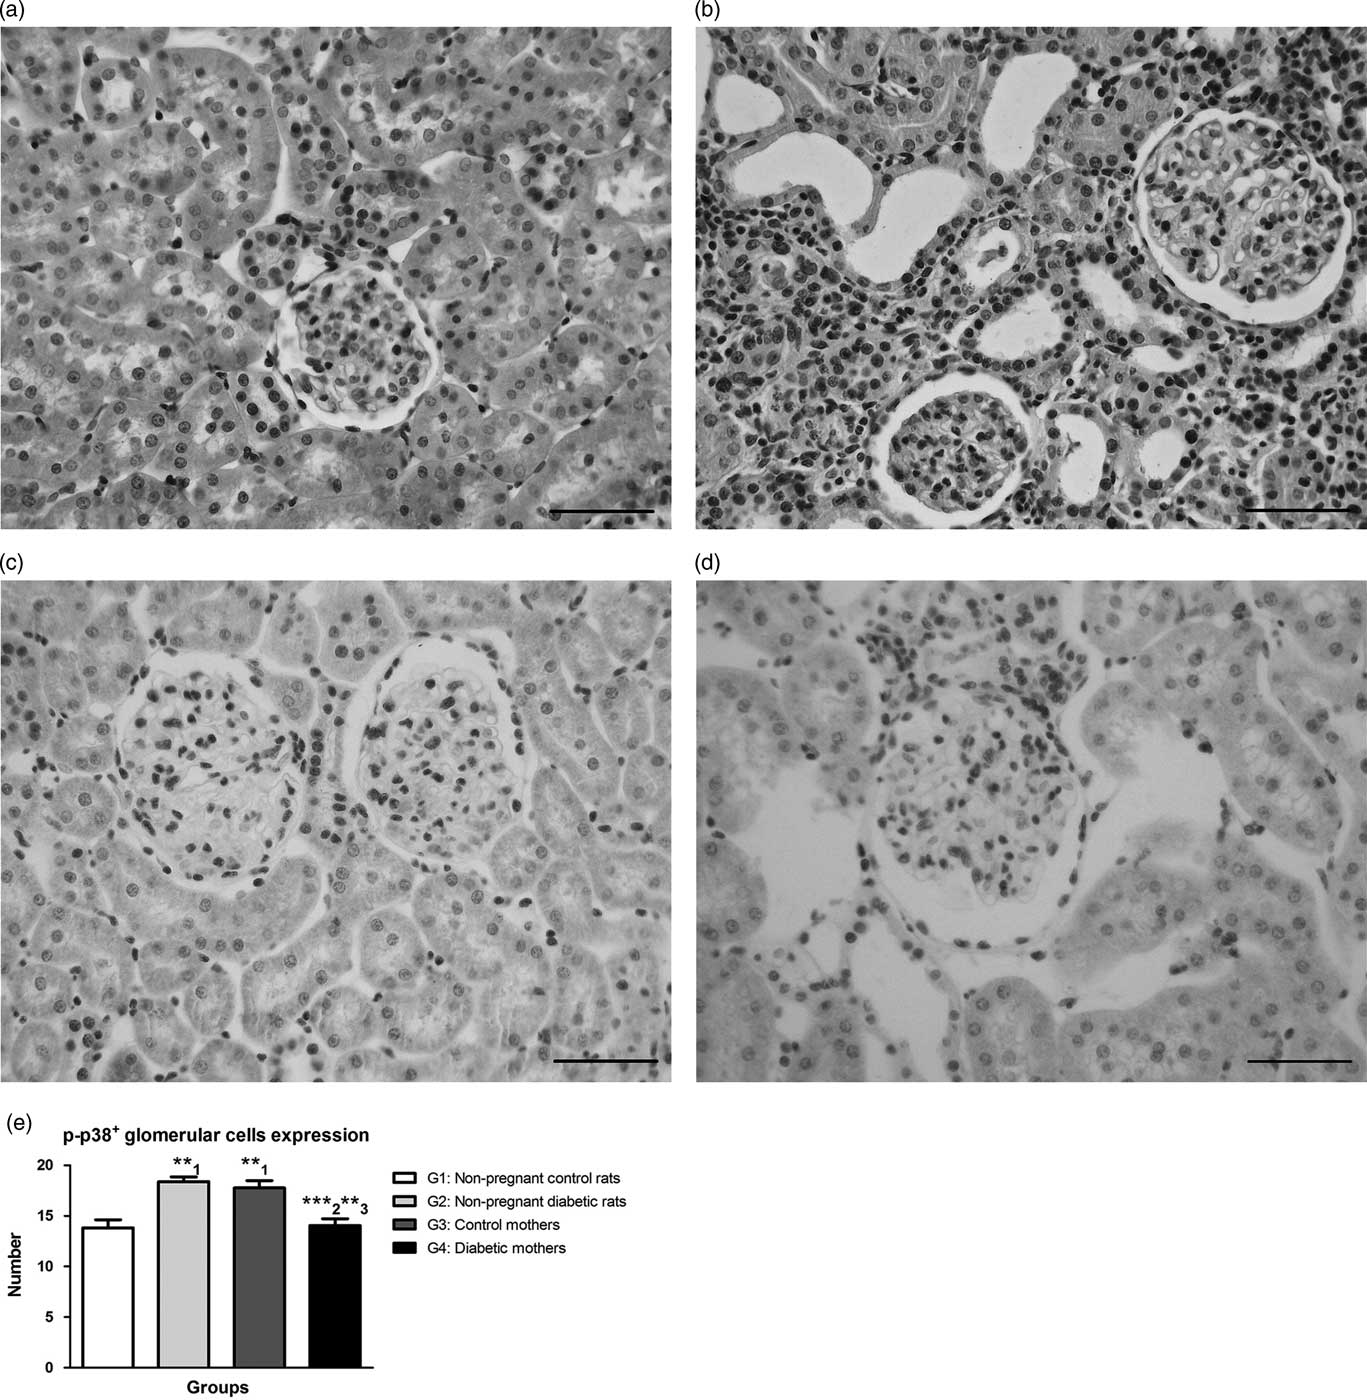
The immunoreactivity for p-p38 revealed higher expression of this mitogen-activated protein kinase (MAPK) in the glomeruli of G2 (18.39±0.46+cells) and G3 (17.78±0.71+cells) when compared with G1 (13.83±0.79+cells). However, G4 (14.06±0.66+cells) showed reduction in number of p-p38 positive (p-p38+) glomerular cells when compared with G2 and G3 (Fig. 5e).
Immunostaining for p-p38 in the renal cortex. G1 (non-pregnant control rats) (a), G2 (non-pregnant diabetic rats) (b), G3 (control mothers) (c) and G4 (diabetic mothers) (d). p-p38+ cells per glomeruli (e) expression in the renal cortex. Data are expressed as mean±s.e.m.; **1 P<0.01 (v. non-pregnant control rats: G1); ***2 P<0.001 (v. non-pregnant diabetic rats: G2); **3 P<0.01 (control mothers: G3). Scale bar=50 μm.

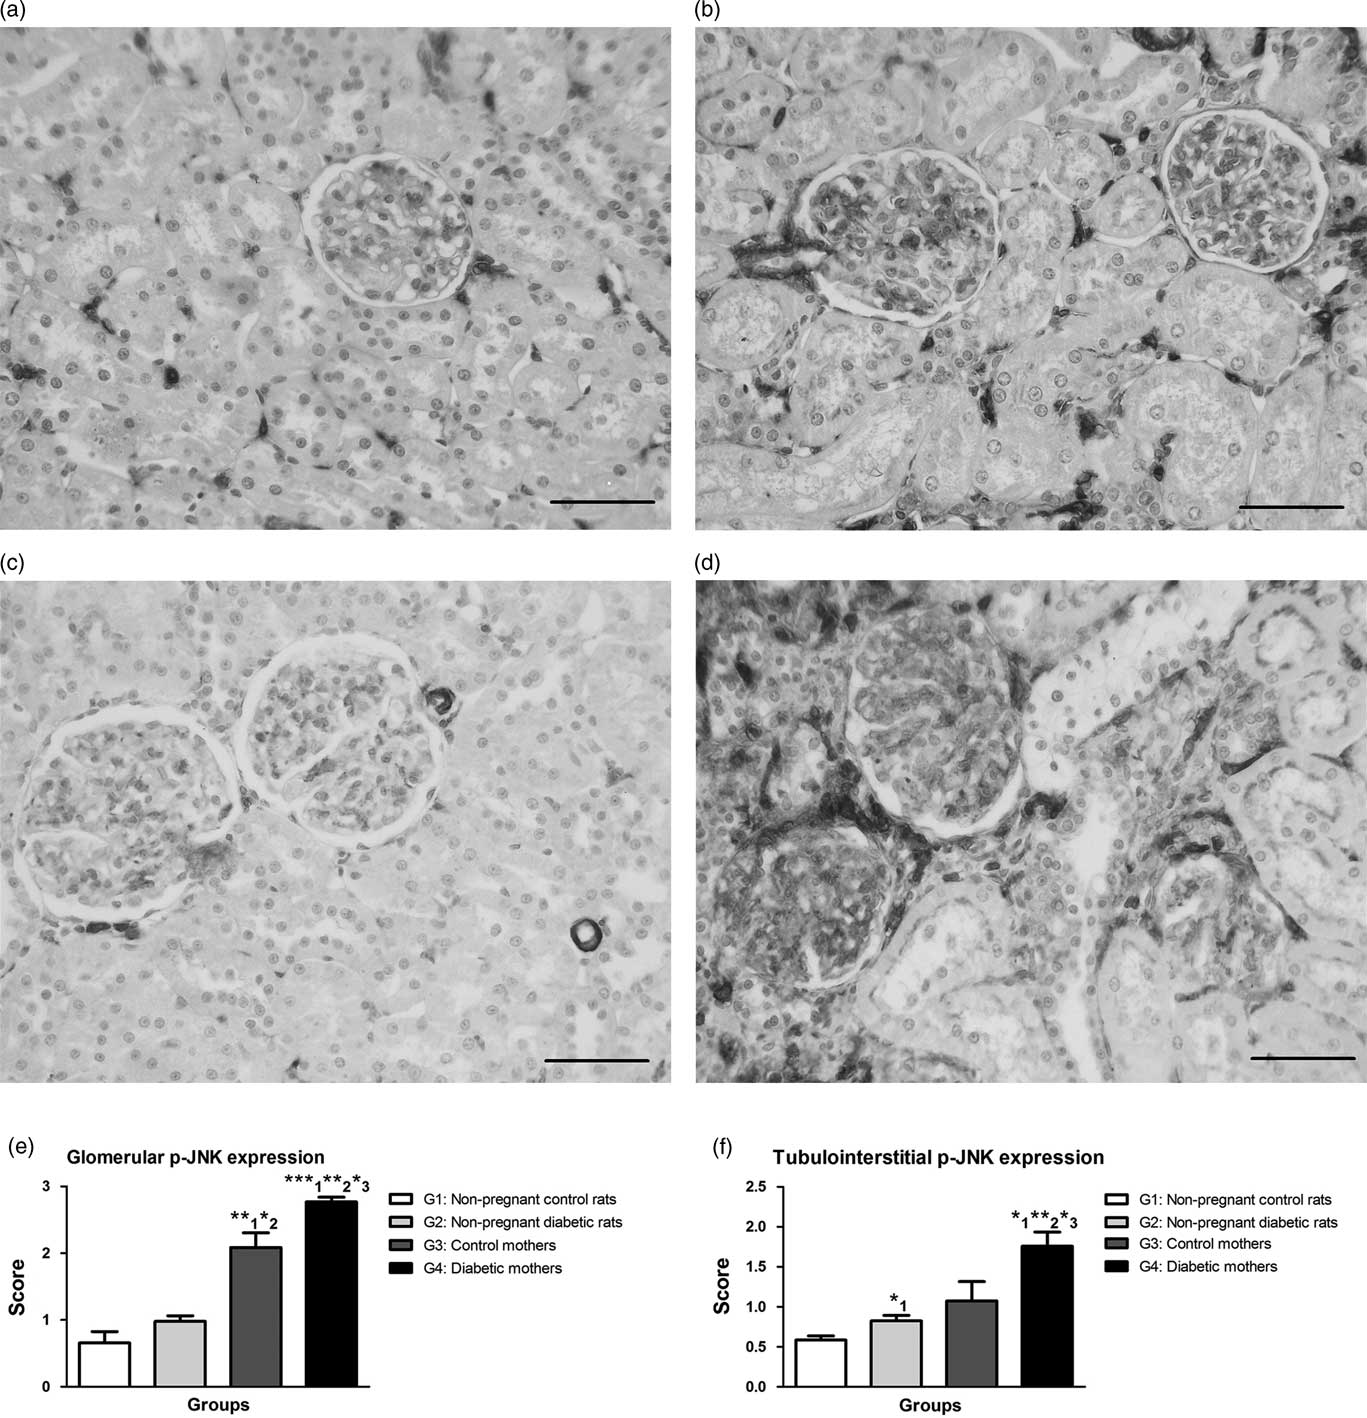
The data from p-JNK imunohistochemistry revealed increased glomerular expression of this MAPK in G3 (2.09±0.22) when compared with G1 (0.65±0.17) and G2 (0.98±0.08). In addition, G4 (2.76±0.07) showed higher expression of p-JNK when compared with other groups (Fig. 6e). The p-JNK TBI expression showed a significant increase on the expression of G2 (0.82±0.07) when compared with G1 (0.58±0.05), as well as G4 (1.75±0.17) showed a significant increase of p-JNK TBI compared with groups G1, G2 and G3 (1.75±0.17) (Fig. 6f).
Immunostaining for p-JNK in the renal cortex. G1 (non-pregnant control rats) (a), G2 (non-pregnant diabetic rats) (b), G3 (control mothers) (c) and G4 (diabetic mothers (d). Glomerular (e) and tubulointerstitial (f) p-JNK expression in the renal cortex. Data are expressed as mean±s.e.m.; **1 P<0.01 (v. non-pregnant control rats: G1); *2 P<0.05 (v. non-pregnant diabetic rats: G2); ***1 P<0.001 (v. non-pregnant control rats: G1); **2 P<0.01 (v. non-pregnant diabetic rats: G2); *3 P<0.05 (v. control mothers: G3); *1 P<0.05 (v. non-pregnant control rats). Scale bar=50 μm.

Discussion
RAAS is one of the mediators of renal damage resulting from diabetes and has also increased activity during pregnancy. Thus, our results showed a tendency to a decrease in GFR in G4 compared with all other groups, showing that pregnancy associated with type 1 DM results in a loss of renal function for mothers in the postpartum period when compared with the isolated conditions of diabetes (G2) and pregnancy (G3). Literature data show that a pregnancy without complications in diabetic women who have normal renal function does not increase the risk of developing nephropathy,Reference Miodovnik, Rosenn and Khoury 20 but the glomerular filtration may decrease more rapidly in those pregnant women with chronic renal failure or proteinuria.Reference Biesenbach, Stoger and Zazgornik 21 In general, after delivery, renal function and blood pressure return to pre-pregnancy levels.Reference Golbert and Campos 22
In this study, the blood pressure of the rats from all groups was measured by plethysmography, but there were no significant differences observed between them, showing that, in this experimental model, with the method used and the disease duration, the association between pregnancy and diabetes did not interfere with this postpartum cardiovascular parameter. However, we cannot disregard the possibility of these mothers having suffered SBP changes during pregnancy, considering the important mortality shown by G4 rats, although we did not perform that analysis. PE is a complication of pregnancy that causes short- and long-term morbidity and eclampsia is potentially lethal for both pregnant women and newborns. The pathogenesis of PE/eclampsia remains unknown as a multifactorial diseaseReference Valenzuela 23 and the kidneys are usually the first and most severely affected organ;Reference Han, Yang and Li 24 therefore, this organ deserves particular attention because of its physiological importance and the pathological changes during gestation.
Pregnancy resulted in no change in the kidney weight/body weight ratio of G3 rats in the postpartum period when compared with non-pregnant controls (G1), but this ratio was higher in G4. According to the studies by van Dijk et al., the body weight of diabetic rats not treated with insulin during and after pregnancy was lower than that of the controls, while the blood glucose concentration and kidney weight were higher. Diabetic rats that were treated showed a similar body weight to the controls but the kidney weight was lower than that observed in untreated diabetic rats after delivery.Reference van Dijk, Boner and Giler 25
Although it did not cause changes in the weight of the kidneys in G3 rats, pregnancy was able to change the total renal sectional area of these animals about 50 days after delivery when compared with G1. However, despite the higher renal weight, diabetic rats in the postpartum period (G4) showed lower renal sectional area compared with control mothers (G3) in the same period. There was no difference in terms of glomerular and capsular space areas between the groups. However, G3 and G4 showed an increased glomerular tuft area compared with G1 and G2, showing that the pregnancy might have interfered with this parameter. It has been found that pregnant women have increased GFR by about 50%, mainly due to increased RPF.Reference Milne, Lindheimer and Davison 2 However, our data showed that pregnancy, when associated with diabetes, results in relatively impaired renal function for mothers in the postpartum period, although the area available for filtration (higher tuft glomerular area in G4) can be increased, showing that filtration was affected despite the renal structural compensation/adjustment.
Immunohistochemical studies for proliferating cells showed that pregnancy (G3) may result in increased PCNA+ glomerular cell expression in relation to G1, but when it is associated with DM (G4) there was reduction of PCNA positive cells. Silveira et al. also observed a reduction of glomerular proliferating cells in diabetic spontaneously hypertensive rats (SHR) rats compared with SHR controls.Reference Silveira, Bacchi and Pinto 26 Therefore, in this study, a reduction in glomerular cell proliferation may be attributed to variations in SBP that may have occurred during pregnancy in diabetic rats, as mothers with these conditions are more likely to have increased SBP.Reference Galindo, Burguillo and Azriel 13 , Reference Remsberg, McKeown and McFarland 14 In the TBI compartment, pregnancy resulted in an increase in proliferating cells, while the association between diabetes and pregnancy (G4) increased this number more significantly compared with all other conditions (G1, G2 and G3). Maeda et al., using spontaneously diabetic mice, indicated that diabetic nephropathy is associated with renal hypertrophy. There was an increase in diameter of the glomeruli in the early stages of diabetes and the mice showed mesangial expansion and thickening of the glomerular basement membrane on the 40th day of disease. This suggests that the glomeruli of mice are relatively resistant during the acute phase of DM, although the lesions start from the earliest stages.Reference Maeda, Yabuki and Suzuki 27
Immunoreaction for α-SMA showed no difference between the control groups (G1 and G3) studied, indicating that pregnancy, in this case, did not affect the expression of α-SMA. However, the diabetic groups (G2 and G4) showed higher expression of glomerular and TBI α-SMA, with statistical significance in G4. The data obtained for the labeling of this cytoskeletal protein demonstrated that the association between diabetes and pregnancy resulted in increased renal cortical expression of α-SMA compared with the isolated condition of diabetes. This increase may indicate an over-activation of mesangial cells and/or fibroblasts, which are potentially able to proliferate and produce more collagen and other extracellular matrix (ECM) components. In some pathological conditions, the expression of this protein can increase in the renal cortex and this increase has been associated with the progression of renal disease.Reference Alpers, Seifert and Hudkins 28 – Reference Naruse, Fujieda and Miyazaki 32 Myofibroblasts are well known to be the main type of cell responsible for the synthesis of ECM and fibrosis development.Reference Gabbiani 33 The myofibroblast differentiation is one of the early cellular events leading to the development of fibrosis in organs.Reference Gabbiani 33 , Reference Tang, Ulich and Lacey 34 These cells appear to actively participate in tissue repair and production of the ECM, which reduces the surface area for filtration in the kidneys. Myofibroblast interstitial infiltration was strongly correlated with prognosis in many glomerular diseases and it was shown that the interstitial α-SMA expression is a marker of early membranous nephropathy.Reference Darby, Skalli and Gabbiani 35
The quantification of cortical collagen by Picrosirius Red staining showed that pregnancy did not result in any changes in the renal cortical deposition of collagen, when controls with (G3) and without (G1) pregnancy are compared. However, diabetes resulted in an increase of collagen in the renal cortex of G2 and G4 rats compared with their respective controls (G1 and G3). Importantly, these rats also had higher α-SMA expression. Thus, the association between diabetes and pregnancy (G4) did not alter the expression of collagen, but altered α-SMA expression, compared with the isolated condition of diabetes (G2). The phenotypic change that can pass mesangial cells plays an important role in ECM accumulation in diabetic nephropathy and was observed in the early stages of diabetes by promoting the progression of interstitial fibrosis and glomerulosclerosis.Reference Makino, Kashihara and Sugiyama 30 , Reference Li, Qu and Bertram 36 – Reference Young, Johnson and Alpers 39
In the present study, although there was a decrease of PCNA+ cells in the glomeruli of G4, there was an increase in tubular cell proliferation, concomitant with increased α-SMA expression. These data corroborate with the studies of Geleilete et al., which showed patients with idiopathic focal segmental glomerulosclerosis, where the expression of α-SMA TBI was correlated with the expression of PCNA TBI; these changes were probably induced by cytokines such as TGF-β, PDGF, endothelin and angiotensin II.Reference Geleilete, Costa and Dantas 40 Johnson and coworkers showed that the renal cortex of rats with glomerulonephritis contained proliferating cells which co-express α-SMA.Reference Johnson, Iida and Alpers 29
The immunoreactivity for p-p38 revealed that pregnancy increases the expression of this MAPK in glomeruli from control mothers (G3) when compared with G1. Diabetes has also increased the expression of p-p38 in non-pregnant diabetic rats (G2), but the association between diabetes and pregnancy (G4) caused a reduction in the expression of p-p38+ glomerular cells compared with control mothers (G3) and diabetic rats (G2). It is important to remember that the same change was observed in the immunoreactivity to PCNA, that this association also reduced the number of glomerular proliferating cells, suggesting a relationship between p-p38 and proliferation. From an experimental model of diabetes induced by STZ using adult Wistar rats, Komers et al. found overexpression of p-p38 in the distal tubules and glomeruli in the early and late stages of diabetic nephropathy, which was decreased by treatment with insulin and metabolic control.Reference Komers, Lindsley and Oyama 41 It has been shown that inhibition of p-p38 in renal autoimmune diseases reduces severity of the disease.Reference Iwata, Wada and Furuichi 42 The blocking of the p38 pathway significantly reduced the acute renal failure, as well as proteinuria, suggesting a new therapeutic strategy for the treatment of acute renal inflammation.Reference Cassidy, Radford and Slyne 43
Immunohistochemical studies for MAPK p-JNK showed that pregnancy (G3) increased glomerular expression of this MAPK compared with non-pregnant control rats (G1), but when associated with diabetes (G4), the expression of p-JNK was even greater. The TBI p-JNK expression revealed that diabetes (G2 and G4) increases the expression of p-JNK with a further increase when combined with pregnancy (G4). The literature shows that administration of JNK inhibitors before ischemia/reperfusion prevents the tubular damage and renal dysfunction, suggesting a role for JNK activation in both cell rejection and in acute tubular necrosis.Reference Kanellis, Ma and Kandane-Rathnayake 44 Thus, our data indicate that renal damage observed in diabetic mothers (G4) can also be related to the over activation of this MAPK signaling pathway.
Although many studies of type 1 DM and its consequences have been performed, the literature is still scarce about the renal disorders that can affect women with diabetes that develops during pregnancy and is maintained in the postpartum period. In conclusion, type 1 DM induced during pregnancy and maintained in the postpartum period causes cortical hypertrophy associated with the activation of fibroblasts/myofibroblasts, which increases the deposition of ECM proteins, mainly collagen, thereby damaging the GFR. These changes may be mediated, at least in part, by the MAPK cascade.
Acknowledgments
The authors are grateful to the Federal University of Uberlândia (UFU), which allowed the development of this work. Authors’ Contributions: A. P. C. Balbi designed the research; N. França-Silva, N. G. Reis and P. F. Santos performed the research; A. P. C. Balbi and N. França-Silva analyzed the data; A. P. C. Balbi and N. França-Silva wrote the paper. All authors read and approved the final manuscript.
Financial Support
This research did not receive any specific grant from any funding agency in the public, commercial or not-for-profit sector.
Conflicts of Interest
None.
Ethical Standards
The authors assert that all procedures contributing to this work comply with the ethical standards of relevant national guides on the care and use of laboratory animals and has been approved by the institutional committee of Federal University of Uberlândia (056/14).