
I. INTRODUCTION
Emerging societal trends need advanced materials and components to improve transmission, delivery, and monitoring of electrical power. Trends include: (i) a need for modernization of an aging transmission and distribution system, Reference Hefner1 (ii) increasing penetration of distributed generation sources (e.g., renewables) and grid-scale energy storage, Reference Ram2 and (iii) electrification of commercial and military transportation systems (automotive, aviation, aerospace). Reference Brown, Kascak, Ebihara, Johnson, Choi, Stebert and Buccieri3 The U.S. Department of Energy (USDOE) projects 80% of all electrical power to flow through power electronics by 2030 and grid modernization will require a $1.5 trillion investment over the next decade. 4 Advances in wide band gap (WBG) based semiconductor based switching devices promise to advance high power, high frequency power electronic converters to address evolving energy needs. Systems issues for WBG-based power electronic deployment include advanced passive components (inductors, capacitors) for filtering and galvanic isolation. Reference Shen, Wang, Boroyevich and Tipton5 An enabling technology is high performance soft magnetic materials for inductive applications. Reference McHenry, Willard and Laughlin6–Reference Willard and Daniil8 Novel processing for tunable permeability in alloys to retain robust high temperature and high frequency performance can advance a broad array of WBG-based power converters. Similar materials with tunable permeability enable power monitoring based on giant magneto-impedance (GMI) based sensing Reference Kurniawan, Roy, Panda, Greve and Ohodnicki9,Reference Kurniawan, Roy, Panda, Greve, Ohodnicki and McHenry10 compatible with surface acoustic wave devices for passive and wireless interrogation.
Useful inductors supply constant inductance over a range of current, with temperature rise controlled by low power losses and/or active cooling. A figure of merit is the efficiency of inductive energy storage:
 $$Q = {{\omega L} \over R}\quad ,$$
where Q is the quality factor, L is the inductance, ω is the angular frequency, and R is the equivalent series resistance. The corresponding energy storage E for a magnetic core is:
 $$E = {{BHV} \over 2} = {{{B^2}V} \over {2{\mu _0}{\mu _{\rm{r}}}}}\quad ,$$
where B is flux density, V is core volume, µr is relative permeability, and µ0 the permeability of free space. For applications requiring constant inductance over a range of currents, core materials with constant µr to flux saturation is desired. Cores with tunable permeability materials can be engineered to have lower µr allowing higher energy storage for the same B, or lower B (lower core loss) for the same energy storage. Low permeability inductors allow for higher currents that are required, for example, in certain DC bias applications. However, for fixed inductance applications permeability is inversely proportional to core size, if the number of turns is held constant. The optimal wound core minimizes the total power loss including core and winding losses. To a first approximation, core loss at a given frequency is expressed as P C = kVB 2 where k is a material constant and winding loss as P L = I 2 R where R is the winding resistance. For a toroid of path length l with N turns, the magnetic field is H = μNI/l and total power loss, at fixed f, is:
 $${P_{\rm{T}}} = kV{\mu ^2}{H^2} + {\left( {{l \over {N\mu }}} \right)^2}R{H^2}\quad ,$$
where H represents a nonsaturating maximum field. Solving for
 ${{\partial {P_{\rm{T}}}} \over {\partial \mu }} = 0$
yields a minimum at
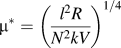 ${\mu ^*} = \left({{{l^2}R} \over {{N^2}kV}}\right)^{1/4}$
so the optimum permeability depends on both the material properties and the configuration/size of the core. This effectively balances the reduction of core losses, that favor a low µ and winding losses that favor a high µ.
Low permeability cores can be made of gapped or powdered high permeability materials but powder cores size is limited up to ∼20 cm diameter due to large compaction pressures [e.g., cores of 20.3 cm OD and 12.7 cm ID for 2.2 GPa compaction pressure require 44.6 MN (5000 ton) force presses]. Gapped cores can suffer from higher core loss and EMI/RFI radiation due to fringing flux and low thermal conductivity to remove heat generated by losses. Developing cores that do not require gapping or pressing would be a significant breakthrough in inductor design. Functional materials with stress-dependent magnetic anisotropy tunable to achieve low permeability with low losses are attractive in inductive applications. Thus, understanding stress-dependent magnetic properties that dictate anisotropy is important. Materials with temperature invariant permeabilities can also mitigate needs for active cooling at the converter and component level.
This work reviews the development of magnetic materials for gapless inductor application with an emphasis on metal amorphous nanocomposites (MANCs) because of their combination of large saturation inductions, low AC power losses approaching the 100's of kHz, and large induced magnetic anisotropies. Permeability can be tuned by inducing magnetic anisotropy perpendicular to the core magnetizing direction (i.e., transverse magnetic anisotropy). Although transverse magnetic field annealing is commonly utilized, scalability to large cores may be limited as the magnetic annealing furnaces must accommodate the core dimensions. Another option that is fully compatible with continuous ribbon processing and removes restrictions on maximum core size is annealing ribbon under stress using a tension controlled system. Induced anisotropy by field and stress annealing is strongly dependent on the composition and microstructure of the magnetic material.
Tailoring induced uniaxial anisotropy (K u) in MANC magnets by mechanical stress Reference Kernion, Ohodnicki, Grossmann, Leary, Shen, Keylin, Huth, Horwath, Lucas and McHenry11 and field processing Reference Ohodnicki, Long, Laughlin, McHenry, Keylin and Huth12,Reference Ohodnicki, Laughlin, McHenry, Keylin and Huth13 can enable high frequency (f), low loss rotational switching. Reference Leary, Ohodnicki and McHenry14 In Zr containing Co-rich MANCs, K u near 20 kJ/m3 (anisotropy field H K ∼ 500 Oe) can develop after stress annealing that is 10× larger than field induced K u's Reference Kernion, Ohodnicki, Grossmann, Leary, Shen, Keylin, Huth, Horwath, Lucas and McHenry11,Reference Ohodnicki, Long, Laughlin, McHenry, Keylin and Huth12 in similar compositions. K u response to stress in Co-rich alloys is twice that measured in Fe-rich MANCs Reference Kernion, Ohodnicki, Grossmann, Leary, Shen, Keylin, Huth, Horwath, Lucas and McHenry11 and annealed ribbons also show better mechanical properties. Reference Daniil, Ohodnicki, Mchenry and Willard15,Reference Heil, Wahl, Lewis, Mattison and Willard16 Power loss at high frequency in MANCs is minimized due to thin cross sections achieved through planar flow casting, resistivity levels higher than bulk crystalline soft magnetic materials, and potentially by K u controlled magnetic reversal. MANC's, composite resistivity Reference DeGeorge, Shen, Ohodnicki, Andio and McHenry17 results from amorphous and nanocrystalline phase and interfacial scattering. Stress induced anisotropy in Co-rich, Nb based MANCs has been attributed to low symmetry sites for magnetic atoms in faulted Co nanocrystals. Reference Leary, Keylin, Ohodnicki and McHenry18
II. SUBSTITUENT VIRTUAL BOUND STATES (VBS) IN CO-RICH CRYSTAL AND AMORPHOUS ALLOYS
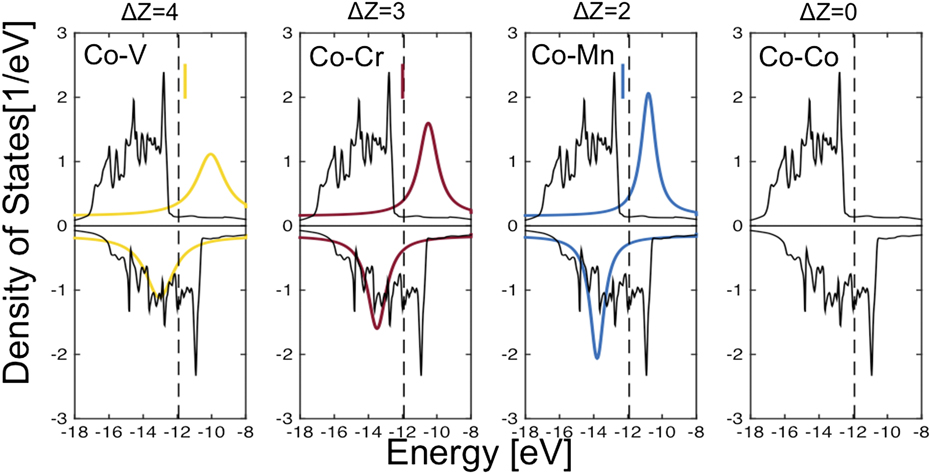
Common to Fe- and Co-based MANC systems is the addition of early transition metal glass formers (TEs) that are expelled from crystals in primary crystallization and serve as growth inhibitors Reference McHenry, Willard and Laughlin6 that contribute to robust metastable nanostructures. For dilute TE additions, introducing a highly localized perturbing potential, Friedel's virtual bound state (VBS) Reference Friedel19 model explains departure from a linear composition dependence (for species with a valence electron difference |ΔZ| > 1) of alloy dipole moment in a rigid-band Slater–Pauling curve. Reference Slater20,Reference Pauling21 A modified impurity VBS model describes changes as a TE bound d-state moves through the Fermi level (εF) of the parent late magnetic transition metal (TL) and empties into empty spin states. Reference Mchenry and Laughlin22 For each TE solute atom, a degenerate TE VBS will empty into unoccupied TL 3d states. We note three features of the band structure of early 3d impurities in the Co host described in the literature Reference Anisimov, Antropov, Lichtenstein, Gubanov and Postnikov23,Reference Stepanyuk, Zeller, Dederichs and Mertig24 : (i) the impurity 3d bands are spin split anti-parallel to those of the host, (ii) the minority bands exhibit more d–d hybridization due to their overlap in energy than the majority bands which (iii) form more conventional resonance states. These features are shown schematically in Fig. 1.
Dilute TE's form VBS that shift in size and position with impurity and concentration influencing electronic structure and Fermi level, εF. Away from Co majority band states (>εF) VBS take Lorentzian shape. Impurity states empty into the conduction band when impurity and host states are close in energy (minority band near εF). Adapted from Ref. Reference Anisimov, Antropov, Lichtenstein, Gubanov and Postnikov23.
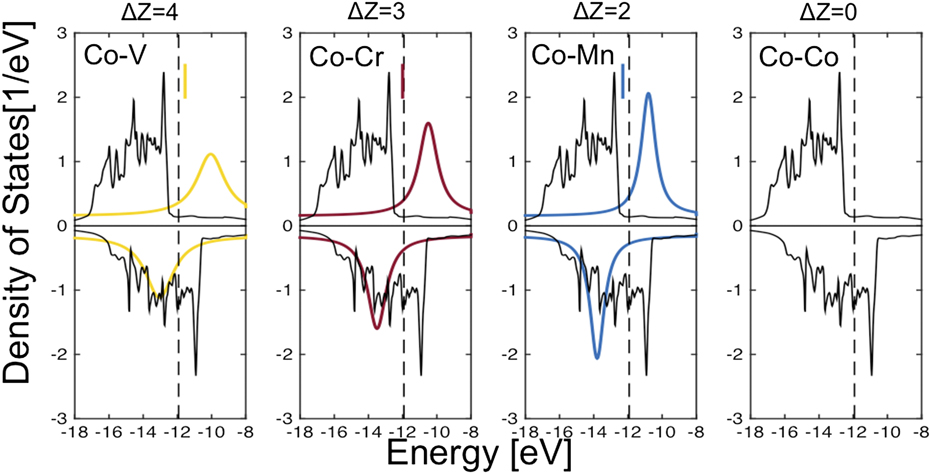
The influence of VBS on alloy magnetization is described in coordination bonding Reference Corb and O'Handley25 and magnetic valence formalisms Reference Malozemoff, Williams and Moruzzi26 with predicted concentration dependences of the average magnetic dipole moment. Reference Ghemawat, McHenry and O'Handley27 Other implications of a strongly perturbing VBS potential of an impurity are (i) strong scattering of the conduction electrons off of resonant TE d-states and consequent increased resistivity; (ii) lowering of the local crystal field symmetry with consequence for magnetic anisotropy and (iii) hybrid d–d bonding can impact materials strength and interfacial energies. Reference Ramalingum, van Ek, MacLaren and McHenry28 These all impact performance of MANCs for application in inductive components; (i) and (ii) in reducing power losses and (iii) in mechanical properties. VBS have been calculated by first principles in close packed Co phases. Reference Anisimov, Antropov, Lichtenstein, Gubanov and Postnikov23,Reference Stepanyuk, Zeller, Dederichs and Mertig24 Figure 1 illustrates the spin-minority and -majority bands for an FCC Co host from Ref. Reference Stepanyuk, Zeller, Dederichs and Mertig24 and the added position of Lorentzian shaped VBS for Mn, Cr, and V substituents. Models of the VBS are schematic because of lack of a precise model for the amorphous phase density of states.
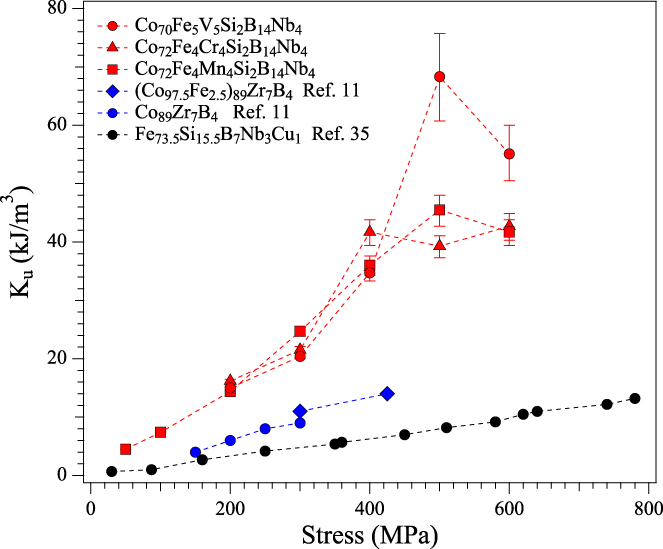
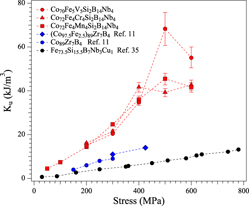
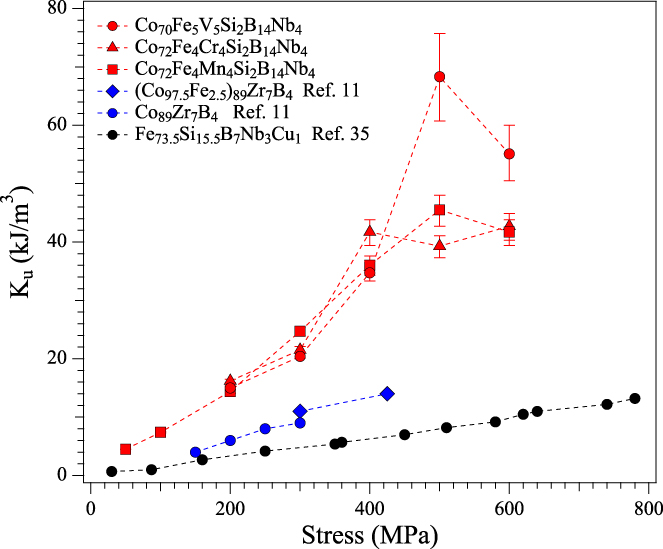
A key figure of merit, stress induced magnetic anisotropy, in: Co80−x−y Fe x Mn y Nb4Si2B14 and Co80−x−y Fe x V y Nb4Si2B14 (x and y ≤ 8 at.%) nanocomposites is summarized in Fig. 2 and compared with previously published values for Co- and Fe-based nanocomposites. Reference Kernion, Ohodnicki, Grossmann, Leary, Shen, Keylin, Huth, Horwath, Lucas and McHenry11 Figure 2 also compares a Co80−x−y Fe x Cr y Nb4Si2B14 alloy not discussed here for brevity. Alloys are patterned after Co-rich Zr containing amorphous and MANCs with Co:Fe ratios falling in the BCC + FCC, or FCC + HCP regions of the binary Fe–Co phase diagram. Reference Ohodnicki, Keylin, McWilliams, Laughlin and McHenry29 MANC primary crystallization results in chemical partitioning between amorphous and nanocrystalline phases. Reference Hsiao, McHenry, Laughlin, Kramer, Ashe and Ohkubo30 Strong exchange increases the Curie temperature (T C), Reference MacLaren, Schulthess, Butler, Sutton and McHenry31 yields a higher magnetization, and improves high temperature coupling through the intergranular matrix. Reference Ping, Wu, Hono, Willard, Laughlin and McHenry32 This impacts temperature stability of induced magnetic anisotropy, and by inference permeability, that scales as a power of reduced magnetization, M(T). Reference Zener33,Reference Callen and Callen34 Field-induced anisotropy due to directional pair ordering is easily erased by short-range diffusion, and does not have desirable temperature dependence for high temperature magnets. Reference Ohodnicki, Laughlin, McHenry, Keylin and Huth13 Temperature dependences of the magnetostriction or residual stress also degrade high temperature performance of materials with magnetoelastic induced anisotropies. Reference Herzer, Budinsky and Polak35 Interfacial anisotropy, stacking faults in FCC α- or HCP ε-Co and nanocrystals/amorphous matrix interfaces require coordinated atomic rearrangement to remove. Larger activation volumes therefore stabilize structural anisotropies to higher temperatures. The magnitude, tunability, and temperature stability of stress induced magnetic anisotropy is desirable for inductive applications.
Magnitude of induced anisotropy |K u| of stress annealed Fe-based, Co-based and Co-rich alloys with VBS.
While Hf, Reference Iwanabe, Lu, McHenry and Laughlin36 Zr, Reference Willard, Laughlin, McHenry, Thoma, Sickafus, Cross and Harris37 and Ta Reference Lucas, Bourne, Sheets, Brunke, Alexander, Shank, Michel, Semiatin, Horwath and Turgut38 have been investigated, Nb is chosen as a large atom TE growth inhibitor, that also provides interfacial scattering states, with a lower oxidation potential allowing casting of alloys in air. Co–Fe is a prototype Slater–Pauling system and alloys at the Co-rich end of the binary have minority spin states at εF. Substitution of Mn (ΔZ = 2), Cr (ΔZ = 3), and V (ΔZ = 4) provides VBSs in addition to those provided by Nb. Smaller Mn, Cr, or V TE's, are likely to partition differently than Nb in nanocrystallization and to the extent that they remain dissolved in the crystalline phase, they (i) provide resonant scattering in the crystals and (ii) influence crystal stacking fault energies (SFE) that impact crystal anisotropy and mechanical properties. Co-rich systems exhibit record stress annealing induced anisotropy Reference Kernion, Ohodnicki, Grossmann, Leary, Shen, Keylin, Huth, Horwath, Lucas and McHenry11 and changes to anisotropy and systematic variation of amorphous and nanocrystalline phase resistivity with VBS introduction is the subject of this work. Targeted alloys have low permeability, high K u, low power loss, and excellent thermal stability. Reference Leary, Ohodnicki, McHenry, Keylin, Huth and Kernion39
III. EXPERIMENTAL PROCEDURE
Ingots of nominal compositions Co80−x−y Fe x Mn y Nb4Si2B14, and Co80−x−y Fe x V y Nb4Si2B14, where x and y ≤ 8 at.%, were prepared from high purity elements by arc melting. These alloys are chosen to have identical concentrations of metalloid glass formers (Si2B14) and a TE growth inhibitor (Nb4). In the first system the small atom TE, Mn, is substituted with various relative concentrations of Fe in the Co-based alloy. In the second system V, is substituted. Amorphous ribbons of 2–3 mm width and 20 µm thick were produced by melt spinning in argon. A nanocomposite was formed by stress annealing the amorphous ribbon at 520 °C in air at a temperature and time sufficient for primary crystallization. Tensile stress was applied along the free ends of ribbon with the central section passing through a tube furnace. Ribbon sections were also annealed in the tube furnace with minimum applied tension (<10 MPa) and subsequently stress annealed. TEM measurements were performed on a JEOL JEM-2000EX (JEOL USA Inc., Peabody, Massachusetts) and a Titan 80-300 (FEI Company, Hillsboro, Oregon), aberration corrected microscope with STEM capabilities that indicate nanocrystals <10 nm. TEM samples were prepared using a Gatan Precision Ion Polishing machine (Gatan, Inc., Pleasanton, California).
Induced anisotropy (K u) was calculated from saturation magnetization B s and permeability µ using a single strip tester attachment to a Laboratorio Elettrofisico AMH 50 K-S permeameter (Laboratori Elettrofisico, Milan, Italy) and the relation K u = B s 2/2µ. Permeability and K u were measured by subtracting measurements of the fixture with and without a sample using 400 Hz sinusoidal excitation. Saturation magnetostriction λs of stress annealed samples with sheared BH loops was measured using relation λs = −(3/2)(∆K u/∆σ), assuming a linear permeability to saturation. Susceptibility was measured to fields of 8 kA/m and stress (σ) of 600 MPa. Electrical resistance was measured using 4 point probe method with EXTECH 380560 Milliohm Meter (FLIR Commercial Systems, Inc., Nashua, New Hampshire). Composition mapping was measured using atom probe tomography (APT) of a Co75.4Fe2.3Mn2.3Nb4Si2B14 sample annealed with and without stress. Needle specimens were prepared by FIB-based lift-out and annular milling. Reference Tan, Vollin and Cuk41 APT was conducted on a CAMECA LEAP 4000XHR (CAMECA, Gennevilliers, France) in voltage mode with 25% pulse fraction at 40 K.
IV. RESULTS AND DISCUSSION
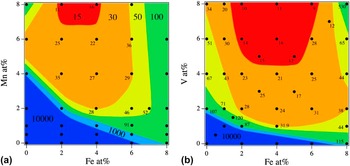
Figure 3(a) shows contours of constant magnetic permeability for Co80−x−y Fe x Mn y Nb4Si2B14 alloys after stress annealing under 200 MPa tensile stress at 520 °C. The B–H loop type strongly depends on Fe and Mn content, with flat loop shape and low permeability for compositions above the line Fe0Mn4–Fe8Mn0 and square loops below. The lowest permeabilities were found near Fe3Mn8. Compositions near Fe4Mn4 were annealed at stresses up to 600 MPa, to determine the functional dependence of permeability on stress (Fig. 1). The Fe4Mn4 alloy after 500 MPa stress annealing had µr = 8.7 and induced anisotropy K u = 45.5 kJ/m3. Stress annealing compositions with dilute Fe, Mn content resulted in square loop, high permeability (>10,000) materials with low coercivity H c = 23.1 A/m at B = 1 T, 1 kHz measured on a toroidal sample. Accurate measurement of H c for low loss, low permeability materials require phase angle correction Reference Tan, Vollin and Cuk41,Reference Hou, Mu, Lee and Li42 that will be the subject of future work along with frequency and induction dependencies of μ and losses. The boundary region separating the high and low permeability materials in Fig. 3(a) represents materials with initial permeability ∼1000. The slope of the boundary intercepting the Mn = 0 composition is higher than the boundary slope intercepting at Fe = 0. Further experimentation is required to better define the shape of this region that separates regions with K u < 0 and K u > 0 following stress annealing.
(a) Isopermeability surfaces for of Co80−x−y Fe x Mn y Nb4Si2B14 alloys annealed at 520 °C at a 200 MPa stress (b) permeability of similarly stress annealed Co80−x−y Fe x V y Nb4Si2B14 alloys.

Both Co-rich crystalline and amorphous phases are strong ferromagnets with εF lying in the minority spin d-band. Reference Corb and O'Handley25,Reference Corb, O'Handley and Grant43,Reference O'Handley44 Thus, Fe substitutions rob from the minority states in both, by moving εF to lower energies consistent with Slater–Pauling curve and amorphous phase Slater–Pauling curve. Reference O'Handley44 Substitution of Mn (ΔZ = 2) provides VBS's in addition to those provided by Nb. Mn is a FCC α-stabilizer with substantial solubility in α-Co. Reference Massalski, Okamoto, Subramanian and Kacprzak45 For annealing treatments at 520 °C, the thermodynamic equilibrium crystalline phase is FCC in pure Co, though nanostructures are typically heavily faulted. Reference Leary, Keylin, Ohodnicki and McHenry18,Reference Ohodnicki, Qin, Laughlin, McHenry, Kodzuka, Ohkubo, Hono and Willard46–Reference Zhu, Liao and Wu48 The SFE is equal to the differences in bulk free energies between the FCC and HCP structures and in magnetic materials the magnetic interface energy significantly contributes to SFE. Reference Ishida49 Planar fault densities are a strong function of solute concentration and SFEs are also sensitive to alloying and partitioning. Estimates of the SFE requires the interaction parameters between the FCC, α, and HCP, ε, phases as a function of solute composition, that are difficult to quantitatively assess in nanostructures.
The alloy compositions Co80−x−y Fe x V y Nb4Si2B14 with V additions were annealed under stresses 100–600 MPa. The alloys have lower permeability [Fig. 3(b)] compared to the Co–Fe–Mn system. The alloy Fe5V5 after 500 MPa annealing exhibited a perfectly linear B–H loop, very low permeability µ = 3.0 at 8 kA/m, and the highest induced anisotropy K u = 69.3 kJ/m3. This induced anisotropy exceeds by a factor of ∼3.5× the previous highest reported values for stress annealed Co-based materials Reference Kernion, Ohodnicki, Grossmann, Leary, Shen, Keylin, Huth, Horwath, Lucas and McHenry11 but the 8 kA/m field was not sufficient to saturate the material. The error bars in Fig. 2 reflect the μr = ±0.5 variation in the K u measurement technique for low values of μr. The smaller permeabilities in the V-substituted system are consistent with its larger valence difference (ΔZ = 4) and consequently different VBS. From a materials processability perspective, lower applied stresses and improved mechanical properties make practical fabrication of low permeability stress annealed cores possible.
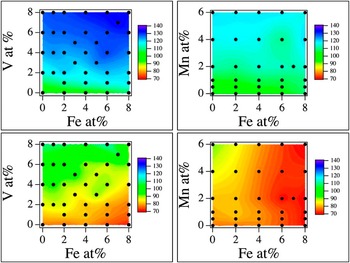
We observe a different influence of Fe and Mn additions on electrical resistance of as cast and stress annealed samples of the Co80−x−y Fe x Mn y Nb4Si2B14 alloys. In the as-cast material (Fig. 4 top), Mn and V additions affect resistivity more significantly than the Fe content. Fe in the stress annealed nanocomposites (Fig. 4 bottom) shows a stronger influence on the resistivity compared to the as-cast material. This effect is more pronounced in Co–Fe–Mn compared to Co–Fe–V compositions. Resistance in stress annealed samples was independent of the applied stress magnitude. The alloys with V, Co80−x−y Fe x V y Nb4Si2B14, have a significantly larger resistance in the amorphous state and after stress annealing as compared with similar Co80−x−y Fe x Mn y Nb4Si2B14 alloys. This demonstrates the role of VBS on scattering in the amorphous and stress annealed states with V (ΔZ = 4) exhibiting stronger scattering than Mn (ΔZ = 2). Fe with (ΔZ = 1) does not strongly influence scattering at dilute concentrations and chiefly changes the position of εF in rigid Co bands. These observations are consistent with well-established models for late transition metal disordered alloys where VBS states provide resonant scattering that increases with composition and ΔZ. Reference Anisimov, Antropov, Lichtenstein, Gubanov and Postnikov23,Reference Stepanyuk, Zeller, Dederichs and Mertig24 A recent two-band model Reference Shen, Ohodnicki, Kernion and Mchenry50 of the resistance of FeCo based amorphous alloys show resistivities to diminish significantly in Co-rich as compared with Fe-rich alloys. The additions of VBS elements, notably V, are seen to yield amorphous phase resistivities in Co-rich alloys comparable to those reported for Fe-rich alloys (∼140 μΩ-cm). After stress annealing, differences between predictions based on the average alloy composition are likely to result from differences in compositional partitioning of Mn and V between crystalline and amorphous phases. For this reason, compositional partitioning was investigated by APT.
Resistance of as-cast (top) and stress annealed (bottom) Co80−x−y Fe x V y Nb4Si2B14 and as-cast (top) and stress annealed (bottom) Co80−x−y Fe x Mn y Nb4Si2B14 alloys.

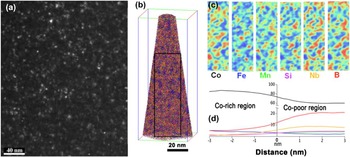
The maximum grain size of 10 nm in an annealed Co75.4Fe2.3Mn2.3Nb4Si2B14 alloy with and without stress was determined by TEM and APT. Figure 5(a) shows a dark field TEM image of a sample annealed without stress and corresponding APT results. Significant partitioning occurs during devitrification as evident in the ion map [Fig. 5(b)] and 2D composition maps plotted from the APT results [Fig. 5(c)] where red/blue areas have higher/lower compositions respectively for the indicated elements. The maps show the compositional partitioning in a 1 × 27 × 80 nm slab region in the APT result and indicate two distinct regions. Co-rich regions, often also enriched in Fe, likely corresponding to a crystalline phase and Co-poor regions enriched in Mn, Si, Nb, and B, correspond to the amorphous matrix. Volume fraction estimates from x-ray diffraction (XRD) were not possible due to large peak broadening,
Reference Leary, Keylin, Ohodnicki and McHenry18
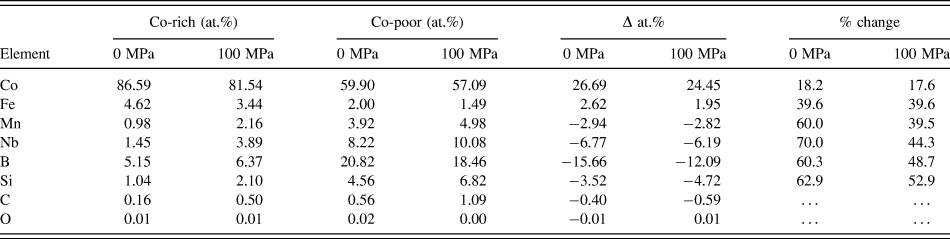
but appears to be ∼55% from APT. Figure 5(d) shows the concentration gradient across a Co-rich/poor interface estimated using a proximity histogram with concentrations listed in Table I. Mass balances from APT help to clarify partitioning.
Reference Degeorge, Devaraj, Keylin, Cui and Mchenry51
The Δ values are the difference between the Co-rich and Co-poor regions far from the interface and the relative percentage is calculated from the average elemental concentration, C
ave = (C
Co-rich + C
Co-poor)/2, as:
 ${{\left| {{C_{{\rm{Co - rich}}}} - {C_{{\rm{ave}}}}} \right|} \mathord{\left/ {\vphantom {{\left| {{C_{{\rm{Co - rich}}}} - {C_{{\rm{ave}}}}} \right|} {{C_{{\rm{ave}}}}}}} \right. \kern-\nulldelimiterspace} {{C_{{\rm{ave}}}}}}$
for the Co-rich and similarly for Co-poor regions. Dissolved VBS elements in the crystalline phase can alter SFE and increase resistivity. Fe is preferentially dissolved in the crystalline phase and while Mn partitions preferentially to the amorphous phase, a measurable amount remains in the crystals. Larger VBS concentrations in the matrix suggest importance for residual amorphous phase scattering after nanocrystallization. A residual amorphous phase reaches compositions near binary Co–Nb and Co–B eutectics,
Reference Massalski, Okamoto, Subramanian and Kacprzak45
likely approaching the condition for polymorphous secondary crystallization.
(a) Dark field TEM image (40k×) of annealed Co75.4Fe2.3Mn2.3Nb4Si2B14 and (b) ion map of the APT reconstruction. The position of 1 × 27 × 80 nm region used to plot 2D compositional maps is marked with a black rectangle. (c) 2D composition maps from APT results show partitioning of all elements. (d) Atomic concentration across a grain boundary estimated using proximity histogram.

Comparison of APT concentrations in Co-rich and Co-poor regions of Co75.4Fe2.3Mn2.3Nb4Si2B14 nanocomposites annealed without stress and 100 MPa.

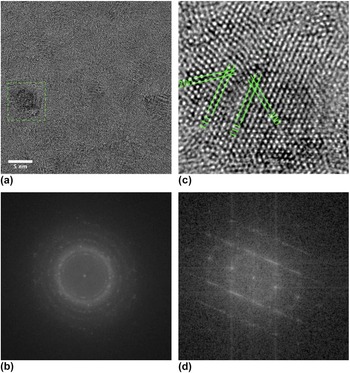
HRTEM of stress annealed (300 MPa, 520 °C) Co75.4Fe2.3Mn2.3Nb4Si2B14 shows close packed crystalline grains with evidence of stacking faults shown in Fig. 6. Figure 6(a) shows a bright field image illustrating the nanocrystalline grains and highlighting a single crystalline grain oriented near a zone axis. Figure 6(b) shows an electron diffraction pattern for the same. The main ring corresponds to close packed {111} planes in FCC Co. The inner ring matches {111} CoO spacing and may correspond to a surface oxide layer, however EELS showed less than 0.5% oxygen. Figure 6(c) shows a HRTEM image highlighting lattice fringes in the single oriented grain highlighted in Fig. 6(a) with FFT of these two crystalline regions shown in Fig. 6(d). Lattice fringes reveal a fault parallel to close packed planes between two FCC crystals with 〈110〉 type zones. FFTs of the individual regions (not shown) contain reflections with angle separations near 55 and 71° and close packed spacing to be ∼0.204 nm in agreement with XRD measurements. Reference Leary, Keylin, Ohodnicki and McHenry18 The presence of {200} fringes confirms FCC stacking within each region. The lattice parameter for the cubic structure is a = 0.354 nm with normals to the {200} planes of each region separated by 70°. The observed faults in the HRTEM images do not show clear preferential orientation with respect to the stress axis. Intensity lobing of the inner ring in Fig. 6(b) may arise from epitaxy between an oxide and underlying, faulted metallic structure or potentially from double diffraction. Reference Calbick and Marcus52 Evidence of planar faults, aligned with respect to the stress axis remains a subject of future work.
(a) BF image of a strain annealed Co75.4Fe2.3Mn2.3Nb4Si2B14 sample showing grain sizes of multiple crystals, and (b) electron diffraction pattern of the same, (c) HRTEM image highlighting lattice fringes in the region of a planar fault. (d) FFT of strain annealed Co75.4Fe2.3Mn2.3Nb4Si2B14 showing a planar fault. The fault occurs between two FCC grains (c).

A. Sources of induced anisotropy
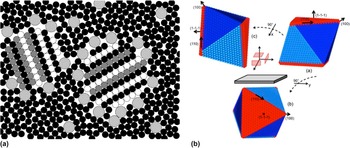
Figure 7(a) shows a cartoon illustrating features of the MANC nanostructures that may impact induced magnetic anisotropy. Building on prior nanostructural observations we show features specific to the Co-based MANCS. Co-based MANCs, have ostensibly <10 nm Co-rich grains embedded in a glass former enriched matrix and as nanocrystallization proceeds, crystalline regions displace free volume that accumulates in the matrix. A portion of this may remain trapped while some escapes the composite. The free volume fraction has not been quantified for Co-based MANCs and would make an interesting further study. However, we can make arguments based on typical concentrations in amorphous alloys on its role in induced anisotropy. Prevailing models have expelled large TE elements trapped at the nanocrystal/amorphous matrix interface and act as nanocrystal growth inhibitors. Reference Willard and Daniil8 The APT data above indicates that small TE elements are also expelled but perhaps more uniformly through the amorphous matrix, and with a small but significant amount still soluble in the nanocrystals. In Co75.4Fe2.3Mn2.3Nb4Si2B14, that crystallizes to form close packed nanocrystalline phases, considerable faulting in the nanocrystals has been observed. Reference Leary, Keylin, Ohodnicki and McHenry18 Dissolved TE elements in nanocrystals likely affect SFE, that depend on the density of states at the Fermi level. Reference Panin and Fadin53
(a) Features of the MANC nanostructures that may impact on the observed magnetic anisotropy (b) hypothetical equiaxed FCC crystal with an octahedral shape chosen to illustrating close packed (111) planes and orthogonal (111)[110] slip systems (slip planes with ribbon coordinate axis normals in red).

We now examine potential mechanisms for large induced anisotropies. Considering exchange coupling in random two phase magnets Reference Skomski and Coey54 the magnetic Helmholtz free energy is expressed as:
 $$F =\, \int {\left[ {A\left( {\vec r} \right){{\left( {{{\nabla {M_i}} \over {{M_0}\left( {\vec r} \right)}}} \right)}^2} - {K_1}\left( {\vec r} \right){{\left( {{{{M_i}{n_i}} \over {{M_0}\left( {\vec r} \right)}}} \right)}^2} - {\mu _0}{M_i}{H_i}} \right]} {\rm{d}}\vec r - {1 \over 2}\sum\limits_{i,j = 1}^3 {\int {{K_{ij}}\left( {\vec r - \vec r'} \right){M_i}\left( {\vec r} \right){M_j}\left( {\vec r'} \right){\rm{d}}\vec r{\rm{d}}\vec r'} } \quad ,$$
where
 $A\left( {\vec r} \right)$
is the exchange stiffness,
 ${K_1}\left( {\vec r} \right)$
is the first magnetocrystalline anisotropy constant of the nanocrystalline phase,
 ${M_i}\left( {\vec r} \right)$
defines the local magnetization compared to the saturation value Mo
,
 ${n_i}$
is the unit vector of the easy magnetization direction, and H
i
the external magnetic field. In the second term,
 ${K_{ij}}\left( {\vec r - \vec r'} \right)$
represents the nonlocal kernel of the magnetostatic dipole–dipole interaction with:
 $${K_{ij}}\left( {\vec r} \right) = {{{\mu _0}} \over {4\pi }}{{3{r_i}{r_j} - {\delta _{ij}}{r^2}} \over {{r^5}}}\quad .$$
Herzer's random magnetic anisotropy model (RAM), Reference Herzer55 in absence of a global magnetic anisotropy the first term in the integral averages random magnetocrystalline anisotropy over an exchange volume:
 $${V_{{\rm{ex}}}} = L_{{\rm{ex}}}^{\rm{3}} \sim {\left( {{A \over {{K_1}}}} \right)^{{3 \mathord{\left/ {\vphantom {3 2}} \right. \kern-\nulldelimiterspace} 2}}}\quad .$$
This yields an effective anisotropy, K eff, which scales as D 6, where D is the nanocrystalline grain diameter. The introduction of a uniaxial crystalline or induced anisotropy yields a K eff which scales as D 3. Reference Suzuki and Herzer56 In the RAM, an anisotropy field H K and the relative permeability are expressed as:
 $${H_{\rm{K}}} = \left( {{{2{K_{{\rm{eff}}}}} \over {{M_0}}}} \right)\quad \quad \mu = \left( {{{{M_0}} \over {{H_{\rm{K}}}}}} \right) = \left( {{{M_0^2} \over {2{K_{{\rm{eff}}}}}}} \right)\quad .$$
In the context of this work, the tunability of the relative permeability is then directly related to the microscopic mechanism for stress induced anisotropy which we now explore further.
In disordered two phase magnets, random stray fields may contribute to inhomogeneity in the demagnetization field as described in the second integrals in Eq. (4). These inhomogeneities in the stray field would only contribute to coercivity and losses if they become a sizable fraction of the exchange length. If much smaller, demagnetization effects may contribute to permeability reductions but not to losses. Two possibilities for contributions arising from nanocrystallization in a stress are:
-
(i) Spherical to ellipsoidal elongation of nanocrystals. For the Co-based material shown in Fig. 6, K u = 13.2 kJ/m3 or μr = 30 with ∼1 T induction. Shape anisotropy accounting for this would require prolate spheroid grains with at least 9% elongation (much larger in practice because of the finite reduced magnetization of the matrix). Since such grain elongation and texturing is not readily observed in stress annealed MANCs, this mechanism does not explain the tunability of permeability with stress annealing. Compositions with K u ∼ 50 kJ/m3 would require the long axis of the grain to be twice the short axis.
-
(ii) Distributed nano-sized gaps throughout the MANC. The nanocrystallization of an amorphous precursor is known to expel at most ∼2–3% free volume originally trapped in the amorphous state. A fraction of this free volume can be trapped at metal/amorphous interfaces, analogous to void nucleation at interfaces in crystalline solids. Reference Ohodnicki, Keylin, McWilliams, Laughlin and McHenry29 This can potentially yield a reduction in permeability like that observed in distributed gap powder cores. Gaps trapped near surfaces of nanograins would be too small to provide free pole pinning of domain walls as predicted by models of magnetostatic or strain pinning of inclusions (voids) in magnetic materials, Reference Becker and Doring57–Reference Kersten59 similar to exchange volume averaging of free poles. Voids would likely be anisotropically distributed after stress annealing, but a relatively small (<2%) volume fraction suggests that they would contribute much less than ∼200 Oe to a distributed gap saturating field (assuming they formed transverse cylindrical voids replacing material with 1 T induction). This is considerably smaller than the >1800 Oe anisotropy fields observed here and argues against voids accounting significantly to the magnitude of the measured anisotropy. Voids also do not account for the apparent change of sign in K u we have observed after stress annealing for very Co-rich compositions compared to alloys with higher Fe, Mn, or V.
It is thus unlikely that stray field inhomogeneities provide a significant stress induced anisotropies as observed in Co-base MANCs. For this reason it is justifiable to ignore the nonlocal kernel term in Eq. (3). It has been noted that excess free volume can influence structural anisotropy in creep deformed bulk amorphous materials. Reference Ott, Kramer, Besser and Sordelet60 Creep induced structural anisotropy in Co-based amorphous materials has been recently measured to give rise to uniaxial magnetic anisotropies whose absolute values are ∼0.3 kJ/m3. Reference Ohnuma, Herzer, Kozikowski, Polak, Budinsky and Koppoju61 To the extent that this anisotropy is transmitted to the crystalline phase in MANCs it may contribute to induced anisotropy in the crystals but it is much smaller than anisotropies shown in Fig. 2. Stress induced anisotropies in the Co-rich Nb based alloys are thus likely attributed to local variations in magnetic anisotropy due to:
-
(i) Low symmetry nanocrystalline phases (in the case of Co-based nanocomposites, HCP Co). For compositions where FCC is the stable phase at the crystallization temperature, planar defects created though solute and stress effects disrupt local cubic magnetocrystalline anisotropy. For compositions where HCP is the stable phase, planar defects in randomly oriented crystals alter the magnitude and orientation of the local magnetocrystalline anisotropy. In nanocomposites with competing phases of similar free energies, interfacial effects can influence the overall stability. For example, in Co-rich Zr based nanocomposites an Fe enriched BCC phase preferentially forms in nominal compositions well into the single phase FCC region of the equilibrium FeCo phase diagram. Reference Ohodnicki, Long, Laughlin, McHenry, Keylin and Huth12 The BCC phase is not present in the alloys described here and the observed structure from XRD and TEM suggest that either the FCC or HCP phase could be present. It is likely that the partitioned regions observed in the APT concentration maps correspond to unique structures so that the observed spacings in diffraction patterns are a combination of more than one phase. Efforts to determine the local structure within the partitioned phases is ongoing, therefore the present work considers either FCC or HCP parent phases as potential sources of stress induced K u.
-
(ii) Magnetoelastic anisotropy can lead to induced anisotropies in magnetic materials with large magnetostrictive coefficients. In stress annealed FeSi based MANCs, K u is controlled by the magnetostriction of the crystalline phase and residual stress in the matrix. Reference Herzer62,Reference Alves, Desmoulins, Herisson, Rialland and Costa63 Measurements of differential strain by peak shifts with transmission XRD as first shown by Ref. Reference Ohnuma, Hono, Yanai, Fukunaga and Yoshizawa64 confirm this theory. Similar experiments on a Co-rich MANC show evidence of affine strain, but isolated peaks are not present due to the high fault density and complicate the comparison. Reference Leary, Keylin, Ohodnicki and McHenry18 In simpler Co-based amorphous materials, magnetostrictive coefficients are observed Reference O'Handley65 to vary systematically with VBS concentration, but the trend is to reduce magnetostrictive coefficient magnitude with increasing Fe, Mn, Cr, and V concentrations similar to those reported here. Magnetostriction in the crystalline phase is unknown, but is likely a small negative value. Magnetostrictive coefficients are small, a few ppm, relatively insensitive to stress, Reference Barandiaran, Hernando, Madurga, Nielsen, Vazquez and Vazquez-Lopez66 and induced anisotropies in the amorphous phase under tensile stress Reference Hernando67,Reference Haimovich, Jagielinski and Egami68 are orders of magnitude smaller than those reported here. Further, magnetoelastic anisotropy has a strong temperature dependence not observed in these MANCs. Thus, this is not a mechanism that explains the giant induced anisotropy reported here.
-
(iii) Heterophase interfacial anisotropy at the metal/amorphous interfaces can be associated with the lower crystal field symmetries for atoms at the interface. Finer nanocrystals increase the interfacial area per unit volume. Very fine microstructures are observed in Co-based MANCs but not sufficiently different from state of the art Fe-based MANCs to account for a considerable increased fraction of the induced anisotropy. Given comparable interfacial anisotropies, the 10-fold increase in K u in Co-based MANCs compared to Fe-based alloys would require a 101/3 = 2.2 fold reduction in the nanocrystals size, which is not observed.
-
(iv) Crystal interfaces, such as stacking faults and/or growth or deformation twins, where the magnetic atoms occupy local low symmetry environments can contribute to significant local magnetic anisotropies in Co-based materials. The early work of Sucksmith and Thompson Reference Sucksmith and Thompson69 determined the anisotropy field of Co to be 1.8 T. Stacking faults in FCC α-Co possess local HCP symmetry so that modest stacking fault densities could account for anisotropy fields observed in Fig. 2 to be <15% that of bulk HCP Co. Given our previous observations of significant faulting in the nanocrystalline Co-rich phase Reference Leary, Keylin, Ohodnicki and McHenry18 we consider this a likely source of induced anisotropy as discussed in the next section.
B. Deformation slip and growth induced anisotropy in nanocrystalline phases
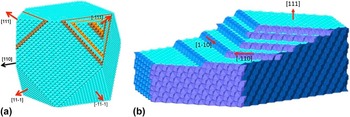
Faulting can result by deformation in an ordered crystal or during the process of crystal growth as illustrated in Fig. 8. Figure 8(a) illustrates a hypothetical equiaxed FCC crystal with a truncated cubic shape chosen to illustrate (100) and close packed (111) planes with deformation slip faulting in the {111}[110] slip system. Figure 8(b) shows (111) planes of a cubic crystal with stacking faults resulting from crystal growth by a ledge mechanism. We argue that only the former mechanism would be operative in Co-based MANCs that are stress annealed after nanocrystallization while both would be active in MANCs that are stress annealed during crystallization.
(a) Hypothetical equiaxed FCC crystal with a truncated cubic shape chosen to illustrate (100) and close packed (111) planes with deformation slip faulting in the (111)[110] slip system (b) (111) plane of a cubic with stacking faults resulting from crystal growth by a ledge mechanism.

1. Induced anisotropy in crystalline soft magnetic materials
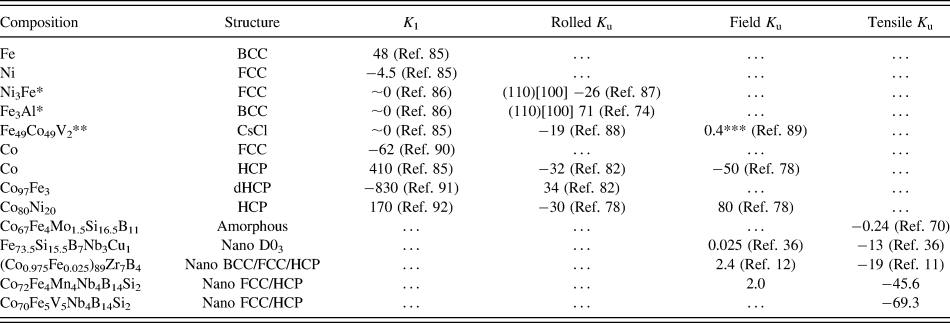
Models of slip-induced anisotropy were developed to successfully explain K u after mechanical deformation first in ordered FCC Ni–Fe alloys Reference Chikazumi, Suzuki and Iwata70,Reference Chin71 and later in ordered BCC alloys. Reference Chikazumi, Suzuki and Iwata72,Reference Chin73 The model describes the formation of easy magnetic planes or hard axes formed across slip planes activated by a given stress condition. The developed K u can be larger than the K 1 of the constituent elements, e.g., Refs. Reference Chikazumi, Suzuki and Iwata70, Reference Chin73, and Reference Chin74 and the model successfully describes the direction and magnitude of K u for several deformation scenarios. The K u in the slip model is solely a consequence of local chemical ordering as the parent FCC lattice is maintained, but superlattice translational symmetries are changed. Table II shows the measured leading magnetocrystalline anisotropy constant K 1 for several crystalline, amorphous, and nanocomposite soft magnetic materials and the maximum K u produced by rolling, field annealing, or annealing under tensile stress. Pure Co has a large K 1 with the easy axis parallel to the c-axis at low temperatures that reorients to the basal plane above 230 °C. Reference Sucksmith and Thompson69,Reference Paige, Szpunar and Tanner75 Rolling or field annealing Co can result in large K u without the ordered bond pairings between different elements that form the basis of the slip plane model. Instead, the direction and magnitude of K u in Co-rich crystalline materials can be described by a texture developed during processing and the orientation of the easy axis to the texture. Reference Takahashi, Kadowaki, Wakiyama, Anayama and Takahashi76 The field annealed K u in Co is fairly straight forward in that the applied field favors growth of HCP crystals from one of the four {111} FCC planes that results in the lowest free energy while cooling through the martensitic transformation temperature. Reference Takahashi, Kadowaki, Wakiyama, Anayama and Takahashi77 Upon further cooling, the sign change in K 1 results in a negative K u that is perpendicular to the applied field direction. Alloying Co can affect the K 1(T) behavior so that K 1 remains positive up to the HCP→FCC transition temperature in Co x Ni{1−x} when x > 7 at.%. Reference Takahashi, Kadowaki, Wakiyama, Anayama and Takahashi78 This is evident in the change of sign for field annealed K u in Co80Ni20 compared pure Co from Table II while the direction and magnitude of rolling induced K u between these alloys is similar. In the original work, the use of Co properties to predict the K u from rolling stress resulted in the wrong sign as described in Ref. Reference Takahashi, Kadowaki, Wakiyama, Anayama and Takahashi77, but this was resolved after considering the dHCP structure with ABAC stacking that has the easy direction in the basal plane. Reference Wakiyama, Wolfe, Graham and Rhyne79,Reference Tanaka, Takahashi, Kadowaki and Wakiyama80 The K u direction from rolling reflects the sign of K 1 as shown in Table II and the temperature dependencies of the rolled K u match the K 1(T) of the respective HCP and dHCP phases. Reference Tanaka, Takahashi, Kadowaki and Wakiyama80 Notably, K 1(T) for dHCP is fairly constant up to the martensitic transformation temperature. Reference Takahashi and Kadowaki81 Texturing was measured in rolled Reference Tanaka, Takahashi, Kadowaki and Wakiyama80 and field annealed Reference Tanaka, Takahashi and Kadowaki82 crystalline Co and Co alloys that supports the preferred orientation model.
Leading magnetocrystalline anisotropy constants K 1 and maximum induced anisotropies K u in kJ/m3 produced by rolling or annealing under a field or tensile stress. Materials are polycrystalline unless the rolling orientation is noted and positive K u values correspond to easy magnetization directions parallel to the rolling/field/tensile stress direction. All anisotropy constants are measured at room temperature. a

a *Disordered, **ordered, ***Fe50Co50.
Both basal plane slip and martensitic transformations in Co are governed by defect reactions in close packed structures. Reference Johnson and Dragsdorf91 In a single component material, a stacking fault in close packed planes potentially creates an easy magnetization direction in-plane or normal to the fault. Multiple intersecting stacking faults can define magnetic anisotropy similar to the ordering of like (BB) and unlike (AB) atom pairs in the slip induced anisotropy model. Reference Chikazumi, Suzuki and Iwata70 In pure Co, stacking faults and {111} or {00.2} twins are described in the Zhdanov or hc (h = HCP, c = FCC) notation Reference DeGraef and McHenry92,Reference Iglesias93 and disruption in cubic symmetry occurs in h blocks. Layers are labeled according to whether the layer above and below a layer of interest are the same or different. In HCP (ABAB stacking), layers above and below are the same, so each layer is hexagonally surrounded and designated h. In FCC ABCABC stacking, the layers above and below each plane are different and designated c (for cubic). In periodically faulted structures, there will be a sequence of h and c's that is repeated and identifies the structure. For random faulting an infinite sequence is required and it is the fault density that is important for properties. In the Neel model for magnetic anisotropy, Reference Neel94 stacking faults and {111} twins are indistinguishable in terms of their contribution to anisotropy.
We can follow the bond orientational order rather than the chemical order and express a pseudodipolar interaction for faulting of FCC Co, as proportional to the local anisotropy occurring at an h-block. Unlike the slip-induced anisotropy discussed above, the symmetry breaking is of a rotational rather than a translational symmetry and for Co gives rise to an easy magnetic direction parallel to the plane normal (as determined by the first order anisotropy constant for Co). In general, stacking faults will increase/decrease the magnetic anisotropy in FCC/HCP Co. Reference Aas, Szunyogh and Chantrell95 The number of BB bond's in the Neel pair anisotropy model for ordered alloys can be mapped into the number of faults in FCC Co and the magnitude of the induced anisotropy is proportional to the slip plane density. Reference Chikazumi, Suzuki and Iwata70 In pure Co, the magnetic anisotropy is due to the symmetry of nearest neighbor anisotropy bonds, whereas in ordered alloys the strength of the various bonds must be factored in, as described above. The large difference in K u between an amorphous Co-rich alloy Reference Haimovich, Jagielinski and Egami68 and nanocomposite Co-rich alloys following stress annealing shows the importance of structural ordering to magnetic anisotropy (Table II). Further, differences between the stress dependence of K u in Zr based and Nb based Co-rich nanocomposites suggest different mechanisms, or optimization of a mechanism that dominates K u, within a relatively small composition space (Fig. 2). This is not surprising considering the variety in crystalline Co-rich alloys, where both phase stability and magnetocrystalline anisotropy are sensitive to small composition changes.
2. Growth fault induced anisotropy in nanocrystalline phases
Figure 7(b) shows an equiaxed FCC crystal, with octahedral shape, chosen to illustrate terminating close packed {111} planes. FCC stacking faults occur in {111} planes, in 1 of 3 possible 〈110〉-type directions. There are 4 {111} plane normals passing through prismatic triangular faces and thus 12(4 × 3) slip systems. If a driving force sufficient to disrupt the crystal stacking order acts equally on all {111} planes in randomly oriented crystals, no anisotropy is induced. For a defined tensile stress axis, the maximum shear planes are oriented 45° to the axis and in nanocomposites the amorphous phase transmits the shear stress. Ribbons show as much as 8–10% elongation during stress annealing but much smaller elongation results when stress annealing a ribbon that was previously crystallized without stress. For randomly oriented crystals a weighted linear combination analogous to the Schmid factor Reference Dieter96 will be observed. In a through thickness direction when the amorphous phase magnetically couples nanocrystals, there will be a sample shape anisotropy suppression of K u through the thickness. For deformation at T > T C of the amorphous phase, ribbon shape anisotropy thus appears after cooling.
Note that the Neel model treatment of anisotropy in ordered alloys like Fe–Ni or pure low symmetry structures considers only nearest neighbor (NN) interactions. For 12-fold coordination, there are only 3 possible close-packed NN configurations, the cuboctahedron (FCC), twinned cuboctahedron (HCP), and icosahedron. Reference DeGraef and McHenry92 The first terms in a Neel expansion of the anisotropy energy density are uniaxial for HCP, 4th order for cubic and 6th order for icosahedral symmetries Reference McHenry, O'Handley, Dmowski and Egami97 potentially present in the amorphous state. Reference Mchenry, Eberhart, O'Handley and Johnson98 Considering a FCC crystal, this implies bond orientational order is more important than chemical order for inducing anisotropy and that a large uniaxial anisotropy in HCP Co contributes to strong local anisotropy at faults. The broad diffraction peaks do not distinguish between FCC and HCP crystals in the Co-rich Nb based compositions studied to date. Reference Leary, Keylin, Ohodnicki and McHenry18 Absolute K u 's in our Co-based MANCs exceed K 1 of FCC Co Reference Suzuki88 but are considerably smaller than HCP Co suggesting that stacking faults either strengthen or dilute anisotropy for a FCC or HCP crystal respectively. Alloying that reduces SFE will increase fault density in Co and the magnitude of slip-induced anisotropy.
The details of the fault geometries and the direction of the induced anisotropy depends on the deformation mechanism and is likely different in nanocrystals than bulk Co. In our experiments we applied tensile stress, and randomly oriented nanocrystals grow from the parent amorphous phase during nanocrystallization. A nucleation agent such as Cu clustering is not required to achieve a high nucleation density in Co-rich alloys. In many cases small crystalline regions of as-cast material are found but the growth faulting mechanism is independent of whether or not they are present as long as the nucleated or pre-existing phase is close packed. Randomly oriented critical nuclei likely formed during rapid solidification and small ordered regions were found in as-cast material. We envision a growth mechanism where adatom attachment to growing nanocrystals is fast enough that patches of faulted and unfaulted regions could grow due to coordinated atomic rearrangement from the as-cast state, similar to a martensitic transformation, or by lateral ledge growth [Fig. 8(b)] yielding a mosaic of fault domains in a given plane with ledges nucleating on ledges before individual planar growth is completed. Growth faults and faceting have been observed in metallic Reference Jones, McNerny, Wise, Sorescu, McHenry and Laughlin99,Reference Jones, Swaminathan, McHenry and Laughlin100 and oxide Reference Swaminathan, Nuhfer and McHenry101,Reference Swaminathan, Willard and McHenry102 nanocrystals grown from the (plasma) gas phase, but generally nanocrystals growing is a solid–solid phase transformation from the amorphous phase do not exhibit strong faceting consistent with their rapid and constrained growth.
A distinction between the microscopic mechanisms for deformation faulting and growth faulting has been made Reference Barrett103 and the two distinguished by a deformation fault containing 4 planes in a metastable FCC stacking sequence and a growth fault containing 3 planes. Reference Houska, Ott and Locke104 Growth faulting has also been addressed in HCP crystals Reference Christian105 in terms of contributions to scattering. Christian and Mahajan Reference Christian and Mahajan106 have reviewed the field of deformation twinning where faulted regions possess a mirror symmetry with respect to the parent lattice. We reiterate that while there are geometrical distinctions between faults, since the Neel model of magnetocrystalline anisotropy is a nearest neighbor model, {111} or {00.2} stacking faults or twins are equivalent in their contribution to magnetic anisotropy. However, faulting in HCP is possible on prismatic and pyramidal planes is possible and should also be considered. A quantitative model of the extent that growth faulting is biased by a tensile stress in nanocrystals growth is at present not known, but we have performed critical experiments to distinguish between deformation and growth faulting described below.
It has been observed that in nanocrystallization without a tensile stress, crystals are also heavily faulted. Reference Leary, Keylin, Ohodnicki and McHenry18 As we see faults in materials crystallized both with and without a stress, and stress annealing effects accompany crystal growth from the amorphous matrix, it is reasonable to assert that the crystals can have their growth faulting biased in the presence of large tensile stress. We have performed experiments that decoupled the nanocrystallization step from the stress annealing step. In samples of the Co75.4Fe2.3Mn2.3Nb4Si2B14 alloy crystallized at 520 °C, high permeability square loops are observed after nanocrystallization without stress in contrast to the low permeability material that results after stress annealing. Reference Leary, Keylin, Ohodnicki and McHenry18 A similar effect was observed in the Co72Fe4Mn4Nb4Si2B14 alloy that showed the maximum K u for the FeMn system described above.
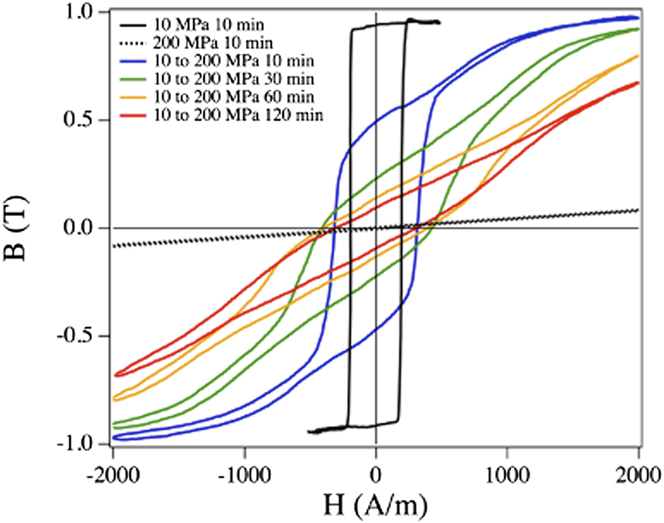
Figure 9 shows the BH loops for alloys with this composition that were first annealed for 10 min with minimum stress (<10 MPa, necessary to hold the sample in the annealing furnace) and then had stress applied for different times between 10 min and 2 h at the annealing temperature. Each curve represents a separate sample with a unique annealing treatment. For the sample annealed at 10 MPa for 10 min only, a square loop results with relatively high coercivity. Samples that had a 200 MPa stress applied after the initial anneal at 10 MPa show similar high coercivity loops but permeability decreases proportional to the duration of the applied stress. These loops differ dramatically compared to the BH loop of the sample crystallized in a stress field (200 MPa) that shows both low permeability and low coercivity. The samples with stress applied after 10 min at the annealing temperature respond to stress, but the induced anisotropy values are 25 times smaller (permeability 25 times larger) than those reported above for samples with simultaneous stress annealing and nanocrystallization. While this demonstrates induced anisotropy from a degree of deformation faults, or contributions from the other mechanisms described above, it is significantly less than that induced in samples where primary crystallization occurred in the strain field and the associated kinetics are clearly much more sluggish.
B(H) response for Co72Fe4Mn4Nb4Si2B14 samples annealed with 200 MPa applied after an initial nanocrystallization at a minimal (<10 MPa) stress as compared to an alloy crystallized in the presence of a 200 MPa applied stress for the same duration of time. Hysteresis loops are measured at 400 Hz on single strip samples.
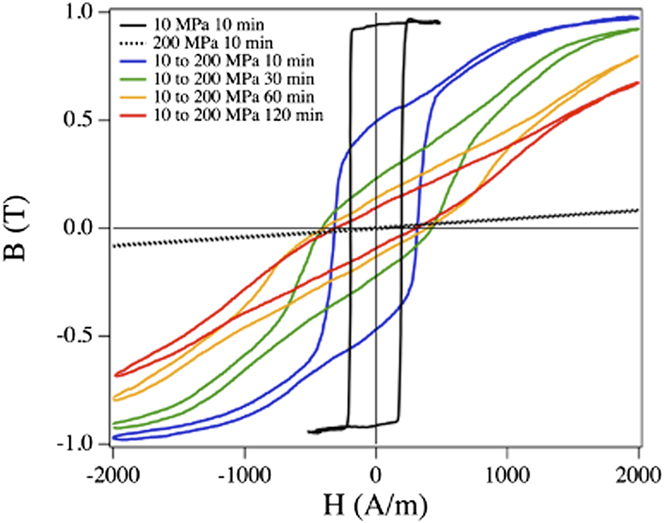
Induced anisotropies in samples stress annealed after nanocrystallization are somewhat larger than those observed in Fe–Ni based bulk (poly)crystalline alloys, but those observed in the same alloy nanocrystallized with applied stress are 25 times larger. It is further reported that tensile strains as large as 8% are observed in samples stress annealed while crystallizing while for stress annealing post-nanocrystallization, strains are typically <2%. This is consistent with fully developed nanocrystals impeding the deformation of the parent amorphous phase and the loss of visco-plastic behavior observed in some metallic glasses. Reference Inoue107 This also suggests that frictional forces between the deforming matrix and the growing ledges may also be influencing growth induced stacking fault densities.
It has been reported Reference Barrett103 that growth faults are more difficult to remove by annealing. This is attributed to the fact that deformation faults can be unslipped by moving a partial dislocation across close packed planes. It is conjectured that in the fast growth conditions in stress annealing near the crystallization temperature close packed planes may in fact not be single crystalline. Instead they may be copiously faulted to the extent that individual close packed planes planes may combine to form complex 3D dislocation networks with low mobilities. This would suggest an induced anisotropy for growth faulting that is stable to higher temperatures. A more detailed crystallographic model for growth induced anisotropy in Co nanocrystals will be discussed in a future publication.
C. Inductive application considerations
The influence of induced anisotropy on losses in high frequency inductive components is postulated to reduce anomalous eddy current losses associated with the motion of domain walls in the switching process. This loss increases as a power of frequency and therefore limits use at high frequency. For K u < 0 materials with large induced transverse anisotropy described above, the easy axis results in domain magnetization normal to the longitudinal (circumferential) field axis in a toroidal core. As a result the switching is postulated to occur by a less lossy rotational process. The added benefit of the TE VBS additions is in increasing the resistivity to which classical eddy current losses are inversely proportional. Since classical eddy current losses scale like the square of frequency, they represent a significant high frequency loss mechanism. The sizable increase in resistivity caused by resonant scattering off of the VBS has been documented for crystalline Co Reference Aoki, Gotoh and Obi108 and amorphous Co-based alloys and typically scales with the VBS concentration.
Since the exchange stiffness,
 $A\left( {\vec r} \right)$
, is large in Co-based alloys the temperature dependence of the magnetization and magnetic anisotropy will be small to high temperatures, i.e., below the amorphous T
C, phase transition temperatures,
Reference Johnson and Dragsdorf91
or a spin reorientation temperature.
Reference Bertaut, Delapalme and Pauthenet109
The high T
C of Co-based materials speaks to the relative constancy of the magnetic switching at elevated temperature. For this reason these materials offer advantages over Fe-based MANCs for passively cooled cores and operation in higher temperature environments. In Fe-based MANCs, rotational processes have been observed to break up above ∼5 kHz for relatively weak induced anisotropy.
Reference Flohrer, Schäfer, McCord, Roth, Schutlz and Herzer110
The stronger induced anisotropy and larger exchange stiffness in Co-based alloys suggests advantages at high frequencies.
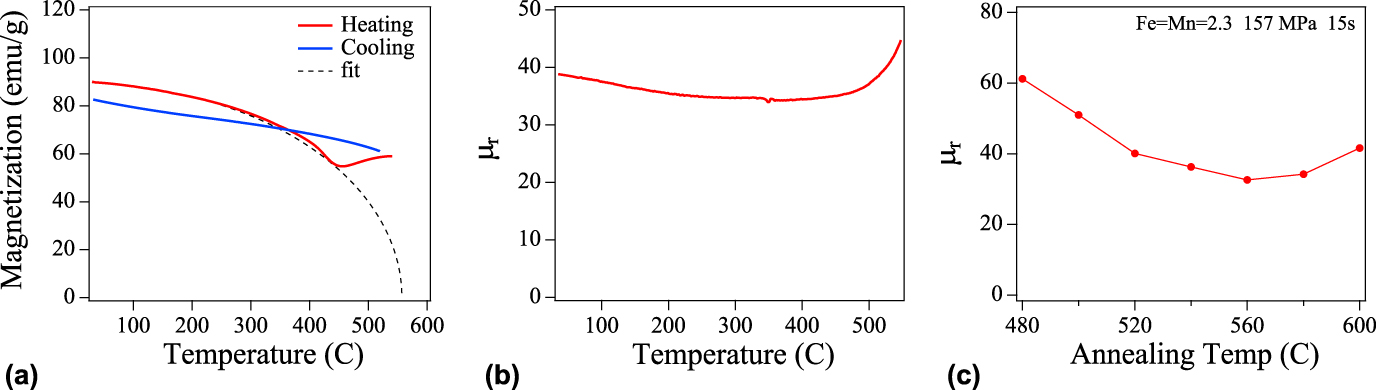
Figure 10 shows high temperature properties of a Co-based MANC. Figure 10(a) shows M(T) for a Co75.4Fe2.3Mn2.3Nb4Si2B14 sample heated from the as-cast state to 550 °C and subsequently cooled to room temperature. The fitted curve shows the T C of the as-cast amorphous phase is 557 °C. Figure 10(b) shows the temperature dependence of permeability for a toroidal core excited with a 100 Oe field amplitude sine wave at 50 kHz, for an optimally stress annealed sample. In Fe-based systems, induced anisotropy is related to the residual stress (σ) and magnetostriction in the nanocrystals, each with respective temperature dependencies K u(T) ∼ σ(T)λ(T). Permeability is stable in the Co-rich material (within ∼10%) over a wide temperature range, further indicating that the anisotropy mechanism differs from the magnetoelastic coupling found in Fe–Si based MANCs. Reference Ohnuma, Hono, Yanai, Fukunaga and Yoshizawa64,Reference Ohnuma, Yanai, Hono, Nakano, Fukunaga, Yoshizawa and Herzer111 The large rise at ∼500 °C is consistent with a Hopkinson peak Reference Hopkinson112 that accompanies decoupling of the nanocrystals near the (reduced) T C of the glass former enriched amorphous phase after nanocrystallization. Hopkinson peaks in coercivity versus temperature have been observed at much lower temperatures in Finemet magnets. Reference Mazaleyrat and Varga113 Alternatively, the increase in permeability could be due to loss of the structural anisotropy caused by thermally activated defect motion.
Temperature dependent magnetic response for a Co75.4Fe2.3Mn2.3Nb4Si2B14 alloy, stress annealed at 157 MPa. (a) M(T) on heating and cooling with an amorphous phase T C = 557 °C determined from a Brillouin function fit; (b) relative permeability as a function of temperature for a toroidal core excited with a 100 Oe field amplitude sine wave at 50 kHz; and (c) room temperature permeability under the same conditions as (b) as a function of the field annealing temperature.
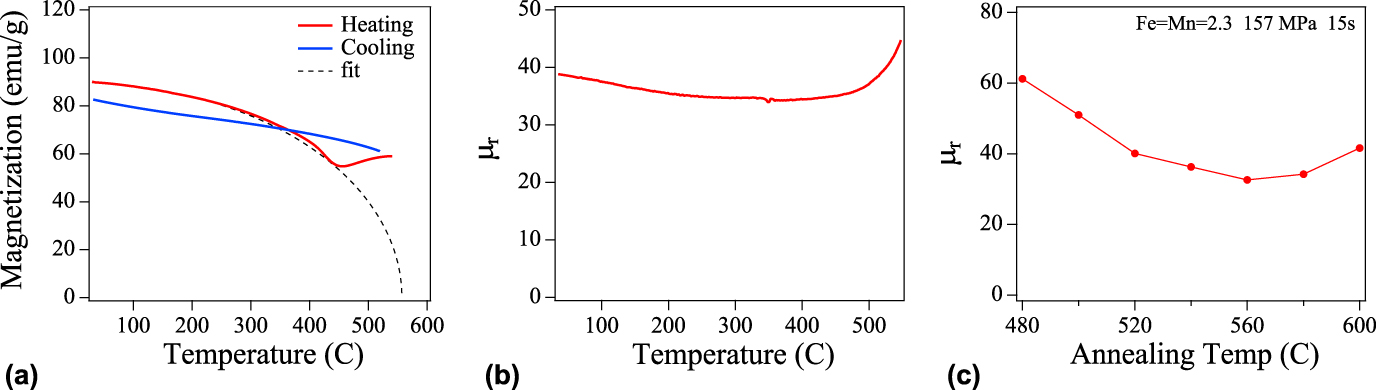
The magnetic behavior observed prior to decoupling is called exchange softening. Reference Suzuki and Herzer56,Reference Herzer and Varga114 Dipolar interactions exist between the nanoparticles as well as exchange field coupling into the amorphous matrix. This can lead to a weak ferromagnetic-like coupling between the nanocrystalline grains at temperatures above the T C of the amorphous matrix as reported in Refs. Reference Herzer and Varga114–Reference Franco, Conde, Conde and Ochin117 recently described as “superferromagnetism”. Reference Bedanta, Eimüller, Kleemann, Rhensius, Stromberg, Amaladass, Cardoso and Freitas118 Figure 10(c) shows room temperature permeability as a function of the field annealing temperature. It is observed that the lowest permeability (largest K u) is achieved for field annealing near T C of as-cast amorphous phase. This suggests that the T C of amorphous phase may provide an ultimate limit for high temperature switching. Observation of domain coupling through “superferromagnetism” Reference Franco, Conde, Conde, Kiss, Kaptás, Kemény and Vincze116 above the Hopkinson peak and the symmetry of dipolar fields Reference Michels, Vecchini, Moze, Suzuki, Cadogan, Pranzas and Weissmüller119 at elevated temperature, will be important future observations.
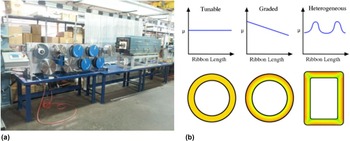
Advances in materials have the potential to enable revolutionary advances at the full device and component level as exemplified by the rising prevalence of wide-bandgap semiconductor based switching devices. Since the stress applied during a continuous annealing process can be varied, it is possible to engineer graded permeabilities in ribbons allowing variation of the permeability in regions of a core with geometries that provide hot spots. Demonstration of graded permeability will be the subject of future work. As illustrated in Fig. 11, we envision several modes of controlling of stress annealing to allow for tunable, graded, and heterogeneous core permeabilities with advanced systems control of stress annealing processing. A new ability to controllably tune the permeability of low-loss inductive materials over an unprecedented range of values through a combination of compositional adjustment and thermal-mechanical or thermal-magnetic processing can similarly open new opportunities for optimizing overall performance at the component and device level for passive and inductive based devices. This affects a broad array of emerging applications that have the potential for dramatic impacts on the efficiency of the electrical energy transmission, distribution, and utilization infrastructure which in many cases are also directly linked with recent advances in wide-bandgap based semiconductor devices. Such relevant applications span power electronics conversion systems (grid integration of renewable and other distributed generation, HVDC, and FACTS systems) for the T&D system of the future, passive and wireless magnetic field/current sensors for power flow monitoring and control as well as asset monitoring in an existing and aging T&D system, and higher efficiency electrical machines for industrial motors and generators. Of particular interest for these applications will be tunable and controlled permeabilities that can be sustained under high operational temperatures and can also be modified heterogeneously throughout an inductive component, as desired making the amorphous and nanocrystalline alloys described here ideal systems to provide the needed functionality. Through close collaborations between the materials research and development community as well as the device and systems-level engineers, advances in permeability engineering of inductive materials can provide new tools to power electronics, motor, and sensor developers to achieve a global optimization of materials and device performance not previously attainable.
(a) Tensioning rolls and annealing furnace used in stress annealing at an industrial scale (b) modes of controlling of stress annealing to allow for tunable, graded, and heterogeneous core permeabilities.

V. CONCLUSIONS
Stress annealed magnetic nanocomposites are of interest for inductive components. Induced magnetic anisotropies, K u's, in first generation stress annealed Co-based MANCs exhibit a response to applied stress twice that of Fe-based MANCs. Induced anisotropies, K u ∼ 20 kJ/m3 (anisotropy fields, H K ∼ 500 Oe), in first generation stress annealed Co-rich MANCs have been increased to K u ∼ 70 kJ/m3 (H K > 1800 Oe) in new systems reported here. These systems have dilute concentrations of early transition metal elements, Mn, Cr, and V, that contribute virtual bound states (VBS) to the parent magnetic metal d-bands. Induced anisotropy values for these systems do not depend on magnetoelastic interaction between crystalline grains and the amorphous matrix, but rather correlate strongly with expected variations in SFE modified by VBS. We consider faults in the nanocrystalline phase, aligned by the local stress field during crystallization, to be the likely operative mechanism for inducing anisotropy. The combination of large resistivities, as compared with crystalline alloys, and induced anisotropies impact high frequency losses in these materials. The large exchange stiffness in Co-based systems enables low loss switching at elevated temperatures and tunability of permeability suggests continuous processes to produce graded permeabilities impacting spatial uniformity of the temperature in the core.
ACKNOWLEDGMENTS
A.M.L. and M.E.M. were supported by ARPA-E Award No. DE–AR0000219. V.K. was partially supported by ARPA-E Award No. DE–AR0000219 and by the U. S. Army through Award W911NF1410184. The authors also acknowledge support from the DOE Solar Energy Technology Office and the Grid Modernization Laboratory Consortium through the SuNLaMP initiative under agreement # DE-EE-00031004. Atom probe tomography was performed using Environmental Molecular Sciences Laboratory (EMSL), a national scientific user facility sponsored by the Department of Energy's Office of Biological and Environmental Research. EMSL is located at PNNL, a multiprogram national laboratory operated by Battelle Memorial Institute under Contract No. DE-AC05-76RL01830 for the U.S. Department of Energy. AD would like to acknowledge the funding from the Material Synthesis and simulations Initiative conducted under the Laboratory Directed Research and Development Program at Pacific Northwest National Lab (PNNL). The authors thank T. Nuhfer for HRTEM imaging.