
I. INTRODUCTION
Nanocomposites are solid combinations of a bulk matrix and nanosized phase(s), which are separated by a distinct interface and have different properties due to the difference in the composition and structure. In recent years, the design of polymer-based nanocomposites, containing inorganic phases as functional nanoparticles, is one of the emerging research fields in nanotechnology. This combination of components demonstrates properties that are not inherent in the original components, either combine their best properties or even exceed them (e.g., polyaniline/TiO2 nanocomposites with enhanced conductivityReference Su and Kuramoto1; epoxy/TiO2 nanocomposites with excellent optical transparencyReference Chau, Tung, Lin and Li2). The poly(N-vinylcaprolactam) (PVCL)-based nanocomposites composed of the titanium dioxide nanoparticles (TNPs) dispersed in the polymer matrix hold considerable promise.
Each of the components is interesting for its physicochemical properties. PVCL is a polymer readily soluble in water over a wide concentration range. It exhibits a lower critical solution temperature close to the human body temperature and is characterized by biological compatibility and low toxicity.Reference Kirsh3–Reference Sibileva, Sibilev and Klyubin5 TNPs demonstrate adsorption, photocatalytic, bactericidal, optical, and other performance properties depending on the composition and structure (see Refs. Reference Ismagilov, Shikina, Bessudnova, Korneev, Ishchenko, Chesalov, Vladimirova and Ryabchikova6 and Reference Gnaser, Huber, Ziegler and Nalwa7).
Among the various ways of polymer nanocomposite synthesis,Reference Hanemann and Szabó8,Reference Gorrasi and Sorrentino9 dry mixing and grinding (with shear stresses) and mechanical milling (high-frequency mechanical treatment) are of theoretical and practical interest. There are no examples of the use of these methods in the literature. Although there are more complex methods, combining mechanical milling of the starting compounds mixture and different treatments or chemical reactions improves the properties (e.g., polymerization followed by ball milling poly(methyl methacrylate) and hydroxyapatite to improve flexural propertiesReference Tham, Chow and Ishak10).
A significant amount of the publication is devoted to the mechanical milling of nanosized titania. It promotes polymorphic transition anatase—brookite–rutile (mechanical ground in a sintered alumina mortar for various periods of up to 96 h at room temperature in air)Reference Suwa, Inagaki and Naka11 and amorphization of crystalline phases and crystallization of the amorphous phase occurred at the same time (high-frequency mechanical milling).Reference Ren, Yang and Shaw12,Reference Baláž, Achimovičová, Baláž, Billik, Cherkezova-Zheleva, Manuel Criado, Delogu, Dutková, Gaffet, José Gotor, Kumar, Mitov, Rojac, Senna, Streletskii and Wieczorek-Ciurowa13 One knows the action of mechanical treatment in a planetary mill on the structure and characteristics of polymers: cleavage of polymer C–C bonds after ball milling, change in molecular weight (MW) distribution of PVPReference Kaneniwa and Ikekawa14 and 1-methylnaphthalene,Reference Beyer and Clausen-Schaumann15 and amorphization of crystalline poly(ethylene terephthalate).Reference Font, Muntasell and Cesari16
The aim of the present study is to identify, systematize, and explain the nature of the effects observed for PVCL and TNP during preparation of PVCl/TNP nanocomposites by mechanochemical methods. The originality of this work lies not only in the absence of publications about PVCL/TNP nanocomposites but also in the use of a little-known η-modification as one of the TNPs. It is a promising modification from an applied point of view (high adsorption capacity to extract inorganic ions and low MW organic compounds from aquatic environmentsReference Dadachov17 and the best photocatalytic activity at pH = 9 as can be seen in Ref. Reference Savinkina, Obolenskaya, Kuz’micheva, Dorokhov and Tsivadze18) with the composition of TiO2−x·nH2O.
The X-ray diffraction study is the main method of research used in this paper. It is the most affordable, reliable, generally accepted method, developed from the point of view of both tool and software, and it allows us to visually assess the result of the synthetic process. Although information about some of these effects can be found in the literature, no studies applying dry mixing and ball milling and X-ray diffraction as a characterization method have been conducted up to the present.
II. EXPERIMENTAL SECTION
A. Synthesis of nanocomposites
The PVCL/TNP nanocomposites were prepared by two methods: dry mixing and grinding (Method 1) and mechanical milling (Method 2) of starting PVCL and TNP samples. TNPs are samples of titanium oxides(IV) nanoparticles having the anatase—TiO2 (A) or η-phase (EP) structure—TiO2−x·mH2O, which have been synthesized earlier by our scientific group,Reference Kuzmicheva, Domoroshchina, Savinkina, Obolenskaya and Brown19–Reference Vasilyeva, Kuzmicheva, Pochtar, Gainanova, Timaeva, Dorokhov and Podbel’skiy21 and commercial Hombifine N (HF) and Hombikat UV100 (HK) with nanosized anatase.
1. Method 1
The PVCL25 and PVCL40 films, which were fabricated from PVCL aqueous solutions dried to constant weight at different temperatures (25 and 40 °C, respectively),Reference Chihacheva, Timaeva, Kuzґmicheva, Dorohov, Lobanova, Amarantov, Podbel’skiy, Serousov and Sadovskaya22 were ground in a porcelain mortar to a finely powdered state. The resulting PVCL powders were mixed and ground with the TNP in different PVCL:TNP weight ratios (2:1; for TNP = HF, 1:1, 2:1, and 10:1) to fabricate PVCL25/TNP and PVCL40/TNP nanocomposites.
2. Method 2
The mechanical milling of TNP powders, PVCL powders, and mixtures of powdered PVCL films and TNP (the PVCL:TNP weight ratios were 1:1 and 2:1) was performed on a RETSCH PM200 high-energy planetary ball mill (ball diameter, 20 mm) at different conditions (frequency: 100, 200, and 400 rpm; milling time: 10–25 min; milling atmosphere: Ar or air; ball-to-powder weight ratio: 50:1; milling power input: 0.6 W/g at 200 rpm and 1.5 W/g at 400 rpm).
B. Characterization
X-ray powder diffraction (XRD) patterns were recorded in a rotation mode on a HZG-4 diffractometer (graphite monochromator; Cu Kα radiation with a diffracted beam monochromator in a step-scan mode: the count time was 10 s per step, the step size was 0.02°; the 2θ angle range was 2°–80°).Reference Vasilyeva, Kuzmicheva, Pochtar, Gainanova, Timaeva, Dorokhov and Podbel’skiy21 The calculations were performed using the programs,Reference Efanov, Podbel’skiy and Kuzmicheva23,Reference Kuzmicheva, Podbel’skiy, Stepanov and Gainanova24 which describe the diffraction line profiles for amorphous and nanosized samples by different functions with applied corrections (accounting for the background level, separation of overlapping peaks, reconstruction of XRD peak profiles, including those at small scattering angles). The average sizes of coherent scattering regions, or the average sizes of crystallites for TNP, or the average sizes of ordered domains, or the sizes of supramolecular PVCL structures (hereinafter referred to as CSR, D) were calculated by using the formula D = Kλ/β cos θ (1), where λ = 1.54051 Å is the wave length, β is the integral peak width, and K = 0.9 is an empirical coefficient. For PVCL, the first XRD peak is at 2θ ∼ 9° and the second peak is at ∼18°. For the TNP, 2θ ∼ 25° corresponds to A and EP and 2θ ∼ 5° corresponds to EP.
The microstrains (ε) together with the sizes of CSR (D) were calculated for the TNP by using the formula β cos θ = λ/D + 4ε sin θ (2). The standard deviation is ±5%.
The IR absorption spectra of powders were recorded as KBr pellets in the 4000–400 cm−1 frequency range with a Bruker Equinox 55 Fourier-transform infrared spectrometer (Bruker, Ettlingen, Germany). The spectra were acquired at 2 cm−1 resolution; the wave number accuracy was 0.1 cm−1.
Scanning electron microscopy of powders was performed with a high-resolution JSM 7500F scanning electron microscope (SEM; JEOL Ltd., Tokyo, Japan. The procedure is described in detail in Ref. Reference Obolenskaya, Kuzmicheva, Savinkina, Zhilkina, Sadovskaya, Prokudina and Chernyshev25). To analyze the SEM micrographs of the microstructure, a special program was developed for image processing, which makes the extraction of objects and their contours (e.g., as spheres or ellipsoids) and the construction of their size-distribution histograms automatic. The program was written using C# for the .NET Framework platform, versions 3.5 and higher. Images (e.g., in the .png format) and the particle-size intervals required for the construction of a histogram served as the input data. The first stage of image processing (labeling) involves the automatic recognition of spherical shapes of the particles and scaling. The object boundaries were extracted using Canny’s edge detector supplemented with a filter to reset the boundaries to a spherical shape. Since the automatic extraction of the particle shape in noisy SEM images gives unsatisfactory results, the program provides for the visual control of the results of the automatic boundary extraction and the manual correction of the boundary segmentation and the particle shape using a dialogue box. In addition, the program allows users to exclude the automatic construction of the boundaries and manually extract the spherical boundaries of the particles. The procedure for labeling in a dialogue box is semi-automatic and employs an approximate estimate using extrapolation. The program gives a particle-size-distribution histogram as the output, which can be exported in most widely used image formats.
The nitrogen adsorption capacity of PVCL/TNP nanocomposites was measured using a ASTM D4780 – 12 standard (room temperature, evacuated system) by the Brunauer–Emmett–Teller (BET) method from the linear branch of the isotherm in the region of equilibrium relative pressures of nitrogen at P/P 0 = 0.05–0.30.Reference Gregg and Sing26
Differential scanning calorimetry (DSC) was carried out with a Netzsch DSC 204 Phoenix calorimeter (Netzsch-Gerätebau GmbH, Selb, Germany) at a temperature scan rate of 10 °C/min under an Ar atmosphere (99.99%) at a flow rate of 100 mL/min in the temperature range of −60–600 °C as described earlier.Reference Chihacheva, Timaeva, Kuzґmicheva, Dorohov, Lobanova, Amarantov, Podbel’skiy, Serousov and Sadovskaya22 The sample weight was 8–12 mg. The samples were placed in standard aluminum crucibles with a pierced lid. Since the thermal analysis parameters, in particular, the glass transition temperature, are rather sensitive to experimental conditions and the presence of moisture within PVCL powders, the system containing the samples (PVCL25/HF and PVCL40/HF) (method 1) was preheated to 230 °C to remove moisture (heating rate was 10 °C/min) and then cooled at the same rate to −60 °C, after which the heating cycle to 600 °C was repeated. The results (peak areas, peak temperatures, and glass transition temperature (T g) for PVCL) were processed using the Netzsch Proteus software. The temperature was determined with an accuracy of ±0.1 °C.
Solid state CP/MAS 13C NMR spectra were measured on a AVANCE-II NMR 400 NMR spectrometer (Bruker, Ettlingen, Germany). The spectra were registered with the use of a two-channel solid state MAS probe with an external rotor diameter of 4 mm. The powdered sample was placed in special zirconia rotors. During spectral registration, the sample was spun at a rate of 12,000 Hz. CP/MAS 13C NMR spectra were measured with the use of polarization transfer with a linearly decreasing 1H pulse during the cross polarization time and high power proton decoupling during spectral registration (τ = 8 μs, φ = 15°). The time of contact was 0.5 ms, the time of delay between scans was 2 s, and the time of the 90° 1H pulse was 3.5 μs. Crystalline adamantane was used as an internal standard of the chemical shift scale. The results were processed using the Topspin 2.3 (Bruker, Ettlingen, Germany) software.
The MW of PVCL (MW, Da) was calculated by using the formula η = 3.5 × 10⁻⁴ × MW0.57 (3), where η, dL/g (deciliters per gram), is the intrinsic viscosity of a PVCL aqueous solution at 25 °C determined on a Ubbelohde viscometer using standard procedures.Reference Kirsh3
III. RESULTS AND DISCUSSION
A. Starting samples
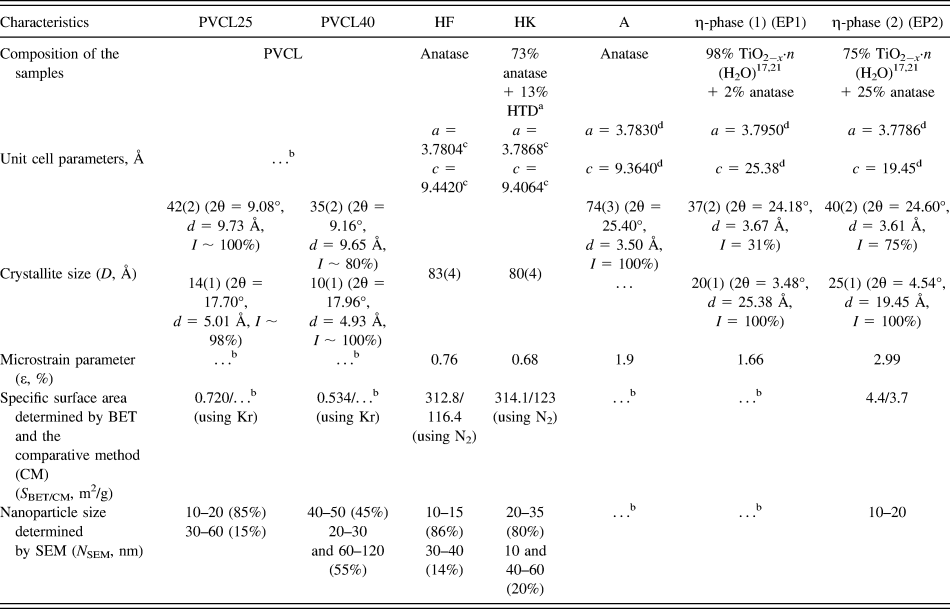
Table I summarizes the characteristics of the starting PVCL and TNP samples [PVCL, commercial TNP—Hombifine N (HF) and Hombikat UV100 (HK) with anatase, EP1 and EP2 with EP], and Fig. 1 shows the XRD patterns of these samples.
Characteristics of the starting samples—PVCL and TNP.

a HTD is hydrated titanium dioxide TiO2−x(OH)2x·yH2O giving XRD peaks at 2θ ∼ 11–12°.Reference Dadachov17
b Not determined.
c The unit cell parameters a and c were calculated from the 200 and 004 reflections, respectively.
d The unit cell parameters a and c were calculated from the 200 and 004 reflections (for anatase) and the 200 and 001 reflections (for the EP), respectively.
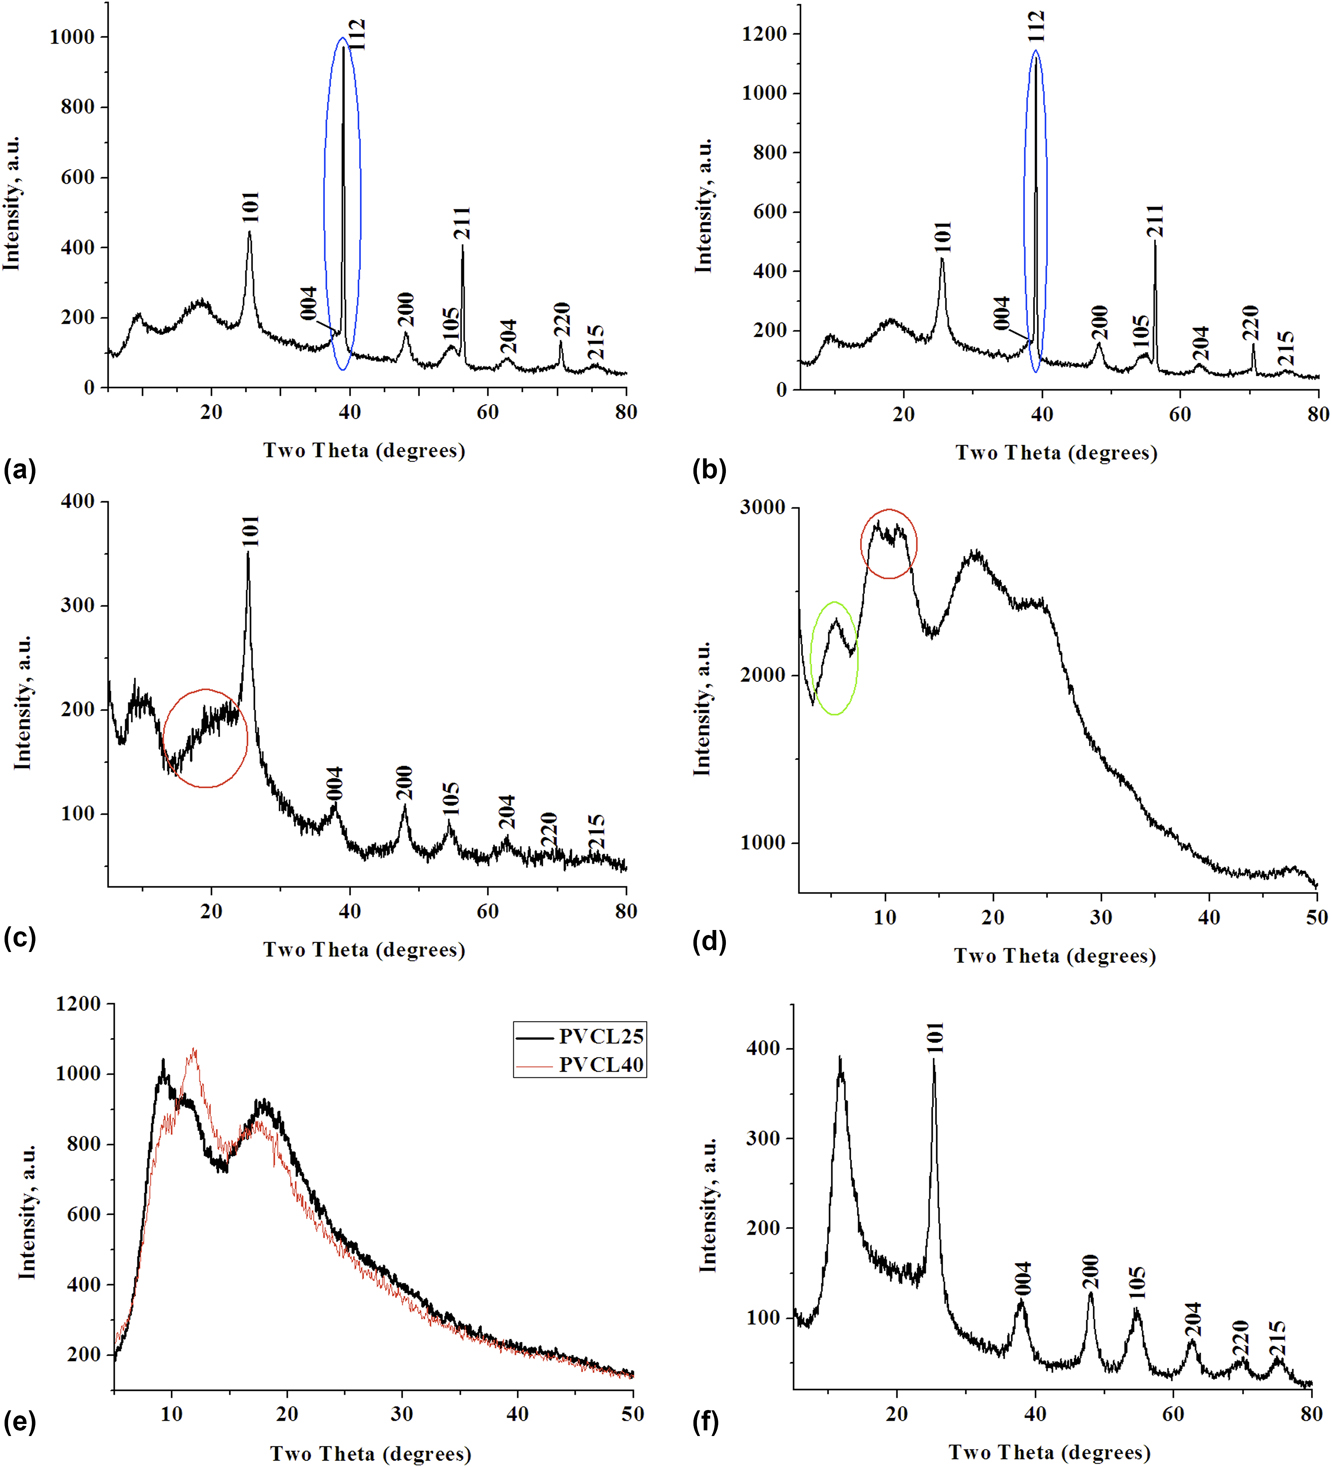
XRD patterns of (a) nanocomposite PVCL25/HF (2:1) (method 1), (b) nanocomposite PVCL40/HF (2:1) (method 1), (c) nanocomposite PVCL40/A (2:1) (method 1), (d) nanocomposite PVCL40/EP1 (2:1) (method 1), (e) PVCL25 and PVCL40 (200 rpm, 15 min, Ar) (method 2), and (f) nanocomposite PVCL40/HF (1:1) (100 rpm, 10 min, Ar) (method 2).

Powdered films of the starting PVCL25 and PVCL40 samples differ in the water content. Previously, it was shown that the water content in the PVCL40 is 1.6–2 times higher than that in the PVCL25. The PVCL25 and PVCL40 show endothermic effects at T = 80.8 and 87.2 °C on the DSC thermograms.Reference Chihacheva, Timaeva, Kuzґmicheva, Dorohov, Lobanova, Amarantov, Podbel’skiy, Serousov and Sadovskaya22 In solution, water molecules bind to the heterocycles of PVCL via hydrogen bondsReference Kirsh3 during the PVCL25 (coil) → PVCL40 (globule) transition. These water molecules are not removed from the globule upon drying under the above-mentioned conditions. It results in the difference in the water amount in PVCL25 and PVCL40. The specific surface of PVCL25 is larger than that of PVCL40 (S BET = 0.720 m2/g for PVCL25 and S BET = 0.534 m2/g for PVCL40) (Table I).
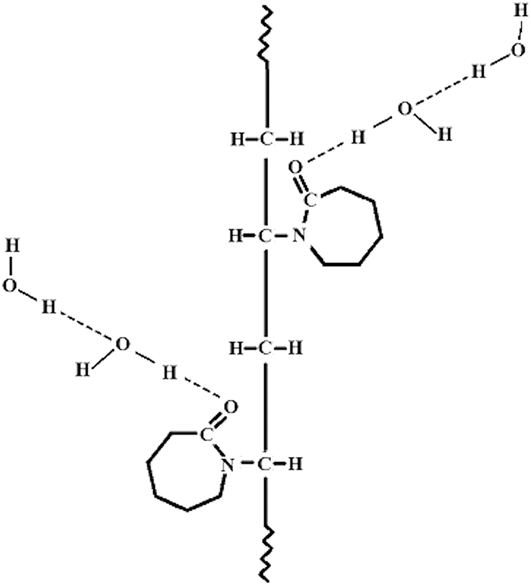
As follows from the XRD analysis, PVCL samples are amorphous. Besides, two peaks in the XRD patterns of PVCL25 and PVCL40 [Table I and Fig. S1(a)] have different characteristics [diffraction angle 2θ (°), interplanar spacing d (Å), intensity I (%)]. Thus, the intensity of the second XRD peak increases with respect to the first one and the peaks shift to larger diffraction angles in the XRD pattern of PVCL40 as compared with PVCL25 (Table I). The first peak at 2θ ∼ 9° in the XRD pattern of PVCL [Fig. S1(a)] is responsible for the polymer chain. The second peak at 2θ ∼ 18° is responsible primarily for the seven-membered heterocycle containing a polar amide group (–N–C=O), to which water molecules are attached (Fig. 2). This was also observed for the poly-N-vinylpyrrolidone.Reference Busselez, Arbe, Cerveny, Capponi, Colmenero and Frick27 This is confirmed by a change in the XRD pattern of PVCL40 compared to that of PVCL25. The water content in PVCL correlates with the average sizes of CSR, which are smaller for PVCL40. Thus, the higher the water content, the smaller the D value and, consequently, the larger the degree of amorphicity (Table I).
Interactions between PVCL and water molecules.Reference Kirsh3

Samples with TNP can be divided into two groups:
(i) Samples with anatase, HF (anatase), HK [anatase + X-ray amorphous hydrated titanium dioxide (HTD)] [Table I and Figs. S1(c)–S1(e)], and A (anatase), which were prepared by the sulfate method.Reference Kuzmicheva, Domoroshchina, Savinkina, Obolenskaya and Brown19 It should be noted that the XRD pattern of the reference anatase sample [a = 3.7844(6) Å, c = 9.513(2) Å] [Fig. S1(b)] shows three peaks at 2θ ∼ 38°. The XRD patterns of the anatase samples (A, HF, HK) [Figs. S1(c)–S1(e)] show only one diffraction peak at the corresponding angle regions. This fact attests to the possible nanosized anatase (samples with anatase as an example) → anatase (reference sample as an example) transition.Reference Kuzmicheva20 The sample with A [Table I and Fig. S1(c)] has a smaller crystallite size [D = 74(3) Å] and contains a larger number of water molecules (Fig. 2) compared to HK [D = 80(4) Å] and HF [D = 83(4) Å] (Table I). The crystallite size should be decreased with an increase primarily in the number of water molecules, adsorbed on the surface of anatase nanoparticles. These molecules are to a largely extent responsible for an increase in the percentage of amorphous component. In comparison with HF, HK has X-ray amorphous HTD with general formula TiO2−x(OH)2x × yH2O with y ∼ 1,Reference Dadachov17 which can be represented as a hydrate, acid phases of Ti(OH)4, H2TiO3, or H4TiO4. The hydrated form can be modified in anion-mixed (TiO)(HSO4)x(OH)y in the presence of acidic residues of sulfate synthesis. The HF and HK samples have approximately the same specific surface area, determined by BET (Table I).
(ii) Samples with the EP [Figs. S1(f) and S1(g)], which were also produced by the sulfate method.Reference Dadachov17,Reference Kuzmicheva20,Reference Vasilyeva, Kuzmicheva, Pochtar, Gainanova, Timaeva, Dorokhov and Podbel’skiy21 The EP has the TiO2−x·nH2O composition [probably, TiO2−x(OH)x·nH2O] containing OH and water on the nanoparticle surface.Reference Vasilyeva, Kuzmicheva, Pochtar, Gainanova, Timaeva, Dorokhov and Podbel’skiy21 The structure of the EP is a superstructure in relation to anatase with the unit cell parameters a ∼ a 0, c ∼ nc 0: a 0 and c 0 are parameters of the anatase tetragonal unit cell with possible quasilayered structure with water molecules in the interlayer space. The sample with EP2 (Table I) contains anatase, as evidenced by the XRD peak at 2θ ∼38° [Fig. S1(g)], which is a characteristic of anatase and is absent for the EP.Reference Dadachov17 The XRD patterns of the samples with EP1 and EP2 differ in the intensity of the XRD peak at 2θ ∼ 5° and its interplanar spacing [Table I, Figs. S1(f), and S1(g)]. The EP2 has the smallest specific surface area value (Table I) compared to other samples (HF and HK).
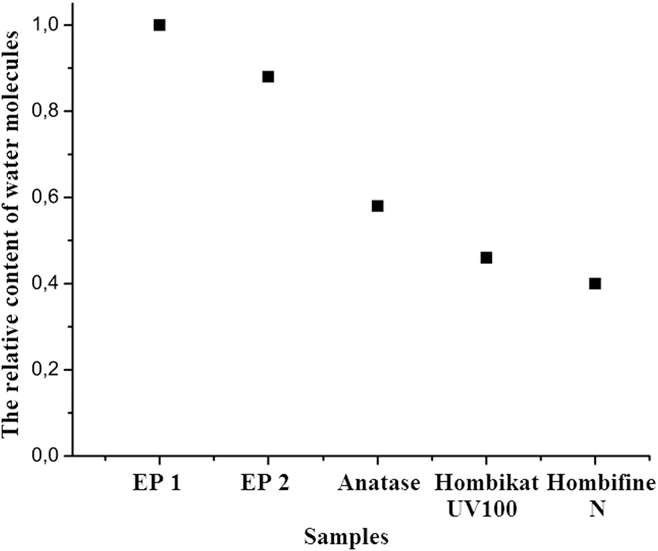
According to the DSC data (Fig. 3), the total water content in the sample with EP1 is larger than that in the sample with EP2. It is possible that there are also a large number of interlayer water molecules (structural or crystallization water), resulting in the shift of the XRD peak at 2θ ∼ 5°, a characteristic of the EP, to smaller diffraction angles in the XRD pattern of EP1 [Table I and Fig. S1(f)]. Samples with the EP have smaller sizes of CSR than samples with anatase (Table I). Therefore, the amount of adsorption water on the nanoparticles surface in EP is probably larger compared to anatase.
Relative content of water molecules in the samples under study (DSC data).

To sum up the results of the XRD study of the starting TNP, let us note that these samples differ in the composition (single-phase samples: A, HF, and EP1; two-phase samples: HK and EP2) and water content, which is higher in EP1. The amount of structural water is larger in EP1. The structural water (interlayer water in EP) on the nanoparticle surface is responsible for the degree of amorphicity of the phases. is responsible for variations in the intensity of the small-angle XRD peak and its shift (EP).Reference Vasilyeva, Kuzmicheva, Pochtar, Gainanova, Timaeva, Dorokhov and Podbel’skiy21
B. Nanocomposites PVCL/TNP. Method 1 The structural water
The XRD patterns of the PVCL25/TNP and PVCL40/TNP nanocomposites at any PVCL/TNP ratio show peaks assigned to PVCL and TNP (Figs. 1 and S2), i.e., the nanocomposites are mixtures of TNP and PVCL. It is quite natural that the intensity of two XRD peaks of PVCL increases with an increase in the PVCL content in the samples.
At any PVCL25/HF ratios, the XRD patterns show two systems of peaks of anatase: broadened XRD peaks (nanocrystalline anatase I) and narrow XRD peaks (nanocrystalline anatase II) with small [D = 45(2) Å] and large [D = 350(18) Å] sizes of CSR, respectively, calculated from the XRD peak at 2θ ∼ 38° [Fig. 1(a)]. The unit cell parameter c for nanocrystalline anatase II in PVCL25/HF (c = 9.07 Å) is substantially smaller than the corresponding parameter for the starting HF (Table I). It indicates the imperfections in anatase with the general composition Ti(O2−x□x) (□—vacancies). The value D = 75(4) Å determined from the reflection 101 (2θ ∼ 25°) of anatase in PVCL25/HF is smaller than that for the starting HF (Table I).
It should be noted that the (101) plane for anatase [(102) plane for EP] is more reactive compared to other planes due to the higher ratio of free to closed bonds.Reference Dadachov17 Hence, the surface with 101 (102) reflection is most suitable for active adsorption (probably due to the hydrogen bond formation) and other groups of atoms (in particular, OH), thus promoting the amorphization of nanoparticles. The XRD patterns of PVCL40/HF at ratios of 2:1 and 10:1 are similar to those of PVCL25/HF (composed of nanocrystalline anatase I and nanocrystalline anatase II) [Fig. 1(b)]. The XRD pattern of PVCL40/HF (1:1) shows the same system of XRD peaks of HF as was observed for the starting HF but with smaller sizes of CSR: D = 83(3) Å for HF and D = 72(4) Å for PVCL40/HF (1:1).
Only amorphization of anatase was observed for TNP in the PVCL25/A (2:1) [Fig. S2(a)] and PVCL25/HK (2:1) [Fig. S2(b)] nanocomposites. It is evident from the sizes of CSR: D = 59(3) Å for PVCL25/HK, D = 49(2) Å for PVCL25/A, D = 80(4) Å for HK, and D = 74(4) Å for A.
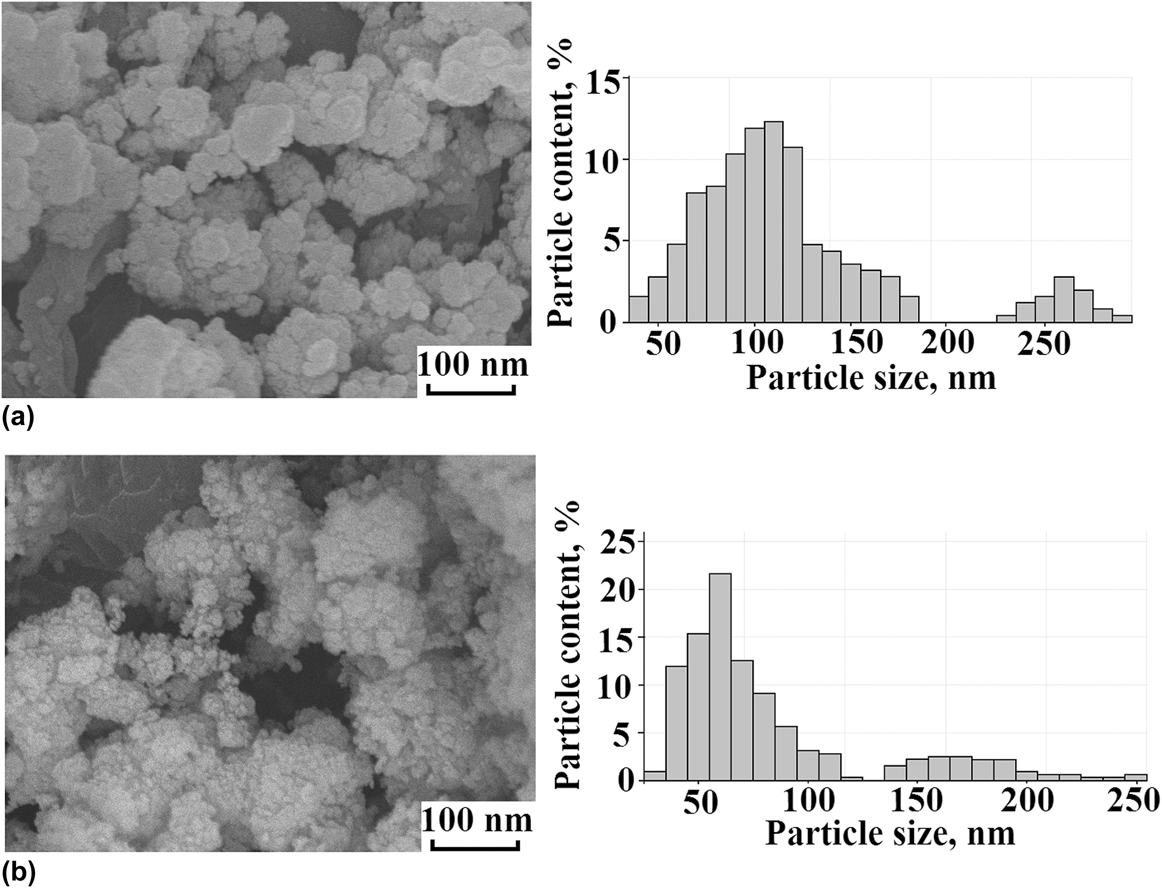
The samples with PVCL25/HF (2:1) contain nanoparticles of a larger size compared to PVCL40/HF (2:1) [Fig. 4(b)] and starting HF and PVCL25 (Table I). The PVCL40/HF (2:1) [Fig. 4(b)] and PVCL40 nanoparticles (Table I) are of comparable sizes, but they are larger than the HF nanoparticles. The PVCL40/HF nanocomposite contains more water molecules than PVCL25/HF; therefore, its particles have got more amorphous component and smaller size.
Images of the microstructure: (a) PVCL25/HF and (b) PVCL40/HF (method 1).

All the above-mentioned experimental facts can be explained by describing the composition of nano-anatase as TiO2−x(OH)x·pH2O with structural water in interstitial sites and adsorption water on the surface of nanoparticles in the PVCL/TNP nanocomposite. The sizes of voids in the anatase structure are comparable with the sizes of water molecules, ∼3 Å.Reference Kuzmicheva20,Reference Vasilyeva, Kuzmicheva, Pochtar, Gainanova, Timaeva, Dorokhov and Podbel’skiy21
Therefore, in the PVCL25 + HF system and, to a certain extent, in the PVCL40 + HF system, anatase undergoes partial crystallization (103, 004, 112 → “112”; 105, 211 → “211”; 116, 107, 220 → “220”)—nanocrystalline anatase I [TiO2−x(OH)x·pH2O] → nanocrystalline anatase II (possibly, the composition of TiO2−x) (1 effect of TNP).
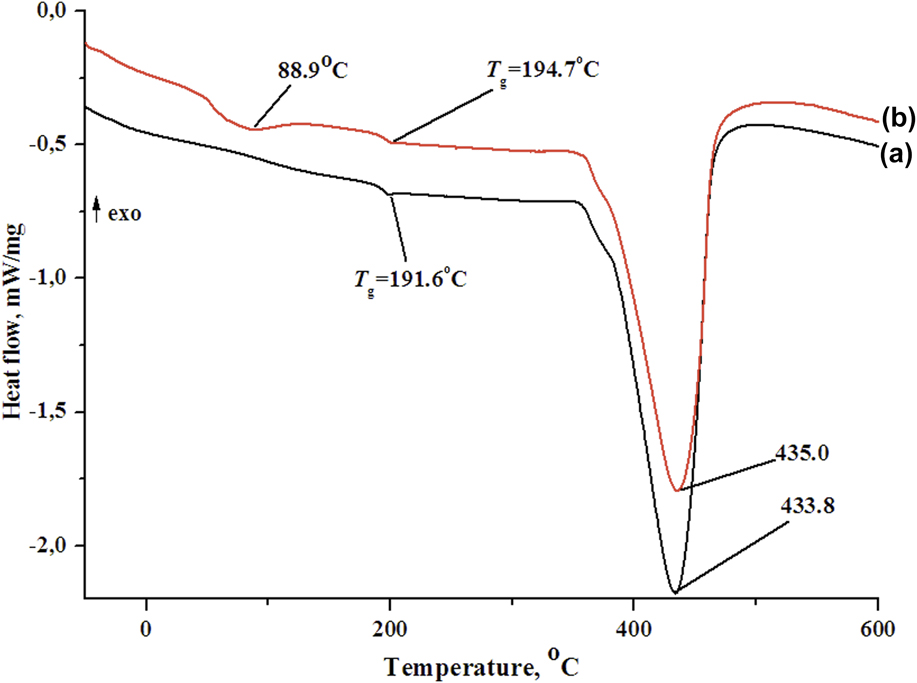
This conclusion is confirmed by the DSC data. After the removal of water during the first heating cycle to 600 °C, the PVCL40/HF kept a certain amount of water molecules (DSC data; the heat of the reaction proportional to the peak area is 25.7 J/g) [Fig. 5(b)]. This is not observed for the PVCL25/HF, which almost completely lost water under similar conditions [Fig. 5(a)].
DSC curves for (a) PVCL25/HF (2:1) and (b) PVCL40/HF (2:1).

This fact indicates that the water content in the PVCL40/HF nanocomposite is higher than that in the PVCL25/HF one, like in the starting PVCL40 and PVCL25, which is consistent with the IR spectroscopic data.
In PVCL/TNP nanocomposites with both HF and HK, the amount of water in the samples containing PVCL40 is larger than in those with PVCL25, like in the starting PVCL40 and PVCL25 samples. Quite a different situation is observed for nanocomposites with A. Thus, the water content in PVCL25/A is, on the contrary, higher than that in PVCL40/A due to a larger amount of water in the starting A sample than in HF and HK (Fig. 3).
A comparison of the IR spectra of starting HF and HK samples and nanocomposites containing these TNPs (Fig. S3) allows us to reveal additional bands in the spectra of composites. The most intense band at 1635 cm−1 being assigned to vibrations of the amide group (Amide I band). Besides, this spectral region shows bending bands of water at 1620 cm−1. These bands are observed in the spectra of HF and HK, and they overlap with the Amide I band in the spectra of nanocomposites. The position of the stretching band of water in the spectrum of HF substantially differs from that in the spectrum of the nanocomposite (3408 and 3460 cm−1, respectively). This is indicative of different hydrogen bond energy in these materials. The frequency of the absorption band in the spectrum of HK is virtually identical to that in the spectrum of its composite (3420 cm−1). A comparison of relative intensities of these bands and TiO stretching bands (at 550–580 cm−1) demonstrates that the moisture content in nanocomposites with both HF and HK is substantially higher than that in the starting TNP.
The glass transition temperature (T g) of PVCL25/HF (T g = 191.6 °C) is slightly lower than that of PVCL40/HF (T g = 194.7 °C), PVCL25 (T g = 194.0 °C), and PVCL40 (T g = 193.0 °C). The difference in the water content has only a slight effect on the T g of high-molecular-weight polymer PVCL (Fig. 5).
Two different effects are observed for PVCL in the XRD patterns of the PVCL/TNP nanocomposites:
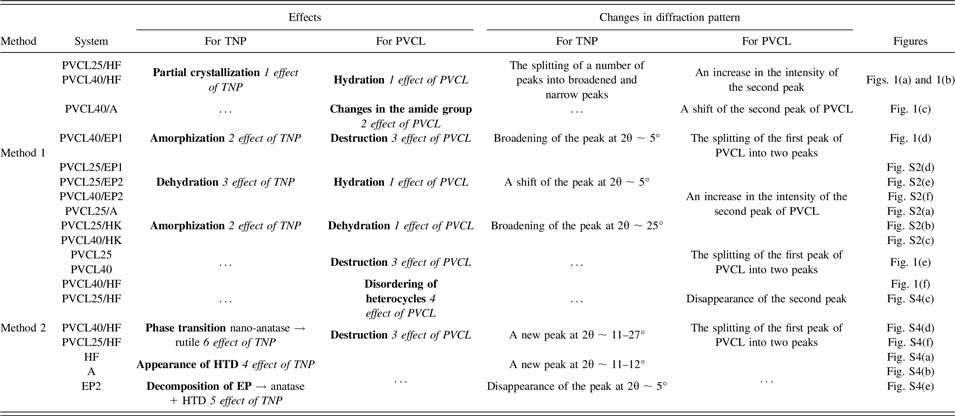
(i) A decrease in the intensity of the second peak of PVCL (dehydration of PVCL) for PVCL25/A, PVCL25/HK, and PVCL40/HK [Figs. S2(a)–S2(c) and Table II] and its increase for PVCL25/HF, PVCL40/HF (hydration of PVCL) [Figs. 1(a), 1(b), and Table II] (1 effect of PVCL) due to the different number of water molecules attached to the heterocycles of PVCL via hydrogen bonds.
The observed effects of PVCL and TNP on diffraction patterns.

This is confirmed by the IR spectra. Thus, an increase in the amount of water in PVCL/HF [Fig. S3(a)], PVCL/HK [Fig. S3(b)], and PVCL/A samples leads to an increase in the relative intensity of the ν(H2O) band and to broadening of the absorption band at 1639 cm−1 (C = O stretching vibration, Amide I band);
(ii) A substantial shift of the second XRD peak to larger angles (PVCL40/A) [Fig. 1(c)] (2 effect of PVCL). A similar situation was observed for the PVCL film, fabricated using microwave processing of the solution, which has an effect on polar amide groups of organic compounds only.Reference Perreux and Loupy28,Reference Vasilakos and Magalhaes29 The disappearance of stretching C–C vibrations (1481, 1463, and 1425 cm−1) in the caprolactam ring was determined using IR-spectroscopy.
The XRD patterns of PVCL/EP nanocomposites (1:2) display the effects considered above, as well as new effects compared to the starting phases [Tables I and II, Figs. 1(d), and S2(d)–S2(f)]:
(i) An amorphization of EP1 and EP2 in the PVCL25/EP1, PVCL25/EP2, PVCL40/EP1, and PVCL40/EP2 composites (decrease in the size of CSR, determined by the peak at 2θ ∼ 5°) (2 effect of TNP);
(ii) A shift of the small-angle XRD peak of the TNP toward higher diffraction angles for all the PVCL/EP nanocomposites [Figs. 1(d), S2(d)–S2(f), and Table II] (3 effect of TNP) attributed to a decrease in the amount of interlayer (structural) water in the TNP due to the capture of water by PVCL molecules;
(iii) An increase in the intensity of the second peak of PVCL [PVCL25/EP1—Fig. S2(d), PVCL25/EP2, PVCL40/EP2—Figs. S2(e), S2(f), and Table II] due to the attachment of a different number of water molecules to PVCL25 and PVCL40 from the TNP (hydration of PVCL, 1 effect of PVCL);
(iv) Splitting of the first XRD peak of PVCL into two peaks of equal intensity (PVCL40/EP1) [Fig. 1(d)] (3 effect of PVCL) due to the destruction of PVCL.
Therefore, the shear deformation (method 1) leads to changes in the XRD pattern of the TNP in the PVCL/TNP caused by amorphization, partial crystallization of HF, and a change in the amount of structural water molecules in the EP. The two effects of PVCL observed in the XRD pattern of the nanocomposites are associated with the different amount of water in the starting PVCL25, PVCL40 and TNP and the different number of attached water molecules that are present in the starting TNP. The nature of the 3 effect of PVCL (splitting of the first XRD peak) in the XRD pattern of the PVCL/TNP is considered below.
C. Nanocomposites PVCL/TNP. Method 2
Mechanical milling gives rise to new effects in the XRD patterns of the starting samples (TNP and PVCL), as well as of TNP and PVCL in PVCL/HF nanocomposites (other nanocomposites are not considered in the present study) [Figs. 1(f) and S4(a)–S4(f)]. The manifestation of effects depends on the conditions of the process:
(i) The appearance of the characteristic XRD peak of HTD at 2θ ∼ 11–12° in the XRD patterns of TNP: HF [Fig. S4(a) and Table II], A [Fig. S4(b)], and EP2 [Fig. S4(e)] (4 effect of TNP). The smallest amount of HTD was found in HF after the mechanical activation under atmospheric air (400 rpm, 60 min, air), whereas the formation of HTD was not observed after the mechanical activation of A under Ar (200 rpm, 15 min, Ar). The formation of X ray amorphous HTD, the composition of which can be described as TiO2−x(OH)2x × yH2O with y ∼ 1,Reference Dadachov17 after the mechanical milling (Method 2) of the starting A (air), EP2 (Ar), and HF (Ar and partially air), can be accounted for mechanical activation of TNP. A similar effect can be achieved using thermal treatment of original HTD at 150 °C. It is known that the temperature in the place of the impact of balls during mechanical milling can reach more than 100 °C.Reference Baláž, Achimovičová, Baláž, Billik, Cherkezova-Zheleva, Manuel Criado, Delogu, Dutková, Gaffet, José Gotor, Kumar, Mitov, Rojac, Senna, Streletskii and Wieczorek-Ciurowa13 In our case, the formation of the HTD phase from the amorphous shell of TNP nanocrystallite took place;
(ii) The decomposition of starting EP2: EP → anatase + HTD (5 effect of TNP) under atmospheric air [Fig. S4(e) and Table II].
(iii) The splitting of the first XRD peak of the starting PVCL25 and PVCL40 in Ar and under atmospheric air into peaks with different intensity ratios (3 effect of PVCL, Fig. 1(e) and Table II). The mechanical milling of PVCL40 (400 rpm, 60 min, air) leads to an increase in the intensity of the first XRD peak compared with the second one, the splitting of the first XRD peak being absent after milling at a higher frequency (400 rpm, 5 min, Ar);
(iv) A complete disappearance of the second peak of PVCL in the XRD pattern of PVCL40/HF [Fig. 1(f) and Table II] (4 effect of PVCL), probably caused by disordering of the PVCL heterocycles of PVCL (discussed bellow). At the same frequency (400 rpm), the intensity of the first XRD peak of PVCL25 increases with an increase in the duration of the process and reaches a maximum value at τ = 20 min for PVCL25:HF = 1:1 (Ar) [Fig. S4(c)]. Then, the difference in the intensity of the first and second XRD peaks diminishes as the time of the process increases regardless of the atmosphere. The same tendency was observed for PVCL25:HF = 2:1 (τ = 10 min, Ar) and PVCL40:HF = 1:1 (τ = 20 min, Ar) [Fig. S4(f)];
(v) The splitting of the first XRD peak of PVCL (3 effect of PVCL) and the appearance of a peak at 2θ ∼ 27°, which, most likely, belongs to rutile, i.e., PVCL25/HF (2:1) undergoes the nano-anatase → rutile phase transition (6 effect of TNP) [Fig. S4(f) and Table II]. A similar phase transition was found for PVCL40/HF (1:1) [Fig. S4(d) and Table II].
Solid state CP/MAS 13C NMR spectroscopy was used to establish changes in the structure of PVCL that occurred as a result of mechanical milling. For all the samples studied (PVCL25, 400 rpm, 60 min, air and PVCL25/HF (2:1), 400 rpm, 30 min, Ar), 7 resonance peaks are characteristic for 13C NMR spectra (here are not given). The spectra of the samples are identical. It can be concluded that all the above-mentioned changes in the PVCL structure are too small that NMR spectroscopy is not sensitive to them.
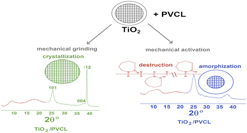
A shear deformation and mechanical activation have different effects on the starting PVCL and PVCL in nanocomposites. The splitting of the first XRD peak of both starting PVCL and PVCL in nanocomposites can be attributed to the mechanical destruction of PVCL. It results in a decrease in the MW due to the cleavage of chemical bonds after ball milling in air or under oxygen or nitrogen atmosphere.Reference Kaneniwa and Ikekawa14 The difference in the intensity ratio of the split XRD peaks is apparently attributed to different ratios of the MWs of low-molecular-weight mechanical cracking products. The MW of PVCL calculated by equation (3) confirms the destruction of PVCL: for PVCL25: (0.96–1.10) × 106 Da, (0.8–1.04) × 106 Da (200 rpm, 15 min, Ar); for PVCL40: (0.14–0.32) × 106 Da (400 rpm, 25 min, air), 0.13 × 10⁶ Da (400 rpm, 60 min, air).
The elimination of low-molecular-weight products is a side reaction during the mechanical destruction of polymers. The more rigid the polymer chains, the more probable and faster (other conditions being equal) their cleavage because of the hindrance of the polymer chain segments’ movement, conformational changes in the chains, and redistribution of internal strains. Another important feature is the cleavage site, at which the disordering of the PVCL heterocyles occurs. The branch points (junction points) in branched polymers are the most probable strain concentration sites, i.e., mechanocracking occurs via a free-radical mechanism accompanied by the cleavage of the –C–C– bond nearest to the amide group (Fig. 2).Reference Kaneniwa and Ikekawa14 This mechanism is probably implemented in PVCL40/HF (1:1, 100 rpm, 10 min, Ar, Fig. 1(f) and Table II), PVCL25/HF and PVCL40/HF [1:1, 400 rpm, 20 min, Ar, Figs. S4(c) and S4(d)] nanocomposites (method 2).
Therefore, a dry mixing and grinding of the starting PVCL and TNP (method 1) and the fine pulverization of the mixture characterized by the use of the high-frequency mechanical treatment (mechanical activation, method 2) result in different changes in the PVCL:TNP system.
IV. CONCLUSIONS
The present study demonstrates that different types of mechanochemical treatment of the starting samples (PVCL, TNP) and PVCL/TNP nanocomposites lead to significant changes in the composition and structure of compounds. The results obtained can be useful in considering the possibility of using these nanocomposites and explaining the observed properties. It is shown that the X-ray diffraction method is a very powerful and independent tool for detecting and describing changes in the composition and structure of nanocomposites.
Supplementary Material
To view supplementary material for this article, please visit https://doi.org/10.1557/jmr.2018.55.
ACKNOWLEDGMENT
We thank the Ministry of Education and Science of the Russian Federation for support of this work (No. 4.1069.2017/PCh.; 2017-2019).