During conversation, we tend to align our linguistic behaviors with those of our interlocutors at various levels of structure: vowel productions (Babel, Reference Babel2010), lexical choices (Brennan & Clark, Reference Brennan and Clark1996), conceptual representations (Garrod & Anderson, Reference Garrod and Anderson1987), speech styles (Giles & Powesland, Reference Giles and Powesland1975), and syntactic structures (Bock, Reference Bock1986). Decades of research in linguistics and psychology has investigated the mechanisms and causes underlying linguistic alignment. In part due to different theoretical approaches across fields and subfields, multiple lines of research have been pursued in parallel. Research in psycholinguistics has tried to understand alignment in terms of transient activation of mental representations that correspond to recently processed materials (Pickering & Garrod, Reference Pickering and Garrod2004) or as a consequence of implicit learning processes (Bock & Griffin, Reference Bock and Griffin2000; Chang, Dell, & Bock, Reference Chang, Dell and Bock2006; Jaeger & Snider, Reference Jaeger and Snider2013). Research in social psychology and sociophonetics, on the other hand, has attributed alignment to social factors, for example, imitating as a means of managing interpersonal distance (Balcetis & Dale, Reference Balcetis and Dale2005; Giles & Powesland, Reference Giles and Powesland1975).
The current study seeks to contribute to the integration of these two lines of research by investigating the joint and potentially automatic influence of social and cognitive factors on syntactic priming, a type of alignment in which speakers reuse recently experienced syntactic structures (Bock, Reference Bock1986; Weiner & Labov, Reference Weiner and Labov1983). We focus specifically on the English dative construction, which can be realized as either a double object (DO) structure (e.g., give the boy a book) or a prepositional object (PO) structure (e.g., give a book to the boy).
The investigation of linguistic alignment as a social phenomenon has focused in large part on strategic interactional processes and less on the role of potentially automatic aspects of social perception and cognition. Listeners tend to prefer speakers who are similar to themselves (e.g., Smith, Brown, Strong, & Rencher, Reference Smith, Brown, Strong and Rencher1975). Thus, becoming more similar to an interlocutor would seem to serve as a means of enhancing liking, intimacy, trust, or other social goals. This idea forms the basis for the communicative accommodation theory (Giles & Powesland, Reference Giles and Powesland1975), which, as it developed, expanded to incorporate theories of antialignment (or divergence), in which speakers become less similar to an interlocutor to indicate disaffiliation (Bourhis, Giles, Leyens, & Tajfel, Reference Bourhis, Giles, Leyens, Tajfel, Giles and St. Clair1979; Doise, Sinclair, & Bourhis, Reference Doise, Sinclair and Bourhis1976).
In a recent study, Balcetis and Dale (Reference Balcetis and Dale2005) investigated the effect of interpersonal relationship differences on syntactic alignment and found evidence consistent with such social interactional accounts. Participants performed a semi-interactive task with a confederate who was instructed to behave in various positive or negative ways. In one experiment, participants showed greater syntactic alignment with the confederate for active, passive, and PO dative structures when the confederate acted nice rather than mean, as communicative accommodation theory suggests. In a second experiment, participants showed greater alignment for active, passive, and DO dative structures when the confederate acted annoyed rather than patient, which Balcetis and Dale (Reference Balcetis and Dale2005) proposed was evidence of alignment as a possible repair strategy for difficult interactions.
Work in psycholinguistics has focused less on social effects and more on the cognitive mechanisms underlying language production that drive alignment. One view proposes that recently comprehending or producing a linguistic structure temporarily increases the activation level of the corresponding representation in memory relative to the representation of alternative structures (e.g., the DO vs. PO dative), which in turn increases the probability of reusing that same structure when subsequently selecting between these alternatives (Dell, Reference Dell1986; Pickering & Branigan, Reference Pickering and Branigan1998). Another view is that syntactic alignment is the result of an implicit procedural learning mechanism that tunes the operations involved in sentence production to recent experience (e.g., Bock & Griffin, Reference Bock and Griffin2000; Chang et al., Reference Chang, Dell and Bock2006; Jaeger & Snider Reference Jaeger and Snider2013; see also Reitter, Keller, & Moore, Reference Reitter, Keller and Moore2011).
In both of these psycholinguistic accounts, linguistic alignment has typically been characterized as largely automatic and not under control of the speaker. According to one of the strongest formulations of this idea, linguistic alignment is caused by an “automatic perception-behavior link'' (Pickering & Garrod, Reference Pickering and Garrod2004:188), in which merely perceiving another's linguistic behavior (e.g., DO or PO dative use) automatically increases the likelihood that one will subsequently engage in that same behavior. This idea is inherited from research on subconscious nonlinguistic alignment such as alignment of foot rubbing or body posture (Bargh & Chartrand, Reference Bargh and Chartrand1999; Chartrand & Bargh, Reference Chartrand and Bargh1999; Dijksterhuis & Bargh, Reference Dijksterhuis, Bargh and Zanna2001). Support for an automatic view of alignment, though not necessarily the strong perception-behavior link, comes in part from the pervasiveness of alignment phenomena across contexts and people. For syntactic alignment in particular, robust effects have been found in laboratory tasks (Bock, Reference Bock1986) and natural conversations (Gries, Reference Gries2005; Jaeger, Reference Jaeger2006; Reitter, Hockenmaier, & Keller, Reference Reitter, Hockenmaier and Keller2006; Snider, Reference Snider2008); in adults (Bock, Reference Bock1986), children (de Marneffe, Grimm, Arnon, Kirby, & Bresnan, Reference de Marneffe, Grimm, Arnon, Kirby and Bresnan2013), and people with amnesia and certain aphasias (Ferreira, Bock, Wilson, & Cohen, Reference Ferreira, Bock, Wilson and Cohen2008; Hartsuiker & Kolk, Reference Hartsuiker and Kolk1998); and in both spoken language (Bock, Reference Bock1986) and written language (Pickering & Branigan, Reference Pickering and Branigan1998; see, for example, Gries, Reference Gries2005, for comparison of priming effects in written and spoken corpora). Furthermore, syntactic alignment transfers across tasks (Kaschak, Reference Kaschak2007), across modalities (e.g., from comprehension to production; Branigan, Pickering, & Cleland, Reference Branigan, Pickering and Cleland2000), and across languages (Bernolet, Hartsuiker, & Pickering, Reference Bernolet, Hartsuiker and Pickering2007; Loebell & Bock, Reference Loebell and Bock2003; Salamoura & Williams, Reference Salamoura and Williams2007). Given this range of contexts, which includes noninteractive and otherwise socially impoverished tasks, it appears that syntactic alignment is at least partially an automatic response to recent experience, rather than a strategic interactional phenomenon.
Comparatively little attention has focused on how psycholinguistic accounts can be integrated with evidence for socially mediated linguistic alignment. At least prima facie, the claim for automaticity (cf. Pickering & Garrod, Reference Pickering and Garrod2004:188) and, in particular, the perception-behavior link seems to predict that social perception should not affect the degree of alignment (see Krauss & Pardo, Reference Krauss and Pardo2004, for further discussion). That is, in conflict with findings just cited, exposure to a particular linguistic structure should have the same influence on a listener's later behavior, regardless of the listener's social perceptions related to this exposure. One solution to this apparent conflict is that “automatic'' responses can be “inhibited when they conflict with current goals and purposes'' (Pickering & Garrod, Reference Pickering and Garrod2004:214; referring to Dijksterhuis & Bargh, Reference Dijksterhuis, Bargh and Zanna2001:29). The proposal of an inhibition mechanism provides a descriptive account for findings of socially mediated linguistic alignment, but leaves open the question of how and to what extent social perception affects the automatic processes underlying alignment.
Implicit learning accounts (Bock & Griffin, Reference Bock and Griffin2000; Chang et al., Reference Chang, Dell and Bock2006; Jaeger & Snider, Reference Jaeger and Snider2013) similarly provide little insight into this question. Any of these learning accounts theoretically allow for alignment to be mediated by attention and, for example, its effects on memory encoding (although we are not aware that this has been discussed previously). We return to this possibility in the discussion, focusing on how it could be extended to capture social modulations of alignment. Still, existing learning accounts do not predict socially mediated alignment. Furthermore, none of the dominant psycholinguistic accounts of linguistic alignment predict conditions under which exposure to a particular structure either leads to antialignment (i.e., becoming less similar to an interlocutor) or induces no change in behavior (i.e., neither alignment nor antialignment).
What is lacking is an integrated theory of linguistic alignment accounting for alignment that is both socially mediated and automatic. There appears to be broad consensus that some alignment can happen strategically, such as language switching to signal group distinctiveness (e.g., Bourhis & Giles, Reference Bourhis, Giles and Giles1977), but the influence of automatic social cognition on linguistic alignment is largely unknown. For syntactic alignment in particular, our current focus, few studies have investigated the effects of social perception and attitude. The motivation for the current study was to take a modest first step toward narrowing the gap between these two fields, thereby contributing to the future development of a comprehensive theory of socially-mediated linguistic alignment.
The current study had three goals. First, we aimed to advance the sociocognitive study of linguistic alignment by investigating the influence of social factors on syntactic alignment even in socially impoverished, noninteractive tasks. Previous work has focused mostly on phonetic and prosodic alignment (but see Balcetis & Dale, Reference Balcetis and Dale2005; Branigan, Pickering, Pearson, McLean, & Brown, Reference Branigan, Pickering, Pearson, McLean and Brown2011; Tamminga, Reference Tamminga2014). Babel (Reference Babel2010) found that spontaneous phonetic vowel alignment in a word shadowing task was mediated by implicit attitudes toward social groups represented by the shadowed talker. Abrego-Collier, Grove, Sonderegger, and Yu (Reference Abrego-Collier, Grove, Sonderegger and Yu2011) found that participants lengthened their voice onset times after listening to a recorded talker with unusually long voice onset times, with the size of this shift mediated by the content of the talker's narrative and the listeners' degree of liking for the talker. In these studies, participants had no expectation of interaction with the talker whose speech triggered alignment. These findings suggest that social modulations of linguistic alignment may be due in part to automatic influences on information processing, independent of interactional strategy, though further research is clearly needed. By extending the sociocognitive approach to syntactic alignment, we aim to further the current understanding of the mechanisms that drive alignment.
With respect to this first goal, we investigated two hypotheses: that greater perceived standardness of a speaker's accent and greater perceived interpersonal similarity (induced here by shared political beliefs between the speaker and participants themselves) would both lead to increased syntactic alignment in a noninteractive task. These predictions follow from the previous literature that seems to suggest, in general, that positive affect is associated with more alignment. We hold some caution, however, because both Balcetis and Dale (Reference Balcetis and Dale2005) and Abrego-Collier et al. (Reference Abrego-Collier, Grove, Sonderegger and Yu2011) reported evidence of alignment increases due to at least partially negative attributes (annoyance and unpleasantness, respectively). These results, though compatible with strategic interactional accounts (Giles & Powesland, Reference Giles and Powesland1975), could also indicate that in some cases positivity may be offset by other factors, such as increased attention caused by deviation from the expected, or stronger encoding in procedural memory due to affect.
Second, we aimed to expand the investigation of social factors associated with alignment. We did this by assessing individual differences along a wide range of social dimensions and testing each of these dimensions as potential predictors of alignment. Specifically, we isolated and orthogonalized multiple aspects of social perception through a mixture of direct manipulation (i.e., exposure to ideologically-charged diatribes) and individual differences that emerge over a large sample of participants. Going beyond previous work, we investigated whether participants' conflict management styles influence syntactic alignment. Conflict management involves both personality components, such as a general predisposition to compromise, and behavioral components, namely the interactional activity that plays out in a conflict situation (see Thomas, Reference Thomas1992). If the effects of interpersonal similarity and liking on linguistic alignment observed in previous works are indeed socially mediated and, in particular, if such social mediation involves more than a direct response based on social perception, we would expect conflict management styles to also be evident in the extent to which speakers align with others linguistically.
Third, we aimed to develop a simple and easy-to-use paradigm for future studies that allows rapid large-scale investigations of socially mediated alignment across a socially heterogeneous sample. To this end, we modified a traditional psycholinguistic priming paradigm. Traditionally, participants read silently (or listen to a standard-sounding speaker read aloud) a set of socially flat prime sentences (e.g., The teacher gave the boy a book, as a DO prime sentence), and then participants perform a picture description task to test for effects of recent syntactic experience on subsequent syntactic choices. We modified this paradigm by adding three social elements. First, the exposure materials were read in one of three socially different accents (standard-sounding White US English, standard-sounding Black US English, and Mandarin-accented English). Second, the exposure materials were ideologically rich—comprising stereotypically left- or right-leaning political diatribes—in an effort to influence participants' perceptions of similarity to the speaker. Third, after the exposure phase and picture description task, participants completed a comprehensive set of questionnaires regarding their own political and linguistic ideologies, their conflict management styles, and their assessment of the speaker. Once these evaluative responses were checked to ensure predicted response patterns based on the design manipulations (e.g., native speakers rated as less accented than the non-native speaker; speakers rated as politically liberal following the left-leaning passages), these responses were used as individual difference measures and tested as predictors of syntactic alignment. That is, we tested whether syntactic alignment rates were mediated by participants' own social perceptions, rather than by the factorial design manipulations. This approach was intended to capitalize on natural variation in the sample along the relevant social dimensions and to avoid the assumption that our a priori design manipulations had a singular influence on participants' perceptions.
An effect of any social factors on syntactic alignment would provide support for an integrated sociocognitive account in which the likelihood of one aligning their linguistic behaviors with the behaviors of another is influenced by both recent exposure to a particular structure and the social context of this exposure.
METHOD
Participants
A total of 340 participants (187 male, 153 female) were recruited via Amazon's crowdsourcing platform Mechanical Turk over the course of 32 days. Participants were paid $2 each. Participants ranged from 18 to 64 years of age (mean = 27.9, SD = 10.0). All but 1 reported finishing high school, with 246 having attended or completed college and 47 having attended graduate school.
Stimulus materials
Exposure stimuli
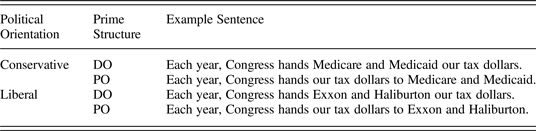
Ten dative sentences were embedded in an ideologically charged diatribe about the US government's domestic spending practices. Twelve versions of the passage were created by crossing exposure syntax (DO vs. PO) with political orientation (stereotypically liberal vs. conservative stance on government spending), resulting in four written scripts, and then each of these four scripts were animatedly read aloud by three speakers. Table 1 shows example dative sentences from the four scripted passages.
Example dative sentences from the four written versions of the exposure passage

Three speakers, all young women, were selected with three different English accents: White-sounding, perceptually standard Midland; African American–sounding, perceptually standard Midland; and strongly Mandarin accented. This accent manipulation was intended to influence participants' perceptions of the passage speaker's linguistic standardness. It has been documented that although standard varieties of African American English exist (Garner & Rubin, Reference Garner and Rubin1986; Hoover, Reference Hoover1978; Rahman, Reference Rahman2008), White evaluators appear to position these varieties on a continuum with less standard African American varieties, rather than as unequivocally standard (Bishop, Reference Bishop1979). Thus, we expected participants to perceive the White speaker as the most standard-sounding of the three speakers, the African American speaker as comparatively less standard, and the Mandarin-accented speaker as the least standard.
The political orientation manipulation was accomplished by altering only the recipient noun phrase for each of the 10 dative sentences in the passage so the speaker was complaining about Congress giving money to support either “liberal” groups and services or “conservative” groups and services (see Table 1). Appendix A contains the full version of each passage. Although testing for political influences on syntactic alignment might be interesting in its own right, the main purpose of this manipulation was to influence perceived interpersonal similarity and to establish a situation in which participants were ideologically invested, despite the intentional lack of interaction in the experimental design.
Each participant was instructed to listen carefully to the passage and to form an image of the speaker, as they would be required to describe this speaker later in the experiment. A given participant heard only one version of the passage, read by a single speaker.
Response prompts
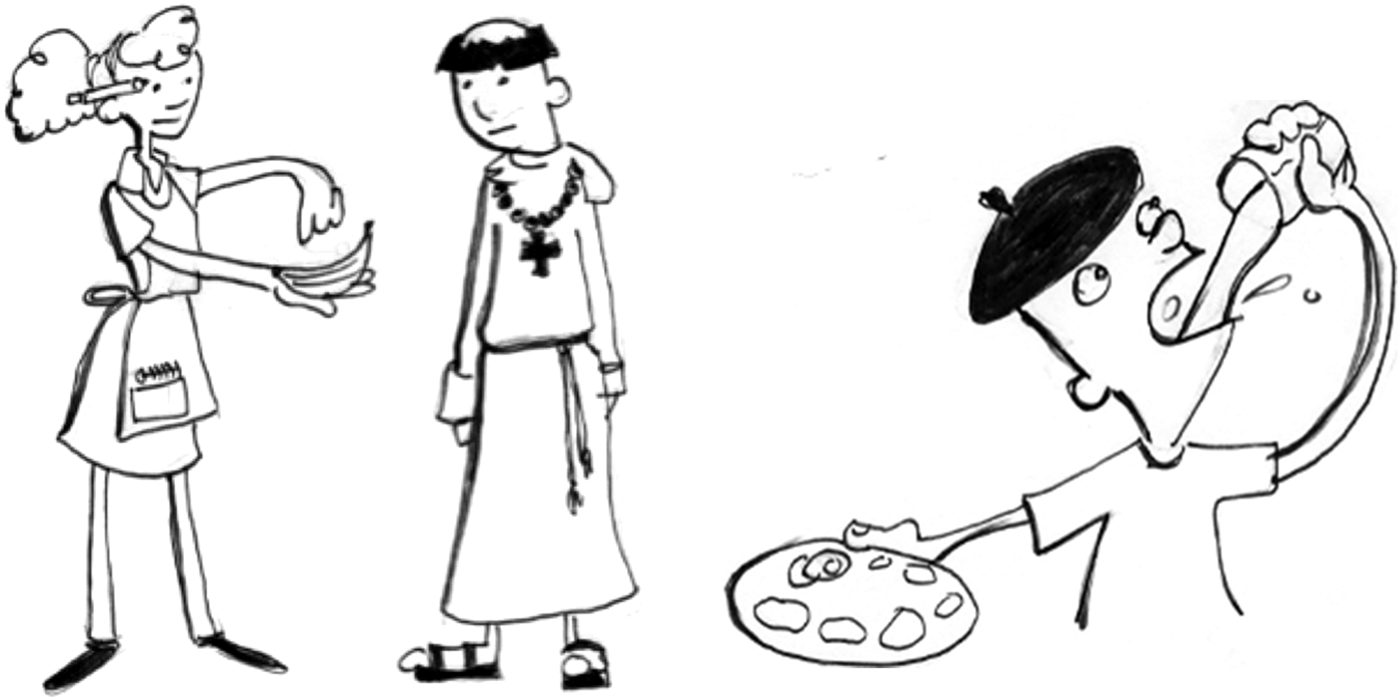
Immediately after the exposure passage, participants were asked to describe 10 simple line drawings (see Figure 1).Footnote 1 Four of the drawings were designed to elicit a dative structure, depicting two individuals exchanging an object, such as a waitress giving a banana to a monk. These were the critical trials used to assess the influence of dative experience during the exposure phase on participant's subsequent dative use. The remaining six drawings served as fillers and depicted single characters performing simple actions, such as a painter drinking a glass of water. The filler drawings were designed to avoid descriptions containing dative structures. All drawings were pretested to confirm that the depicted characters and actions were readily identifiable and that only targets elicited dative descriptions (see Slevc, Reference Slevc2011).
Example line drawings for the picture description task. Targets were designed to elicit descriptions containing a dative structure (e.g., The waitress is giving the monk a banana). All line drawings were generously provided by Bob Slevc.
We are interested in the effect of the passage participants heard during the exposure phase on syntactic behavior during the response phase. We used cartoon images instead of realistic images to mark a clear disconnect between the exposure and response phases, thus establishing a conservative test of syntactic alignment across tasks in a noninteractive paradigm. Furthermore, we chose a small number of critical trials (4) to minimize the opportunity for self-priming effects (i.e., the fact that responses to later trials will be influenced in part by responses on earlier trials).
Survey instrument
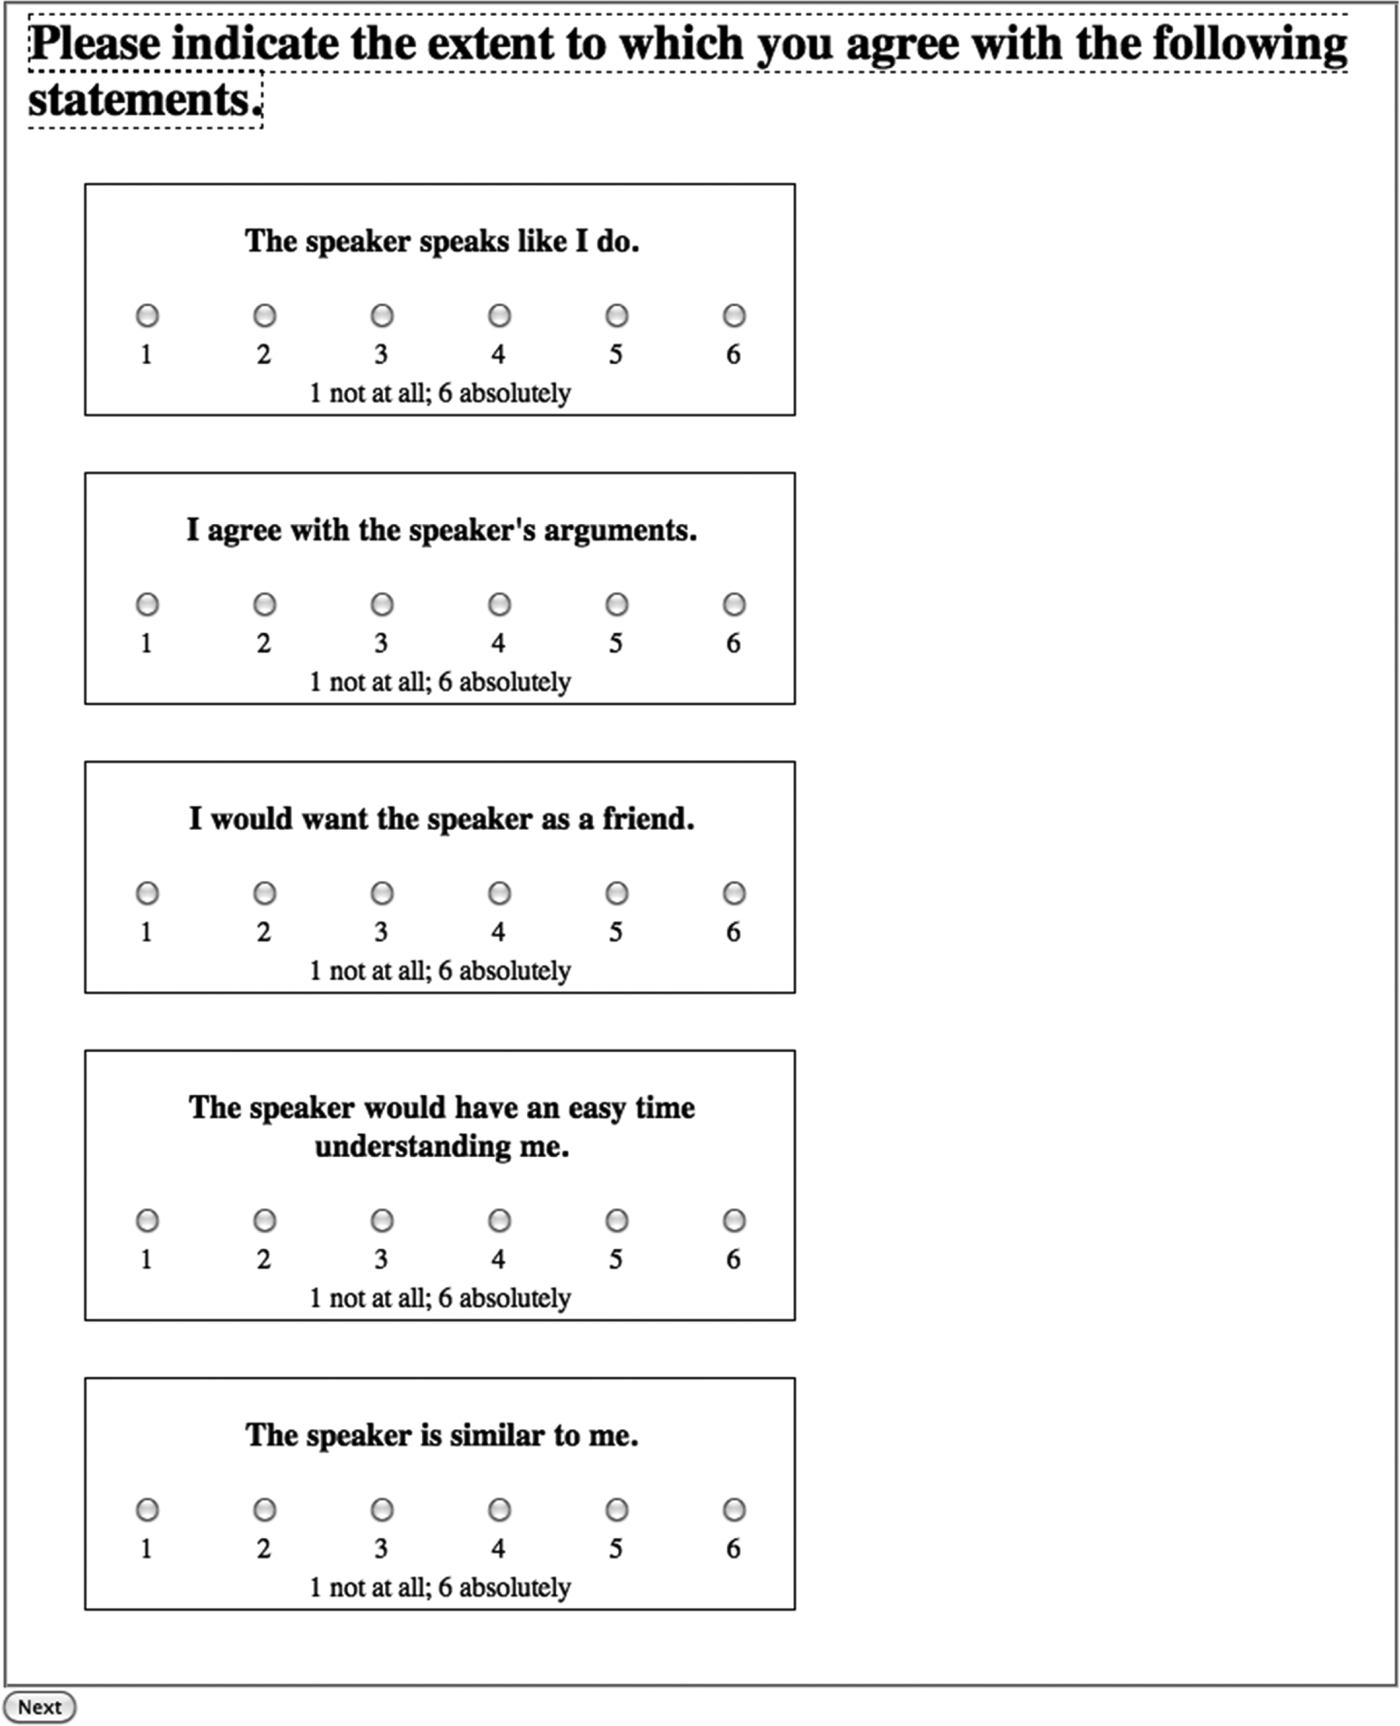
In the final phase of the study, participants completed a survey containing 36 Likert-scale social evaluation items, as well as basic demographic items (age, sex, level of education). All Likert-scale items were phrased as statements, and participants indicated the extent to which they agreed with each statement on a 6-point scale (6 = I absolutely agree; 1 = I do not agree at all). The full set of Likert-scale survey items is presented in Tables 2 and 3.
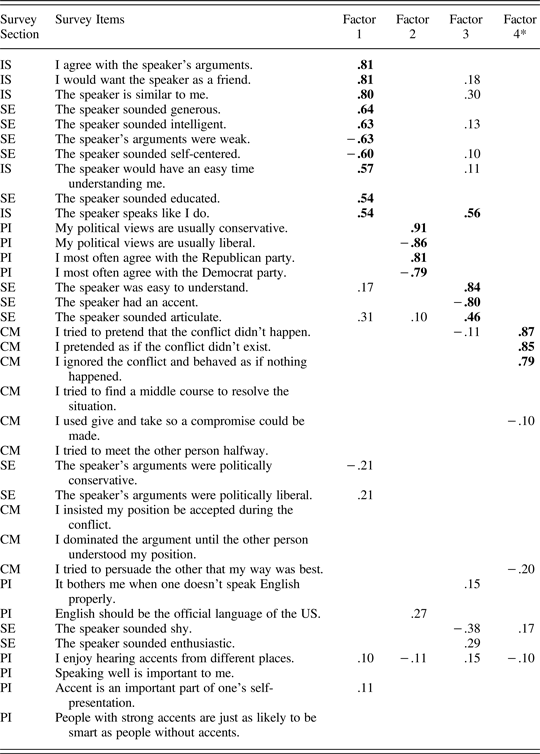
Factors 1 to 4 from factor analysis on the post-experiment survey responses
Note: Loading values > |.4| are in bold as these items contribute most to the meaning of a factor. Loading values < |.1| are omitted for clarity. Survey section is coded as SE (speaker evaluation), PI (participant ideology), IS (participant's perceived interpersonal similarity), and CM (participants' conflict management style).
*Factor 1: Interpersonal similarity; Factor 2: Participant's political ideology; Factor 3: Speaker's accent standardness; and Factor 4: Participant avoids conflict.
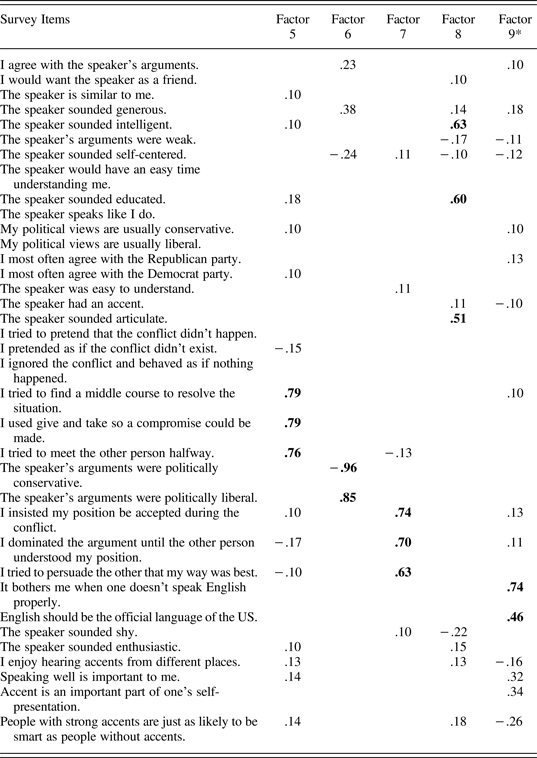
Factors 5 to 9 from factor analysis on the post-experiment survey responses
Note: Loading values > |.4| are in bold as these items contribute most to the meaning of a factor. Loading values < |.1| are omitted for clarity.
* Factor 5: Participant compromises during conflict; Factor 6: Speaker's political ideology; Factor 7: Participant dominates during conflict; Factor 8: Speaker sounds smart; and Factor 9: Participant's accent ideology.
The survey was divided into four sections. The first section was a social evaluation of the passage speaker, modeled in part on the social evaluation instrument proposed by Zahn and Hopper (Reference Zahn and Hopper1985). Participants rated the passage speaker's accentedness, political ideology, persuasiveness, intelligence, and agreeableness. In the second section of the survey, participants self-reported their political ideology and standard language ideology (e.g., English should be the official language of the US; It bothers me when one doesn't speak English properly). The third section of the survey assessed participants' perceived similarity to the passage speaker (e.g., The speaker is similar to me; I agree with the speaker's arguments). In the fourth section of the survey, participants were asked to recall a recent conflict situation with someone they did not know well, and then to indicate the degree to which a series of statements about conflict management strategies matched their response in that situation (e.g., I pretended as if the conflict didn't exist; I tried to meet the other person halfway). The conflict management items were modified from DUTCH (Dutch Test for Conflict Handling) developed by Van de Vliert (Reference Van de Vliert1997) (see De Dreu, Evers, Beersma, Kluwer, & Nauta, Reference De Dreu, Evers, Beersma, Kluwer and Nauta2001, for discussion of the psychometric properties of this instrument). As illustrated by the example survey items, the survey was designed to contain multiple conceptually related items for each dimension of social evaluation. Thus, when analyzing the survey data, it was possible to locate sets of items with correlated responses (e.g., The speaker had an accent; The speaker was easy to understand; The speaker sounded articulate) and to combine each of these sets into an aggregate index of the underlying dimension of social evaluation (e.g., accent standardness).
Procedure
The entire experiment was conducted online using Amazon's Mechanical Turk. Example screen shots of the web-based design are presented in Appendix B. The three phases of the experiment (the exposure phase, the verbal picture description task, and the survey) were packaged together as a “HIT,” a single job that Turkers complete for payment. Before beginning the HIT, interested Turkers were presented with a description of the task and an electronic consent form.
Turkers who agreed to participate were randomly assigned to 1 of the 12 experimental conditions or to a baseline (no exposure phase) condition. Participants in the experimental conditions completed all three phases of the experiment. Participants in the baseline condition received no exposure passage; instead, baseline participants completed the picture description task and a reduced version of the survey containing only the self-report ideology and conflict management items (i.e., everything but questions related to the exposure phase). The picture description data from the baseline condition provided base rates of DO and PO usage for each target picture against which we evaluated syntactic preferences in the experimental conditions.
For participants in the experimental conditions, the exposure passage was presented as a passive listening task with the following instructions: “Listen carefully to the speech, and form an impression of the speaker and their argument. You will be asked to describe them later.” Each of the 12 versions of the exposure passage was approximately 1 min long, and participants heard only one version. The picture description task began immediately after the passive listening task (or immediately following initial instructions for participants in the baseline condition). The 10 line drawings comprising this task were presented individually in a fixed pseudorandom order. Participants were instructed to describe each drawing aloud in a single sentence and to avoid using pronouns (e.g., She gave him the banana), as dative preferences are significantly influenced by pronominality and the relative weight of the theme and recipient noun phrases (Arnold, Wasow, Losongco, & Ginstrom, Reference Arnold, Wasow, Losongco and Ginstrom2000; Bresnan, Cueni, Nikitina, & Baayen, Reference Bresnan, Cueni, Nikitina, Baayen, Bourne, Kramer and Zwarts2007; de Marneffe et al., Reference de Marneffe, Grimm, Arnon, Kirby and Bresnan2013). Verbal descriptions were recorded via the participant's web browser (details of this procedure are given in the next section). For the survey, each section was presented on a different webpage, and it was impossible to navigate back to previous pages after completing a given section. This navigation restriction was intentional to prevent later questions from affecting participants' responses to earlier questions.
The Mechanical Turk setup
To record participants' verbal picture descriptions, we used the WAMI (Web-Accessible Multimodal Applications) audio recorder, a JavaScript program that accesses the user's microphone and saves audio to a remote server (McGraw, Gruenstein, Varenhorst, & Sutherland, Reference McGraw, Gruenstein, Varenhorst and Sutherland2012).Footnote 2 The backend of this experiment was two Python WSGI (Web Server Gateway Interface) scripts. One script, backed by a SQLite database, assigned each participant to one of the experimental conditions and performed simple list balancing by assigning new participants to the list with the fewest current participants. This script also saved the last completed trial number for each participant and returned them to the next trial if they reloaded the webpage. The second script saved .wav files sent by WAMI to a local server. The frontend consisted of the Flash-based WAMI interface along with JavaScript code to send the .wav files from WAMI to the WSGI script, to advance trials, and to present and validate the survey page-by-page. As part of the initial instruction portion of the experiment, participants completed a microphone check to ensure that our web-interface was able to access their microphone input.
Coding and exclusion criteria
Responses for each picture description trial were saved to individual sound files and transcribed. Picture descriptions were coded as “DO” if they contained a double object dative, as “PO” if they contained a prepositional object dative, or as “other” if no dative structure was used in the picture description. Descriptions coded as “other” were excluded from analysis (16%), as were descriptions containing pronouns (2.1%) or multiple dative structures (<1%). Data from seven participants were lost due to these criteria. Furthermore, 32 participants were excluded from the analysis: 3 were non-native speakers of English; 5 failed to follow instructions; and 24 provided no recordings during the picture description task (due to technological failure or intentional skipping of this task). The data for analysis contained 301 participants evenly balanced across the 12 experimental conditions and the baseline condition (22 to 25 participants per condition).
RESULTS
We first present an analysis on the entire dataset, independent of social factors, to demonstrate that the novel web-based paradigm replicates basic DO and PO alignment effects, independent of social mediators. We then present an analysis of the post-experiment survey ratings, which used exploratory factor analysis to locate correlated survey items. Finally, we investigate the extent to which these latent social variables mediate the basic syntactic alignment effects.
Basic alignment results
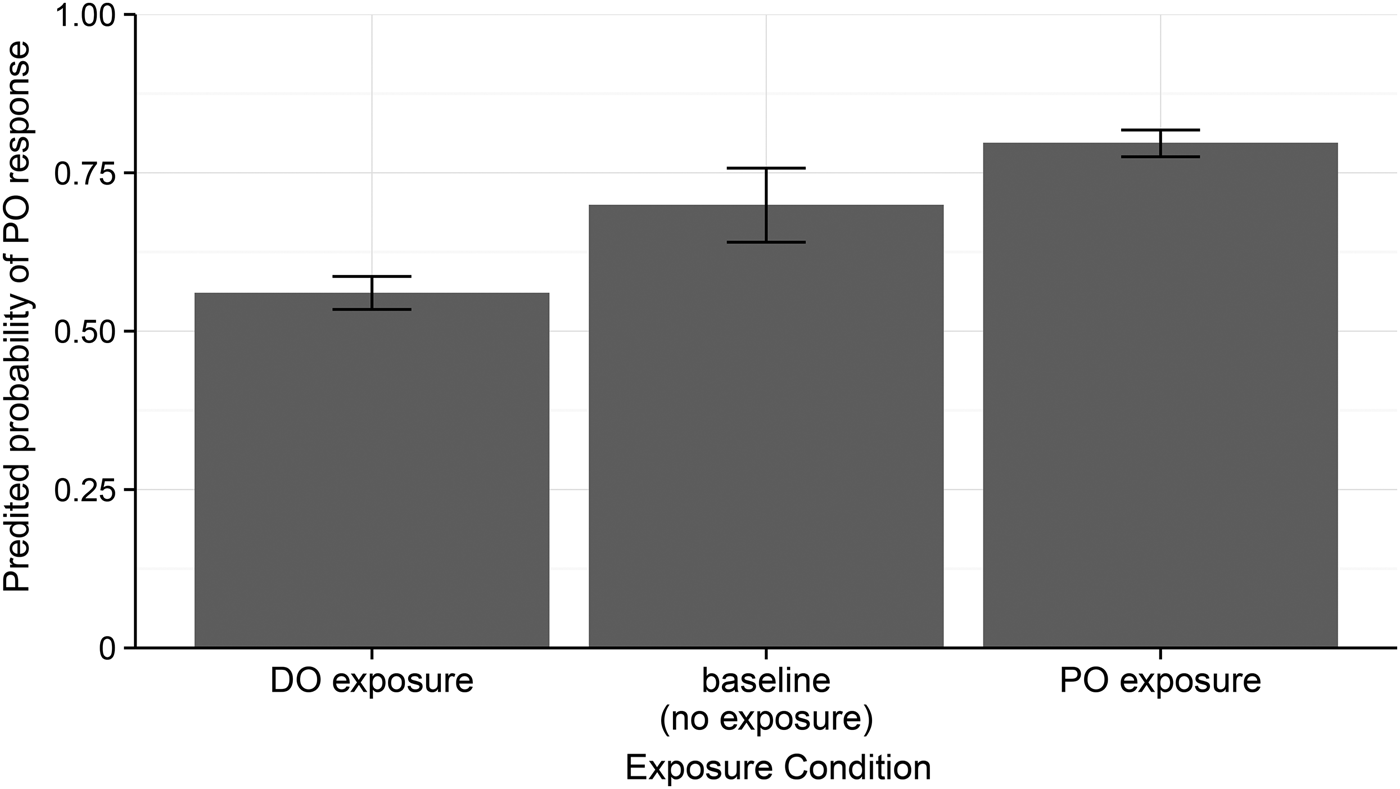
A mixed logit regression analysis (for introductions, see Jaeger, Reference Jaeger2008; Johnson, Reference Johnson2009) was conducted to assess whether the web-based paradigm yielded basic syntactic alignment. This analysis predicted participants' response syntax (DO response = 0; PO response = 1) based on exposure condition (DO exposure, PO exposure, baseline/no exposure), which was manipulated between subjects. Exposure condition was coded with sum contrasts to reduce collinearity, and the maximal by-subject and by-item random effects structure justified by the design was included to avoid anticonservativity. Figure 2 shows the mean predicted probability of a PO response by exposure condition (i.e., the mixed logit model's estimate of the likelihood of participants describing a picture using the PO dative structure in each condition). Relative to the grand mean PO usage rate, participants produced significantly more PO structures in the PO exposure condition (β = .87, z = 3.6, p < .001), and significantly fewer PO structures in the DO condition (β = –.97, z = –4.1, p < .001). These findings indicate that participants consistently aligned their dative productions with the structure they heard during the exposure passage.Footnote 3
Model-predicted probability of PO response by exposure condition. Error bars denote nonparametrically bootstrapped 95% confidence intervals on subject-wise condition means.
Survey results
Having established basic syntactic alignment, we turn now to the survey data to locate social variables that may mediate alignment rates. Exploratory factor analysis was performed on responses to the 36 Likert-scale survey items from the subset of participants in the experimental, rather than baseline, conditions (n = 277). This dimension reduction routine was used to locate correlated responses across all four sections of the survey (evaluation of the passage speaker, participants' self-report of their ideologies, participants' perceived similarity to the speaker, and participants' conflict management style) and to combine these correlated responses into aggregate measures of latent social variables (e.g., perceptions of the speaker's accent standardness, perceived interpersonal similarity).Footnote 4
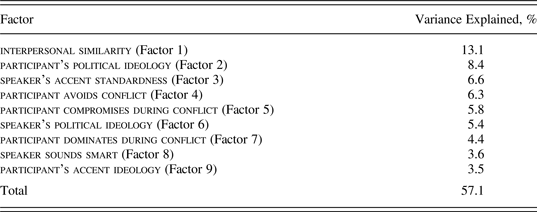
One common challenge with factor analyses is choosing a cutoff criterion for the inclusion of factors. Although these analyses are becoming increasingly common in sociolinguistic research (Tagliamonte, Reference Tagliamonte2012), there seem to be no established criteria in this literature for making the cutoff decision. For that reason, we lay out our approach to this decision problem in detail in Online Appendix C (the online appendix can be viewed at http://cambridge.journals.org/LVC). We used conservative and principled criteria advocated in the statistical literature—a combination of parallel analysis and the Kaiser criterion—to determine the number of factors to be returned by factor analysis. These criteria indicated that a nine-factor model had the greatest explanatory power for the rating data. Tables 2 and 3 show the loading values for each of the nine factors. Larger loading (absolute) values indicate that a variable has more influence on a factor. Table 4 shows the proportion of variance in ratings explained by each factor.
Percentage of variance in survey responses explained by each of the nine factor analysis factors
The interpersonal similarityFootnote 5 factor warrants comment, as it comprised a fairly broad range of survey items. As shown in Table 2, five of these survey items were explicitly phrased to capture dimensions of perceived similarity: I agree with the speaker's arguments; I would want the speaker as a friend; The speaker is similar to me; The speaker would have an easy time understanding me; and The speaker speaks like I do. The other survey items that strongly loaded onto the interpersonal similarity factor traditionally reflect perceptions of another's warmth and dynamism (e.g., The speaker sounded generous). These latter items were perhaps linked to perceived similarity via positive self-regard: participants viewed themselves as more similar to speakers that they evaluated positively. Alternatively, participants may have given more positive evaluations to speakers who sounded like themselves.
Experimental manipulations and participants' perceptions
Thus far, we have established that the novel web-based paradigm led to significant syntactic alignment across experimental conditions, relative to baseline, and we have located a set of latent social factors explaining participants' social perceptions, based on analysis of participants' survey ratings. Before testing whether these social factors predict alignment rates, we first check whether our experimental manipulations of the passage speaker's accent and political orientation had the desired effect on participants' social perceptions.
Speaker accent standardness
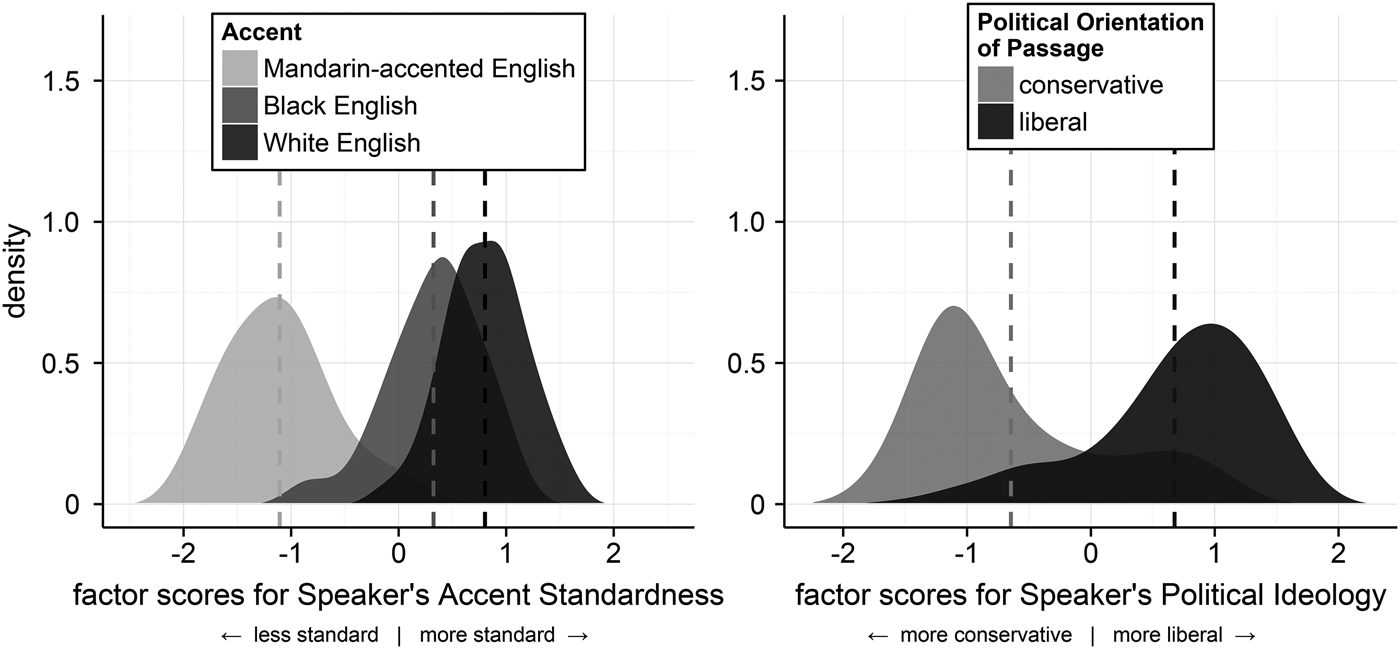
The accent manipulation (between subjects) was designed to influence participants' perceptions of the passage speaker's linguistic standardness. An ordinary linear regression model revealed that the accent manipulation strongly predicted factor scores for speaker's accent standardness (R 2 (274) = .77, p < .001). As Figure 3 shows, the non-native Mandarin-accented female was rated significantly less standard than the Black English female was (β = –1.4, t = –22.0, p < .001), and the White English female was rated significantly more standard than the Black English female was (β = .48, t = 7.3, p < .001). Thus, the accent manipulation resulted in the expected three-way standardness distinction.
Density distributions showing ratings of the speaker's accent standardness by accent (left) and ratings of the speaker's political ideology by political orientation of the exposure passage (right). A Gaussian kernel density estimator with a bandwidth of 1.25 was used to calculate each distribution. Vertical lines indicate distribution means.
Interpersonal similarity and political ideology
Participants in the experimental conditions heard a passage that conveyed either a stereotypically liberal or conservative ideology on government spending. This political orientation manipulation (between subjects) was intended to influence participants' perceived similarity to the passage speaker by evoking an ideological (mis)match between participants and the passage speaker. A linear regression model revealed that the political orientation of the exposure passage indeed had the intended effect on participants' perception of the speaker's political ideology (R 2 (275) = .45, p < .001). The passage speakers were rated significantly more liberal after the liberal passage than after the conservative passage (β = 1.32, t = 15.1, p < .001) (see Figure 3). Thus, participants were sensitive to the ideological content of the prime passage.
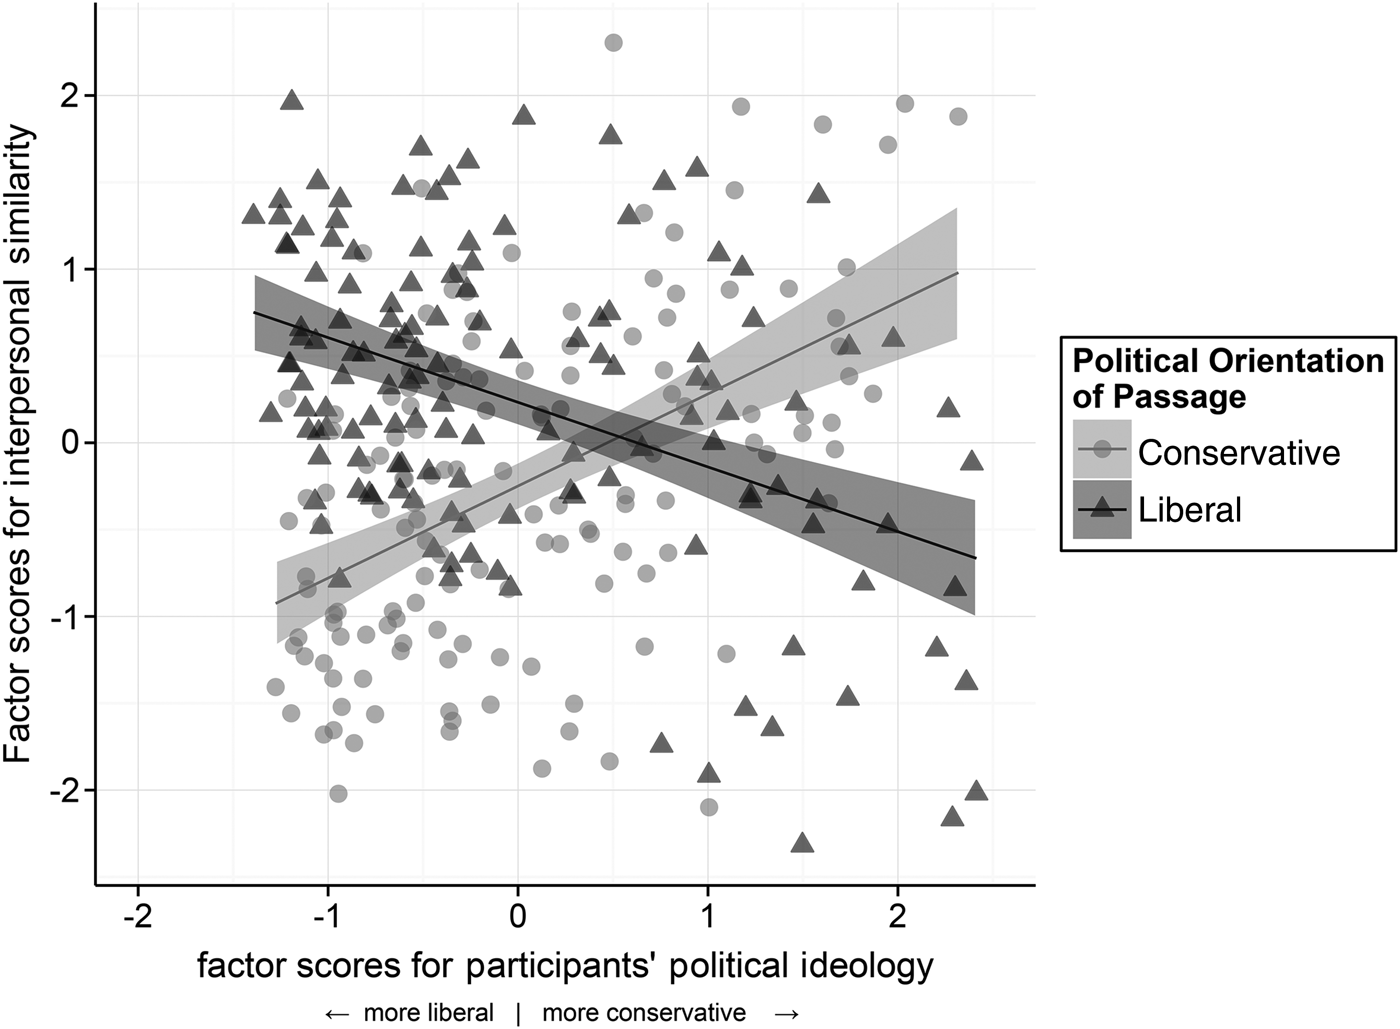
Furthermore, the combination of participants' own political ideology and the political orientation of the prime passage had the expected effect on interpersonal similarity ratings. Participants who self-identified as politically conservative perceived themselves to be less similar to the speaker of a liberal exposure passage and more similar to the speaker of a conservative passage, whereas participants who self-identified as liberal showed the reverse (see Figure 4). A linear regression model of interpersonal similarity ratings by participant political ideology and the political orientation of the exposure passage revealed a significant cross-over interaction (β = –.92, t = –8.8, p < .001), indicating that interpersonal similarity ratings between participants and the passage speaker were based in part on political ideological agreement.
Manipulation check for whether perceived interpersonal similarity was influenced by political ideological agreement between participants and the passage speakers. Due to the direction of factor loadings, positive values for participants' political ideology indicate a more conservative ideology and negative values indicate a more liberal ideology.
Social modulations of syntactic alignment
The analyses so far have demonstrated overall syntactic alignment in the data, identified latent social factors explaining participants' social perceptions, and confirmed that these social factors were meaningfully related to the experimental manipulation of the exposure context. With these results in hand, we can now investigate how social factors mediate syntactic alignment.
A mixed logit regression analysis was performed on the data from the experimental conditions (baseline data excluded). The dependent measure was a binary variable coding whether the response syntax during picture description matched (1) or mismatched (0) the dative structure heard during exposure. We began with a full model and then performed a step-wise “best-path” reduction procedure, removing interactions before main effects, to locate the simplest model that did not differ significantly from the full model in terms of variance explained (hereafter, the “best” model; for the trade-offs of this approach, see Harrell, Reference Harrell2001). The full model contained fixed effects for exposure syntax (DO vs. PO), the nine social factors obtained from factor analysis, and all two-way interactions between exposure syntax and these social factors. The resulting total of 19 parameters was well within the recommended upper bound given the distribution of DO and PO responses (cf. references in Jaeger, Reference Jaeger, Bender and Arnold2011). Each model contained by-subject and by-item random intercepts, with the maximal random slope structure justified by the experimental design, namely, a random slope for exposure syntax by items. Factorial predictors were sum contrast coded, and all numeric predictors were centered.
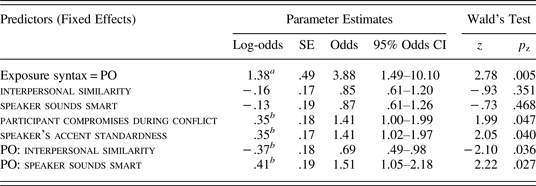
Table 5 summarizes the best model, which contained fixed effects for exposure syntax, speaker's accent standardness, participant compromises during conflict, interpersonal similarity, speaker sounds smart, and the two-way interactions between exposure syntax and the latter two social factors. Coefficients are reported in log-odds (the space in which logit models are fitted to the data) and odds (elogit(p)). Significant positive log-odds estimates indicate increased log-odds (and hence increased probabilities) of a matching response during picture description (for further introduction, see Jaeger, Reference Jaeger2008; Johnson, Reference Johnson2009).
Summary of the best mixed logit model for social influences on syntactic alignment
Notes: For each effect, we report the coefficient estimate (in log-odds and odds), its standard error, and Wald's z statistic, which tests whether a coefficient is significantly different from 0 given the estimated standard error (SE). 95% confidence intervals (CI) are reported for the odds ratio.
ap < .01.
bp < .05.
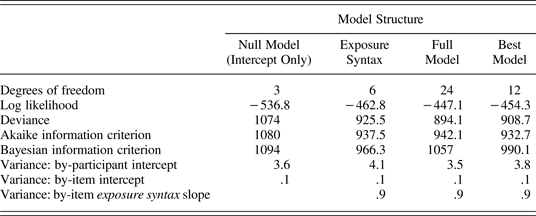
Table 6 shows model fit statistics for the full model (containing all predictor variables), the best model, and two further reduced models: (1) the null model, containing only the intercept term as a predictor, and (2) a model containing only exposure syntax as a predictor (i.e., no social factors). Log-likelihood comparisons revealed that the best model did not differ significantly from the full model in terms of the amount of variance explained (χ 2(12) = 14.5, p = .2), while providing a significantly better fit than either the null model (intercept-only: χ 2(9) = 164.9, p < .001) or the exposure syntax only model (no social factors: χ 2(6) = 16.86, p < .01). Thus, participants' dative use during picture description is best explained by the joint influence of recent syntactic exposure and social factors related to the context of this exposure.
Model fit statistics for the null, exposure syntax only, full, and best models
Note: Degrees of freedom equals the intercept term plus the number of predictors, the two random effects (for participants and items), and the by-item random slope for exposure syntax (if included).
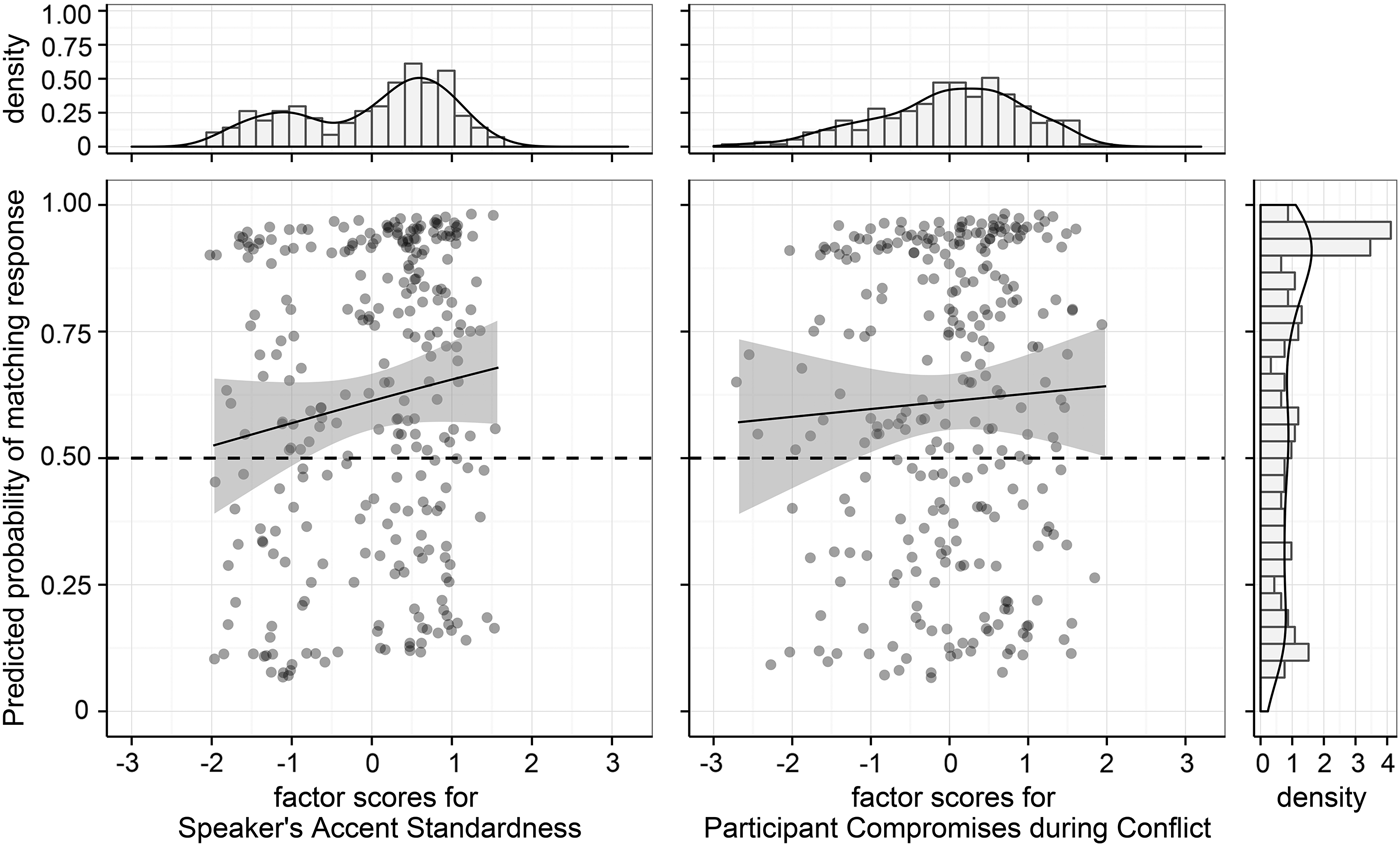
Consistent with our prediction about accent variation, participants showed greater alignment overall when listening to a speaker who they perceived to speak with a standard accent (the main effect of speaker's accent standardness in Table 5). Furthermore, participants who preferred compromise as a conflict management style showed greater alignment than participants who preferred not to compromise (the main effect of participant compromises during conflict). These two main effects are visualized in Figure 5.
Mixed logit model predictions for main effect social modulations. Points indicate subject-wise means over predicted probabilities. Regression lines indicate binomial best-fit curves, with the error ribbons denoting 95% confidence intervals on subject-wise means. Dashed lines indicate chance level for matching the passage speaker's dative structure. Histograms indicate the distribution of data along each dimension of interest.
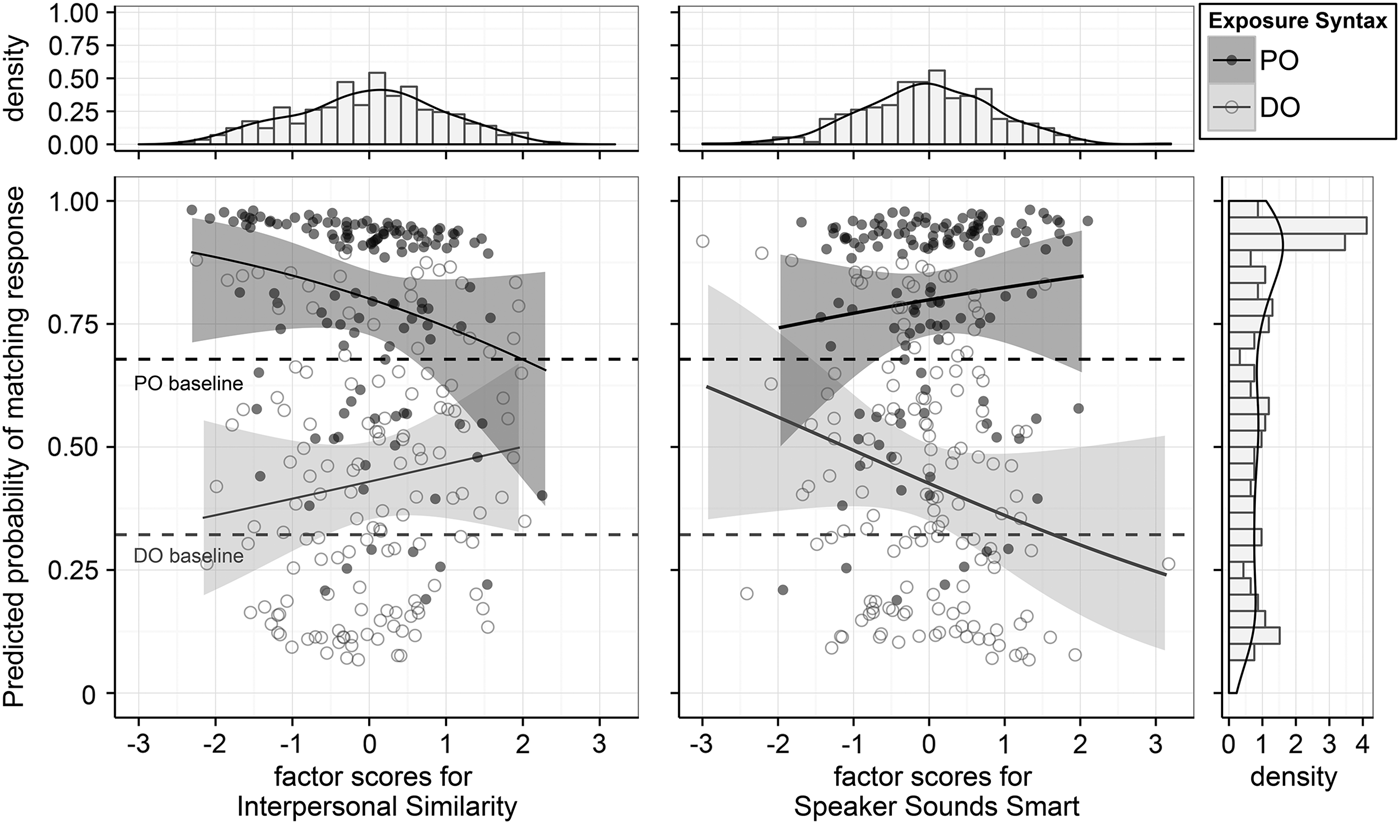
A significant negative interaction was found between exposure syntax and interpersonal similarity. The negative interaction indicates that the slope of the similarity effect on PO primes was significantly smaller than the slope of similarity on DO primes. This relationship is shown in the left panel of Figure 6: as perceived interpersonal similarity increased, the likelihood of alignment on DO structures numerically increased, whereas the likelihood of PO alignment decreased. Despite this social modulation, it is apparent in Figure 6 that PO usage rates following the PO exposure condition were consistently at or above PO rates in the baseline (no exposure condition), and the same was true for DO usage (i.e., no evidence of antialignment). Finally, the best model revealed a positive interaction between exposure syntax and speaker sounds smart, which indicates that the slope of the speaker sounds smart effect on PO primes was significantly greater than the corresponding slope for DO primes (see the right panel of Figure 6).
Mixed logit model predictions for social factors that interact with exposure syntax. Points indicate subject-wise means over predicted probabilities. Filled points denote subject-wise means for participants who heard PO structures during the exposure phase, and open points denote participants who heard DO structures. Regression lines indicate binomial best-fit curves, with the error ribbons denoting 95% confidence intervals on subject-wise means. Dashed lines indicate the baseline rates of DO and PO usage, calculated from the baseline (no exposure) condition. Histograms indicate the distribution of data along each dimension of interest.
A simple effect analysis revealed that the effect of interpersonal similarity was marginally significant for PO primes (β = –.52, z = –1.93, p = .053), but not significant for DO primes (z = 1.0, p = .3). The simple effect of speaker sounds smart was significant for DO primes (β = –.54, z = –2.13, p < .05), but did not reach significance for PO primes (z = 1.0, p = .3).
DISCUSSION
This study aimed to further the current understanding of the mechanisms that drive linguistic alignment by jointly investigating the influence of social and structural factors on syntactic alignment. Participants listened to an ideologically charged passage containing either multiple double object or prepositional object sentences, and then participants verbally described a set of pictured events. When describing simple ditransitive events, participants showed a significant overall tendency to reuse the dative structure they heard during the passage—that is, a tendency to align regardless of whether the passage was spoken by a speaker with a standard-sounding or nonstandard accent and independent of participants' perceptions of the speaker and their own ideologies. This overall alignment effect indicates that our novel web-based paradigm is capable of replicating basic alignment phenomena observed in similar but laboratory-based paradigms (e.g., Bock, Reference Bock1986; Bock & Griffin, Reference Bock and Griffin2000). Furthermore, this finding contributes to the already sizable body of evidence that syntactic alignment phenomena are robust across a wide range of tasks and test conditions.
Crucially, the degree of alignment was mediated by a number of social factors. Greater alignment was observed when the speaker of the exposure passage was perceived to have a standard-sounding accent. Given the direct manipulations of standardness in the current paradigm and given the orthogonalization procedure we employed in our analysis, this effect of standardness is unlikely to be confounded by other social effects. To our knowledge, this is the first demonstration that perceived accent standardness influences nonphonetic linguistic alignment, though some previous work has investigated how observers evaluate others' linguistic shifts toward or away from prestige varieties (e.g., Ball, Giles, Byrne, & Berechree, Reference Ball, Giles, Byrne and Berechree1984).
Furthermore, greater alignment was observed among participants who prefer compromise as a conflict management style (rather than more adverse conflict management styles). This indicates that individual differences in interactional style mediate alignment even in a noninteractive task. We will discuss this novel finding in more detail below. Finally, two social factors affected alignment differently depending on whether participants heard DO or PO primes during the exposure phase. First, participants were less likely to align with PO primes when they perceived the passage speaker to be highly similar to themselves (with interpersonal similarity based largely on political ideological agreement, see Table 2), but perceived similarity had no reliable influence on alignment with DO primes. Second, when participants perceived the passage speaker to sound smart, they were significantly less likely to align with DO primes but not PO primes.
These results indicate that the mechanisms underlying syntactic alignment are sensitive to both social and structural aspects of the ambient environment. Next, we will discuss the extent to which these social modulations are due to interactional strategy or to automatic influences on information processing, and we will discuss implications of these effects for theories of alignment.
Are social modulations of syntactic alignment due to (conscious) strategic processes?
Much of the research investigating social influences on linguistic alignment has focused on strategic processes, such as alignment to achieve social goals or antialignment to signal disaffiliation (e.g., Giles & Powesland, Reference Giles and Powesland1975). An important question that has received little attention is whether social modulation of syntactic alignment is necessarily due to strategic processes, or is at least partly automatic. First, it should be noted that social modulation of linguistic behavior in no way presumes conscious control. In fact, a host of work in social psychology has shown that many aspects of social perception are subconscious (Monin, Reference Monin2003; Nisbett & Wilson, Reference Nisbett and Wilson1977; Zajonc, Reference Zajonc1980, Reference Zajonc2001; for a similar point, see Pickering & Garrod, Reference Pickering and Garrod2004:214). For example, the well-documented relationship between familiarity and social liking (i.e., greater liking for previously experienced items) has been demonstrated even under subliminal conditions in which familiarity is based on exposure to stimuli that are outside the perceiver's awareness (e.g., Murphy, Monahan, & Zajonc, Reference Murphy, Monahan and Zajonc1995), which suggests that this familiarity-liking relationship is the result of automatic information processing mechanisms (possibly stimulus imprinting: Zajonc, Reference Zajonc2001) rather than a conscious subjective preference for encountered items.
Two aspects of the experimental design argue against a strategic explanation of the current results. One is that the paradigm was intentionally noninteractive. Before beginning the experiment, participants were informed that they would be listening to a prerecorded speaker (the exposure phase) and later evaluating this speaker, with these two tasks separated by a picture description task. Participants were not led to believe that they would ever interact with the speaker. The second is that the picture description task used to assess participants' syntactic choices (i.e., describing simple actions performed by cartoon characters) was, by design, unrelated to the preceding ideologically-rich exposure phase. We established no logical connection between these tasks. In fact, it is possible that the initial description of the experiment biased participants to perceive the picture description task as simply a distractor task between being exposed to the passage speaker and later providing social evaluations of this speaker. Given these properties of our design, nothing was “at stake” for choosing one structure over another during the picture description task. Thus, it is highly unlikely that participants' syntactic choices were due to strategic processes or interactional goals. In conjunction with these properties of our design, the finding that social factors influence syntactic alignment rates even in passive exposure contexts suggests that these social modulations are at least partially due to automatic processes, consistent with the interpretation of social influences on spontaneous phonetic alignment in noninteractive tasks (see also Abrego-Collier et al., Reference Abrego-Collier, Grove, Sonderegger and Yu2011; Babel, Reference Babel2010). Next, we discuss what this (at least partial) automaticity of socially mediated effects implies for the linguistic processes assumed to underlie linguistic alignment.
Automatic alignment: A direct perception-behavior link or implicit learning?
The strongest version of the automatic view of alignment stipulates an automatic and direct perception-behavior link to explain alignment behaviors (Pickering & Branigan, Reference Pickering and Branigan1998; Pickering & Garrod, Reference Pickering and Garrod2004:188). Under this view, mere exposure to a particular linguistic structure increases the likelihood of one subsequently reusing this structure. The present results suggest that alignment behavior is more complicated than a direct link between perception and action. In particular, although we found a significant pattern of alignment regardless of the social context of exposure, which suggests at least partial automaticity, the degree of alignment varied considerably depending on a number of social factors. Without additional assumptions, the proposal of a direct perception-behavior link has no mechanism to capture such variation in alignment rates. Furthermore, the strong view cannot account for the fact that alignment is not the only outcome to result from exposure. We found no evidence for antialignment: as seen in Figures 5 and 6, dative preferences in the experimental conditions were never reliably below baseline rates. However, Balcetis and Dale (Reference Balcetis and Dale2005) reported evidence of a numeric (albeit not significant) trend toward antialignment on DO structures when participants interacted with a disagreeable confederate, and in a study of phonetic alignment, Babel (Reference Babel2010) reported evidence of phonetic exposure variably leading to alignment, antialignment, or no change in behavior depending in part on the vowels being produced.
Pickering and Garrod (Reference Pickering and Garrod2004:214) recognized this challenge to the perception-action link account. They proposed that control mechanisms can inhibit the perception-action link. As they discussed, this proposal predicts that antialignment should require more attention and control because the automatic link needs to be actively inhibited. To the best of our knowledge, this prediction, critical as it is for the perception-behavior account, awaits testing.
An alternative explanation of social effects on linguistic alignment is that these effects are mediated by influences on memory encoding (see Branigan, Pickering, McLean, & Cleland, Reference Branigan, Pickering, McLean and Cleland2007, for a similar discussion). The strength with which information is encoded in memory is influenced by attention (Kruschke, Reference Kruschke1992, Reference Kruschke, Pothos and Wills2011) and affect (Monin, Reference Monin2003; Zajonc, Reference Zajonc1980), with attended information and information that evokes high affect being encoded more strongly. This raises the possibility that listeners may encode a speaker's syntactic choices with differential strength depending on other aspects of the environment. For example, in the present study, when listening to nonstandard speakers, participants may have devoted greater attention to pronunciation variation in order to adapt to and ultimately comprehend speech (e.g., Bradlow & Bent, Reference Bradlow and Bent2008; Clarke & Garrett, Reference Clarke and Garrett2004; Mattys, Davis, Bradlow, & Scott, Reference Mattys, Davis, Bradlow and Scott2012). Given that attentional resources are in limited supply (Kahneman, Reference Kahneman1973), such allocation might decrease the resources available for encoding the speaker's dative use, in turn decreasing the influence of this syntactic exposure on the participants' subsequent productions. Thus, alignment differences for standard-sounding and non-standard speakers could be due to differences in the strength with which the speakers' dative choices were encoded. Similarly, strong affect (whether positive or negative) evoked by aspects of the social context, such as the speaker's ideological opinions, could lead listeners to focus greater attention on these aspects, hence reducing attention to syntactic information. Relatively little is known about the effect of attention on syntactic priming (Ferreira, personal communication; Hartsuiker, personal communication; Kaschak, personal communication; Pickering, personal communication). Some relevant evidence comes from unpublished experiments by Mike Kaschak and colleagues, who find that increased attention to parts of a prime stimulus affect priming. For example, having the prime verb presented in all caps leads to stronger priming (Kaschak, personal communication). This leaves open whether increased attention to other aspects of the speech signal (i.e., not specifically to the prime) are associated with weaker priming effects, as we entertain here. Interestingly, in an ongoing study, Ivanova and colleagues report reduced syntactic priming effects under increased memory load (Ivanova, Lane, Gollan, & Ferreira, Reference Ivanova, Lane, Gollan and Ferreira2013). Further research, particularly using implicit or explicit memory tasks, is necessary to test whether participants show differential encoding of ambient information depending on the context and, if so, whether these memory effects are consistent with patterns of alignment differences.
Alignment and conflict management
The finding that syntactic alignment was mediated by individuals' predisposition for compromise as a conflict management style deserves further comment. This is the most novel finding of the current study, as well as the most exploratory aspect of the design. One possibility is that this conflict management effect reduces to inattention. For example, relative to compromisers, noncompromisers may attend less to the passage speaker when they experience conflict (e.g., if one was angry about the passage speaker's political views, they might decide not to listen to this speaker), which could reduce alignment due to weaker encoding of syntactic information from the passage.
If the effect of conflict management style on syntactic alignment does not reduce to inattention, this effect would seem to suggest that social influences on syntactic alignment are due at least in part to higher-order social cognition, not just to low-level perceptual aspects of social experience (e.g., low-level perception of acoustic properties of speech that influence how smart, articulate, or [non]standard a speaker sounds). This emphasizes the general point that speech processing and production should be studied with respect to individual differences in both low-level social perception and higher-order social cognition. Regarding linguistic alignment in particular, investigating the extent to which any social modulations of alignment are due to low-level or higher-order social processes will provide important insights into the precise dynamics of the cognitive systems that underlie alignment behavior.
Differential effects of social factors on DO and PO alignment
The finding that two social factors—perceived interpersonal similarity and perceptions of the passage speaker as sounding smart—differentially influenced PO and DO alignment rates is puzzling. One challenge that our study shares with many studies on socially mediated alignment is that the variables of interest vary between participants. Combined with the large number of social and structural variables of interest, correlations between these variables (cf. Simmons, Nelson, & Simonsohn, Reference Simmons, Nelson and Simonsohn2011), and often highly unbalanced samples, this means that studies like ours necessarily suffer from both inflated type I and II error rates (spurious effects and spurious null effects). These problems are likely to be exacerbated for interactions of two between-participant variables. This is particularly relevant in light of the somewhat unexpected interactions we observed. We took several measures in the current study to ameliorate these problems: running a large number of participants compared to most previous studies, thereby reducing problems due to small sample sizes; choosing conservative decision criteria for the factor analysis; and deciding our statistical approach prior to seeing the data, thereby reducing researcher degrees of freedom (cf. Simmons et al., Reference Simmons, Nelson and Simonsohn2011). Still future work is necessary to assess the reliability of the effects reported here.
Despite these caveats, we are not the first to observe different socially mediated patterns of alignment depending on the exposure syntax. In one experiment, Balcetis and Dale (Reference Balcetis and Dale2005) found greater PO alignment rates when participants interacted with a nice rather than mean confederate, but there was a nonsignificant trend in the opposite direction for DO alignment rates. In a second experiment, Balcetis and Dale (Reference Balcetis and Dale2005) found greater DO alignment but no effect for PO alignment when the confederate acted annoyed rather than patient. Determining whether such differential modulations of DO and PO alignment behavior replicate has important implications for theories of linguistic alignment. Neither theories that explain alignment as the output of an automatic perception-behavior link (Pickering & Branigan, Reference Pickering and Branigan1998) nor implicit learning accounts of linguistic alignment (Bock & Griffin, Reference Bock and Griffin2000; Chang et al., Reference Chang, Dell and Bock2006) provide an explanation for the finding that, in otherwise identical situations, exposure to PO structures leads to one pattern of alignment, while exposure to DO structures leads to an altogether different behavioral response.
Methodological challenges in research on social perception and cognition
Research on social perception and cognition often requires reliance on individual differences (e.g., participants' unique social attributes or attitudes). As discussed, this reliance poses a practical challenge, namely that researchers have no or only indirect control over the distribution of the relevant social variables, frequently resulting in imbalanced samples and undesired correlations and increasing the probability of spurious effects, particularly for small samples.
In the current study, we approached the challenges of sample size and individual differences with a three-pronged strategy. First, by using a crowdsourcing platform, we were able to recruit a large number of participants (above the recommended number of 20 per between-participant condition proposed by Simmons et al., Reference Simmons, Nelson and Simonsohn2011) and, importantly, to do so without resulting in exploding costs, project duration, or recruiting efforts. In addition to larger sample sizes, the crowdsourcing paradigm offered access to a more heterogeneous population than the common practice of convenience sampling from a pool of college students. The population reached through Amazon's Mechanical Turk spans larger age ranges and socioeconomic classes and is approximately gender-balanced (e.g., Mason & Suri, Reference Mason and Suri2012, and references therein). However, it should be noted that participation in our study required a microphone and speakers/headsets. Given these technological demands, combined with the large number of college-educated participants in this study, it is possible that we did not sample from the full social range of the Mechanical Turk user base.
Second, we manipulated social perceptions and perceived similarity through exposure to an ideologically charged diatribe spoken by speakers with socially different accents, and we structured our post-experimental survey to assess the success of these manipulations. Given the combination of a sizable sample and polarizing social manipulations, the social measures of interest were sufficiently well distributed between participants to be used as individual difference scores in predicting syntactic alignment rates (see the histograms in Figures 5 and 6). Third, we employed statistical methods that allowed us to orthogonalize the variables of interest. In doing so, we followed a conservative approach. We only included factors in the analysis that made the cut based on the two most common evaluation criteria for factor analysis. To the extent possible, we decided a priori what analyses to conduct based on principled reasons, and we did not explore additional variants. When we felt that there was no clear a priori reason to prefer one of several alternative analyses, we ensured that the results reported held under all of the alternatives.
Looking forward, the current web-based paradigm can be refined to address a wider range of questions at the intersection of psycholinguistics and sociolinguistics. For example, with respect to socially mediated syntactic alignment, the exposure materials can easily be modified to establish different social conditions (e.g., short videos of socially rich interactions), and the post-experiment questionnaire can be adapted to measure relevant social perceptions with respect to this context. Furthermore, the ability to record audio from the user's home microphone via a web browser opens the possibility for rapid large-scale studies of phonetic alignment and dialect imitation. One limitation of the crowdsourcing approach is that real-time interactive tasks are nontrivial to implement on the web, although technological advances facilitate such research. For example, several recent studies have either connected pairs of participants over the web (Djalali, Clausen, Lauer, Schultz, & Potts, Reference Djalali, Clausen, Lauer, Schultz and Potts2011) or attempted to deceive participants into believing they were talking to a real person over the web (see, e.g., Buz, Jaeger, & Tanenhaus, Reference Buz, Jaeger, Tanenhaus, Bello, Guarini, McShane and Scassellati2014; Duran & Dale, Reference Duran and Dale2011a, Reference Duran, Dale, Carson, Hölscher and Shipley2011b).
CONCLUSIONS
The results reported here suggest that alignment is a basic phenomenon that occurs in response to recent exposure (i.e., the observed effect of alignment across all social conditions) but that the degree of alignment depends on participants' perceptions of others, participants' individual tendencies, and the linguistic structures in the ambient environment that are available to align (or antialign) with. These results indicate two main areas for advancing current theories of linguistic alignment and speech production. One is that existing theories need to be expanded to account for the joint and spontaneous influence of social and cognitive factors on alignment. Second, existing theories need to be refined to account for the fact that social factors, such as perceived interpersonal similarity, do not exhibit a singular influence on speech production (e.g., general social liking leads to greater alignment), but instead interact with structural properties of speech to produce complex patterns of alignment behavior.
Finally, we reiterate the need for further large-scale studies on social factors in alignment: when assessing the significance of a large number of between-participant variables (such as social identity, perception, and attitude), large samples of participants are particularly crucial in order to reduce the probability of spurious effects. The web-based paradigm introduced here offers one approach to this problem.
APPENDIX A: FULL VERSIONS OF THE EXPOSURE PASSAGES
Liberal DO/PO scripts
I generally don't complain about politics. But the government spending is crazy. It's no wonder the economy is in trouble. The government just keeps handing rich oil barons millions of dollars/handing millions of dollars to rich oil barons. It happens every day. Right now, Congress is just throwing corporate executives money/throwing money to corporate executives and giving conservative special interest groups all these handouts/giving all these handouts to conservative special interest groups. It's crazy, just crazy.
The people I know are worried, really worried, about the future because Congress is not investing in things that will actually strengthen our country. Congress has gotta send teachers more cash/send more cash to teachers, and it would be nice if now and then they could throw alternative energy researchers some operating money/throw some operating money to alternative energy researchers, too. But they don't.
I did write my Senators a letter/write a letter to my Senators, talking about all the government spending. And I sent all my friends an email / sent an email to all my friends, so they would write in, too. I said that, as a country, we wouldn't have all this debt if the government didn't promise rich people increasing amounts of money/promise increasing amounts of money to rich people. But it's not gonna change anything. Every election, politicians give the American people all these speeches/give all these speeches to the American people. All of which promise a better future. All promising that this time it's gonna be different. But nothing changes because each year Congress hands Exxon and Haliburton our tax dollars/hands our tax dollars to Exxon and Haliburton.
Conservative DO/PO scripts
I generally don't complain about politics. But the government spending is crazy. It's no wonder the economy is in trouble. The government just keeps handing these lazy people millions of dollars/handing millions of dollars to these lazy people. It happens every day. Right now, Congress is just throwing welfare moochers money/just throwing money to welfare moochers and giving liberal special interest groups all these handouts/giving all these handouts to liberal special interest groups. It's crazy, just crazy.
The people I know are worried, really worried, about the future because Congress is not investing in things that will actually strengthen our country. Congress has gotta send our troops more cash/send more cash to our troops, and it would be nice if now and then they could throw our border police some operating money/throw some operating money to our border police, too. But they don't.
I did write my Senators a letter/write a letter to my Senators, talking about all the government spending. And I sent all my friends an email/sent an email to all my friends, so they would write in, too. I said that, as a country, we wouldn't have all this debt if the government didn't promise welfare cheats increasing amounts of money/promise increasing amounts of money to welfare cheats. But it's not gonna change anything. Every election, politicians give the American people all these speeches/give all these speeches to the American people. All of which promise a better future. All promising that this time it's gonna be different. But nothing changes because each year Congress hands Medicare and Medicaid our tax dollars/hands our tax dollars to Medicare and Medicaid.
APPENDIX B: MECHANICAL TURK SETUP
On each trial during the picture description phase, participants would see an image. Underneath this image was a button labeled “begin recording.” When this button was pressed, red text saying “Recording. . . .” would appear on screen, along with a “Next” button. The red text would blink intermittently until participants clicked “Next” to advance to the next trial (see Figure B.2).
Screen shot showing the task instructions and the interactive interface for ensuring that WAMI was detecting microphone input.
Screen shot showing the display screen as participants recorded their picture descriptions.
Screen shot showing a page from the post-experiment survey.