Introduction
Wireless communication is a trending topic in transforming and modernizing industrial applications, including automation, manufacturing, monitoring, and maintenance. With its ease of deployment, together with mobility and flexibility, wireless communication is preferred over conventional wired systems to be deployed in complex and dynamic environments like manufacturing floors with machinery. Nevertheless, industrial settings also pose challenges to wireless communication due to the presence of industrial objects, often with metallic surfaces. The resulting complex propagation phenomena, such as reflection, scattering, and diffraction, can severely affect the quality and reliability of signals. As a result, analyzing and understanding the propagation environment in industrial settings is essential for advancing wireless communication in industrial scenarios.
While the conventional frequency bands (sub-6 GHz) are effective for numerous traditional applications, challenges exist for deploying them in industrial applications. Limited capacity and interference, considering the multitude of devices to be equipped with communication capability, can constrain the performance of wireless communication in terms of throughput and latency. To overcome these challenges, there is a pressing need to explore and exploit new frequency bands, particularly in the terahertz (THz) and millimeter-wave (mmWave) ranges. With a wider spectrum, THz and mmWave communication could alleviate congestion in conventional bands and could also provide new propagation characteristics to be harnessed. Moreover, the short communication range of mmWave and THz bands is less serious a problem because the typical communication in industrial settings occurs over short distances.
Regardless of frequency, the complex propagation effects in industrial settings yield a multipath effect, where signals arriving at the receiver due to different points of reflection, etc. can lead to both constructive and destructive interference. Therefore, modeling wireless channels that incorporate multipath components (MPCs) become essential for optimizing wireless communication systems in industrial applications. To this end, wireless channel models are often built upon modeling electromagnetic propagation with a finite number of MPCs, with each of the components characterized by its unique amplitude, delay, and angles of arrival and departure. In practice, MPCs with similar characteristics are grouped into clusters, so as to facilitate processing received signals in batches and reduce channel estimation complexity. Moreover, distinguishing clusters of MPCs is beneficial for systems like rake receivers and multiple-input multiple-output to select useful and dominant MPCs with less interferences. Clusters with distinct spatial directions can be exploited with beam forming to enhance channel capacity.
In terms of the identification of MPCs, classic approaches include using parameter estimators on measurements, simulating the propagation ray tracing, and manual inspection on the signals. MPCs are often represented as the peak points in the received signal with angular information. For measurements with noise, parameter estimators for reconstructing MPC information could yield unreliable results even with high complexity in implementation and computation. The availability of validation with a ray tracing platform is also not guaranteed, which is dependent on the amount of information known about the propagating environment. In the case of an unknown wireless environment, or when the number of MPCs reaches a certain multitude, identifying peaks and performing manual clustering of MPCs become time-consuming and erroneous.
In light of the challenges mentioned, there is a need for efficient processing of measurements to extract the information of MPC clusters. In this paper, we approach the task from a data processing and manipulation perspective, without fitting parameter models. Leveraging a well-known clustering algorithm, we also investigate the effectiveness of different distance metrics in distinguishing MPCs. Our contributions are summarized as follows:
(1) we propose a complete workflow for processing raw measurements, applying clustering algorithms, and extracting cluster information.
(2) we compare two different metrics for distinguishing MPCs and evaluate their performance with different clustering algorithm.
(3) we analyze the clustering results across different frequency bands, demonstrating the strong performance of our solution, particularly with high-frequency signals.
Related work
In [Reference Czink, Cera, Salo, Bonek, Nuutinen and Ylitalo1], Czink et al. introduced KPowerMeans, a modified version of the widely used K-means algorithm [Reference Lloyd2], which uses the power of MPCs as the scaling factor of the original MPC distance (MCD). The newly derived distance metric then substitutes Euclidean distance in the K-means algorithm. This algorithm was also utilized in [Reference Gustafson, Haneda, Wyne and Tufvesson3] and [Reference Cheng, Sangodoyin and Zajic4] to identify multipath clusters at mmWave and THz frequencies. Li et al. [Reference Li, Wang, Chen, Yu and Han5] collected channel measurements at THz frequencies and employed the DBSCAN algorithm [Reference Martin, Hans-Peter and Xiaowei6] to identify the multipath clusters.
Chen et al. [Reference Chen, Li, Han, Yu and Wang7] utilized THz channel measurements and ray tracing simulations to cluster and match MPCs. Initially, the DBSCAN algorithm was employed to cluster the MPCs observed in the actual measurements. Subsequently, the identified clusters were matched with those observed in a ray tracing simulator using the MCD metric.
He et al. [Reference He, Li and Ai8] introduced a clustering algorithm that identifies independent clusters by utilizing a kernel density measure. Schneider et al. [Reference Schneider, Bauer, Narandzic, Kotterman and Thomae9] presented a novel clustering approach based on Fuzzy-c-means. Gentile [Reference Gentile10] proposed a new clustering algorithm that utilizes the region competition algorithm [Reference Zhu and Yuille11], an optimization technique originally developed for image segmentation, and the kurtosis measure. In [Reference He, Chen and Ai12], clustering is treated as a sparsity-based optimization problem that takes advantage of the physical property that the power of MPCs decreases exponentially with respect to the delay.
As a preprocessing step for raw measurements, for identifying the components in the signals with super-positioned MPCs, various parameter estimators can be applied. Classic solutions include the (MD-MUSIC) algorithm [Reference Swindlehurst and Kailath13], the space-alternating generalized expectation-maximization (SAGE) [Reference Fessler and Hero14] algorithm, the variational Bayesian version of SAGE [Reference Shutin and Fleury15], and the RiMAX algorithm [Reference Thomae, Landmann, Sommerkorn and Richter16]. Parameter estimators generalize the received signals into parametric representations, which are prone to errors in the presence of noise. Furthermore, the computational demand of such algorithms is usually high, making scalability an issue when dealing with a large number of MPCs to be extracted.
Considering the challenges of implementing a channel parameter estimator, we treat the raw measurements as matrices of data and apply simple preprocessing, by filtering out points with base receiving power, appending angular information, etc., without iterative optimization involved in preprocessing. MPCs and their corresponding clusters are automatically formed by applying a clustering algorithm on the data consisting of power information from various angles.
An earlier version of this paper, in which the measurement is collected at only one transmitter (TX)–receiver (RX) location pair and only on THz frequency, was presented at EuCAP 2024 and was published in its proceedings [Reference Wu, Zugno, Boban and Dressler17]. In this paper, we apply the clustering workflow on measurements from various TX–RX locations and on three different frequency bands. Moreover, we propose a new implementation of the distance metrics in the clustering algorithm, plus a novel post-processing function for extracting MPC cluster information. In the end, we evaluate the clustering results not only by time range separation but also by peak separation when more than one MPCs arrive at the same time.
Measurement setup
To study the feasibility of high-frequency wireless communication in industrial settings, a measurement campaign [Reference Dupleich, Ebert, Völker-Schöneberg, Sitdikov, Boban, Samara, Del Galdo and Thomä18] was conducted in a small factory scenario. The measurement environment is a realistic replica of manufacturing sites and, therefore, consists of strong reflective surfaces of metal and glass, creating a complex propagating environment for wireless communication with non-negligible MPCs.
To mimic the potential wireless communication equipped on various devices in the room, and also to study the propagating environment on line-of-sight (LOS) and non-line-of-sight (NLOS) conditions, 3 transmitter locations and 12 receiver locations are selected (shown in Figure 1) and 20 measurements on 20 pairs of transmitter–receiver settings are conducted. The directions of transmitting and receiving are fixed on the horizontal plane and rotate with a 15∘ separation, aiming to capture the full range of propagation scenarios, including LOS and NLOS cases. The measurements cover the THz frequency (300 GHz), mmWave frequency (74.25 GHz), as well as sub-6 GHz frequency (6.75 GHz), providing a comprehensive understanding of the channel characteristics at different bands. For each frequency band, the measurement is conducted with two pairs of antenna polarization directions (horizontal–horizontal and vertical–vertical). Detailed measurement configurations are documented in Table 1.
Transmitter and receiver locations are marked by blue and silver spheres, respectively. Measurement is conducted in a room simulating the manufacturing environment. Materials are plotted transparent for visibility of the transmitter/receiver locations.

Measurement Setup

For each transmitter and receiver location, we obtained measurement data in the following format:
 \begin{align*}H \subset \mathbb{R}^{K\times P\times I\times J\times M\times N}_{\geq 0}\end{align*}
Details of the variables related to the dimension of the data are listed in Table 2. In our case, the elevation scanning angle is 0∘ only, therefore J = 1 and N = 1.
Variables, parameters, and acronyms used in algorithms and experiments

Clustering algorithm
To perform direct identification and clustering of the measurement signal, we need to convert the signal matrix into data points that fit the corresponding clustering algorithm. With the clustered output, another procedure of post-processing the results is needed to extract characteristic information of the MPC clusters. We divide this section into three parts that describe the three procedures.
Preprocessing of measurement signals
We describe the preprocessing of signal matrix in Algorithm 1, separated in terms of two different metrics for evaluating the distance between signals.

For classic Euclidean distance, the power of the received signal at the specific time step, as well as the power difference between the current time step and the previous/following steps are included in the feature. The angular difference between signals is represented by the sinusoidal values (cosine and sine) of the transmitter and receiver angles, which aims to differentiate symmetrical angles and keeps the physical continuity of angles at numerical jumps (e.g. 359∘ to 0∘). The complete process of getting the sinusoidal features is described in Algorithm 2. The number of sinusoidal features is reduced by using only cosine/sine values when all of the angular values are in the monotonic range of cosine/sine functions.

For power distance [Reference Czink, Cera, Salo, Bonek, Nuutinen and Ylitalo1], the angle information (departure/arrival) of a signal is fed to compute the MCD, as later shown in Equation (4).
The conditions to exclude points with  $p_* = 0, \forall * \in \{f,b,t\}$ in Algorithm 1 are to filter out points in the measurement where there is no signal received, thus to reduce the size of data later fed into the clustering algorithm and speed up the process.
Clustering algorithm
We compare two clustering algorithms: K-means [Reference Lloyd2] and DBSCAN [Reference Martin, Hans-Peter and Xiaowei6]. Both algorithms have been elaborated in the past; therefore, we refer to the corresponding papers for the details of the algorithm, whereas below we elaborate on our implementation aspects for both algorithms. The terminology of related terms is detailed in Table 3.
Notations in equations

In the original versions of the two algorithms, n-dimensional points are input, and the Euclidean distance based on all dimensions is used as the metric to determine the proximity of two points:
 \begin{align}
d_{euc}(m, n) = \left(\sum_{i=1}^n (m_i-n_i)^2\right)^{1/2}
\end{align}
In [Reference Czink, Cera, Salo, Bonek, Nuutinen and Ylitalo1], power distance is introduced to evaluate the proximity of an MPC component to its cluster center:
 \begin{align}
d_{pow}(m, n) = P_m \cdot \mathrm{MCD}_{mn},
\end{align}
n is the cluster centroid in the K-means algorithm and m is the input points to be clustered.
 \begin{align}
&\mathrm{MCD}_{mn} = \nonumber \\
&\sqrt{\Vert \mathrm{MCD}_{AoA,mn} \Vert^2 + \Vert \mathrm{MCD}_{AoD,mn} \Vert^2 + \Vert \mathrm{MCD}_{\tau,mn} \Vert^2}
\end{align}
For components in computing  $\mathrm{MCD}_{mn}$:
 \begin{align}
&\Vert \mathrm{MCD}_{AoA/AoD,mn} \Vert = \nonumber \\
& \frac{1}{2} \left| \left( \begin{array}{c} \sin(\theta_m)\cos(\phi_m)\\
\sin(\theta_m)\sin(\phi_m) \\
\cos(\theta_m)
\end{array} \right) - \left( \begin{array}{c} \sin(\theta_n)\cos(\phi_n)\\
\sin(\theta_n)\sin(\phi_n) \\
\cos(\theta_n)
\end{array} \right) \right|
\end{align}
 \begin{align}
&\mathrm{MCD}_{\tau,mn} = \zeta \cdot {\frac{\vert \tau_m - \tau_n \vert}{\Delta \tau_{\max}}} \cdot {\frac{\tau_{std}}{\Delta \tau_{\max}}}
\end{align}
DBSCAN [Reference Martin, Hans-Peter and Xiaowei6] does not define a centroid for each cluster but finds neighbors for each input point. Therefore, when calculating the distance, the power of both signal points should be considered, rather than just one as in Equation (2) which results in  $d(m, n) \neq d(n,m)$. To this end, we derive:
 \begin{align}
d'_{pow}(m,n)=(\vert P_m - P_n \vert + P_{base}) \cdot \mathrm{MCD}_{mn}
\end{align}
for computing the power distance when applying the DBSCAN algorithm. The computation of absolute difference ensures symmetry when swapping the input sequence of the two points. The addition of Pbase serves as the base scalar when two points have similar power levels but differ in angles.
For algorithms using both distance metrics, it is necessary to adapt clustering parameters and further scale the inputs before feeding data points. The process flow is shown in Algorithm 3 and the scaling factor for each of the features is shown in Table 4. Lines 5–8 in Algorithm 3 shift the power values of all points when using decibel values to be  $\geq 0$, thus guaranteeing that computed power distance by Equation (2) to be
 $\geq 0$.

Scaling factors in clustering with Euclidian distance

Post-processing
We propose Algorithm 4 to process the clustered points or the original matrix of the raw signal. For simplicity, the dimension of the matrix processed is  $T\times I \times M$, which suits our measurement data with only one measuring angle of transmitting and receiving elevations. The algorithm can be further extended to be compatible with data of higher dimensions where the elevation angles are also included.

Algorithm 4 tracks the peak (with power greater than its neighboring angles) of the arriving signals in each time frame and consistently logs the location of peaks, with considerations that the peak might shift in angular domains. It is worth noting that Algorithm 4 can also be used as a preprocessing step to extract the peaks in the raw signals. The advantages of using Algorithm 4 on clustered results lie in the shorter processing time, where it is easier to find local maxima in a frame (in Line 6) when processing a sparse matrix yielded by clustered data.
The information of peaks identified by Algorithm 4 in each cluster, e.g. angular values and duration, is then valuable for further microwave applications.
Experiments
Parameter settings
The scaling factors for each feature used to compute Euclidean distance and power distance are listed in Table 4. For the algorithm of K(Power)-Means, the number of clusters k is the hyper-parameter. For DBSCAN, the neighbor-threshold distance e is the parameter to determine if a cluster should expand to include another point. The searching range of k and e are listed in Table 5.
Searching range of hyper-parameters in clustering

Ground truth
For any time step in the measurements with signals received from any angle, we inspect the heatmap and evaluate if the signal belongs to a certain cluster.
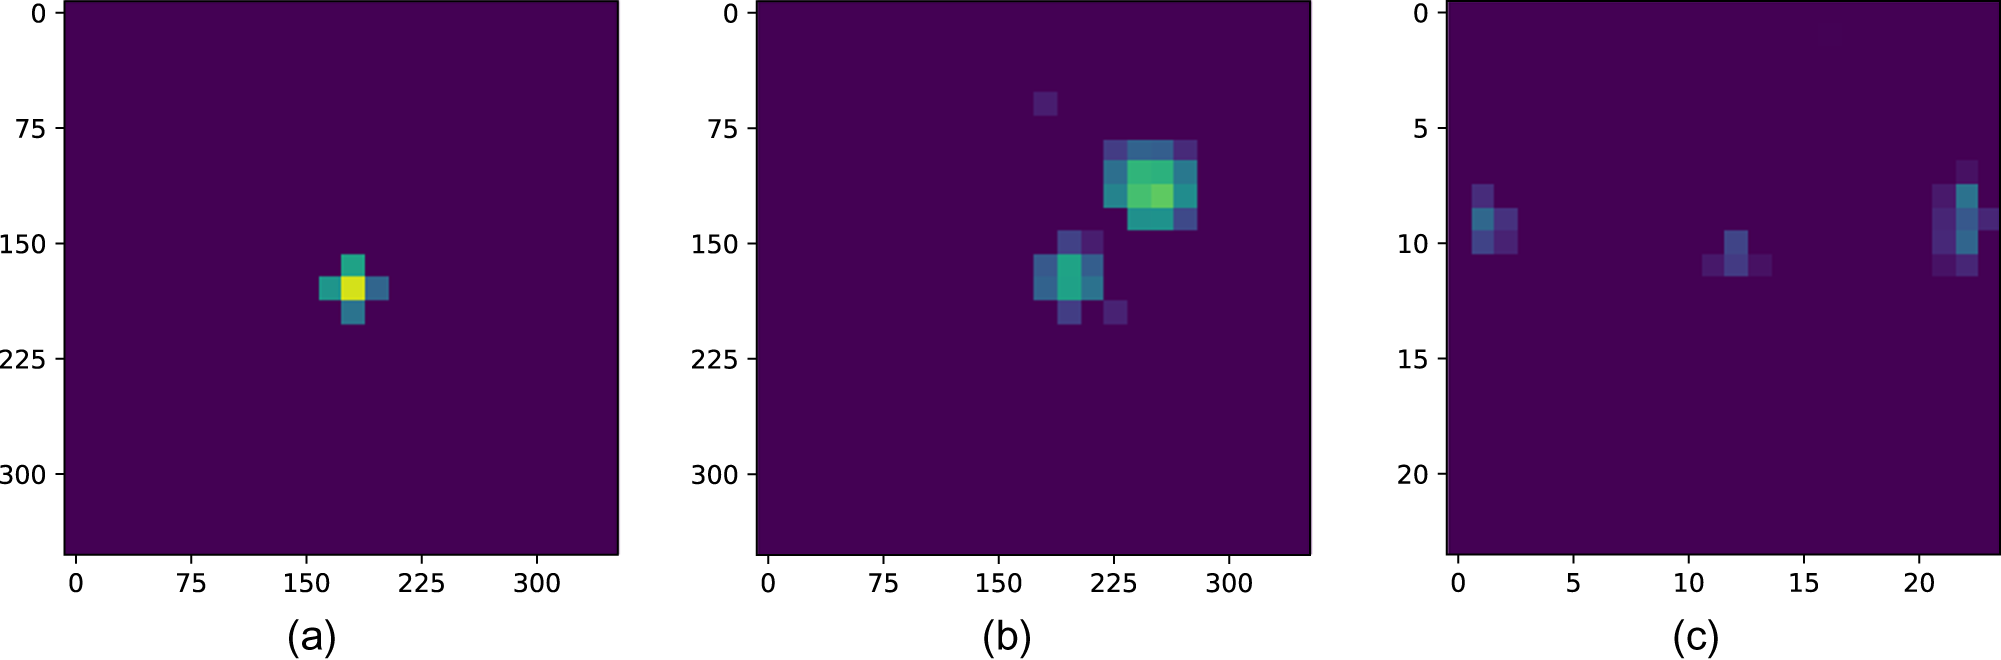
For the transmitter–receiver location pairs where there is always only one MPC arriving at a time, as shown in Figure 2(a), or more than one MPCs close to each other as shown in Figure 2(b), we manually identify the time range of the corresponding MPC cluster and then cluster the MPCs based on their time-wise and angular proximity. If there are more than one MPCs arriving at a time, which are also distant in arriving angle and thus do not belong to the same cluster (as shown in Figure 2(c)), we inspect the clustered results and check if the MPCs are separated correctly.
Heatmaps of MPCs arriving in three different ways. (a) Single MPC, (b) two MPCs in the same cluster, and (c) two MPCs in separate clusters.

Accuracy of time range separation
We only evaluate the accuracy of time range separation for measurements where there are no MPCs belonging to separate clusters arriving at the same time. With Algorithm 5, each time step is assigned a cluster number that is the majority of clusters for points in the corresponding frame.

Ground truth labeling is performed for selected pairs of Tx–Rx locations and on all of the three frequency bands. Cases of TX1–RX1 and TX1–RX8 are in LOS condition. Cases of TX2–RX3 and TX2–RX6 are in NLOS conditions. The accuracy is then computed with the Adjusted Rand Index (ARI) [Reference Hubert and Arabie19] and shown in Table 6. Higher values (close to 1) in ARI indicate a better match between the experiment result and the ground truth. We see that using DBSCAN with power distance outperforms the other 3 methods in 7 out of 12 cases with the highest average accuracy. Specifically, DBSCAN with power distance performs the best in three out of four cases on THz frequency, and in three out of four cases on mmWave frequency as well.
Evaluation accuracy for selected Tx–Rx locations

We also observe that there is a general trend that the clustering accuracy is higher, for any method, when the frequencies of the signals are higher. The underlying reason is that faster attenuation of high-frequency signals results in a clear separation of arriving MPCs, thus formulating a simpler task for the clustering algorithm.
Accuracy of simultaneous peak separation
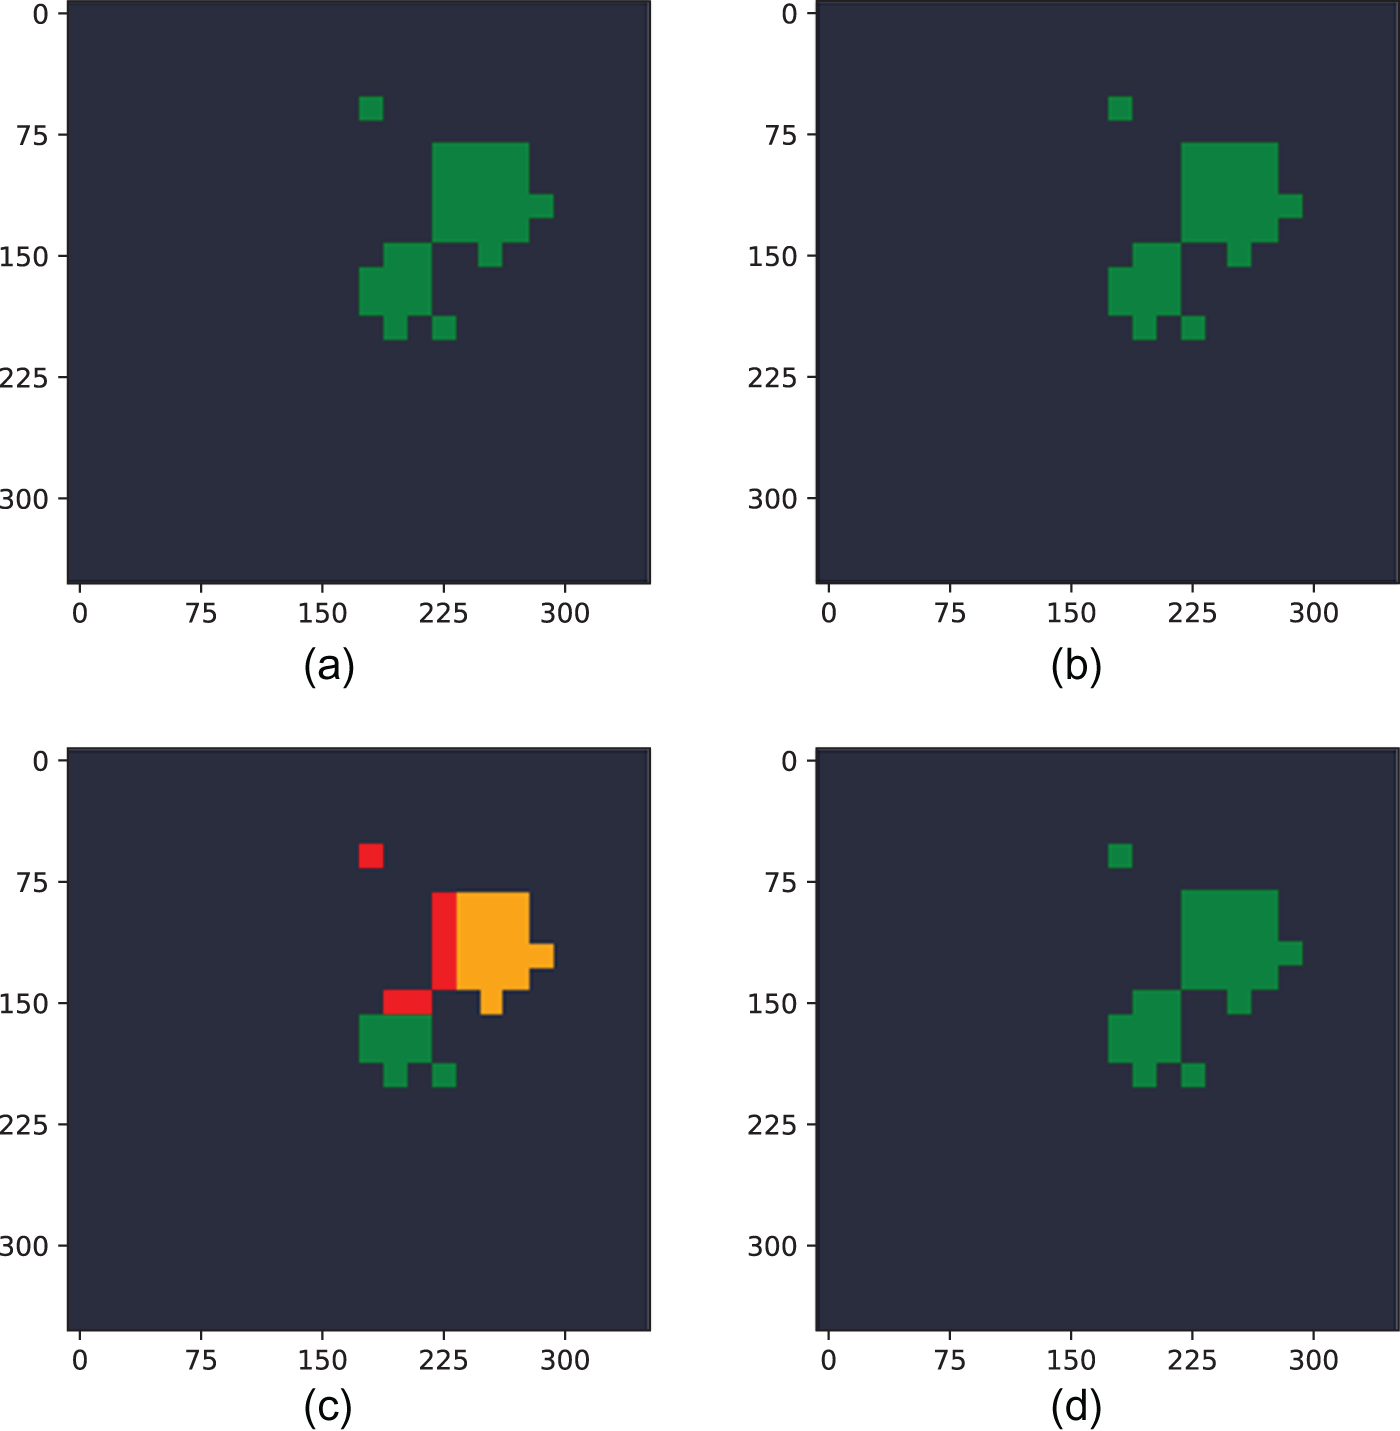
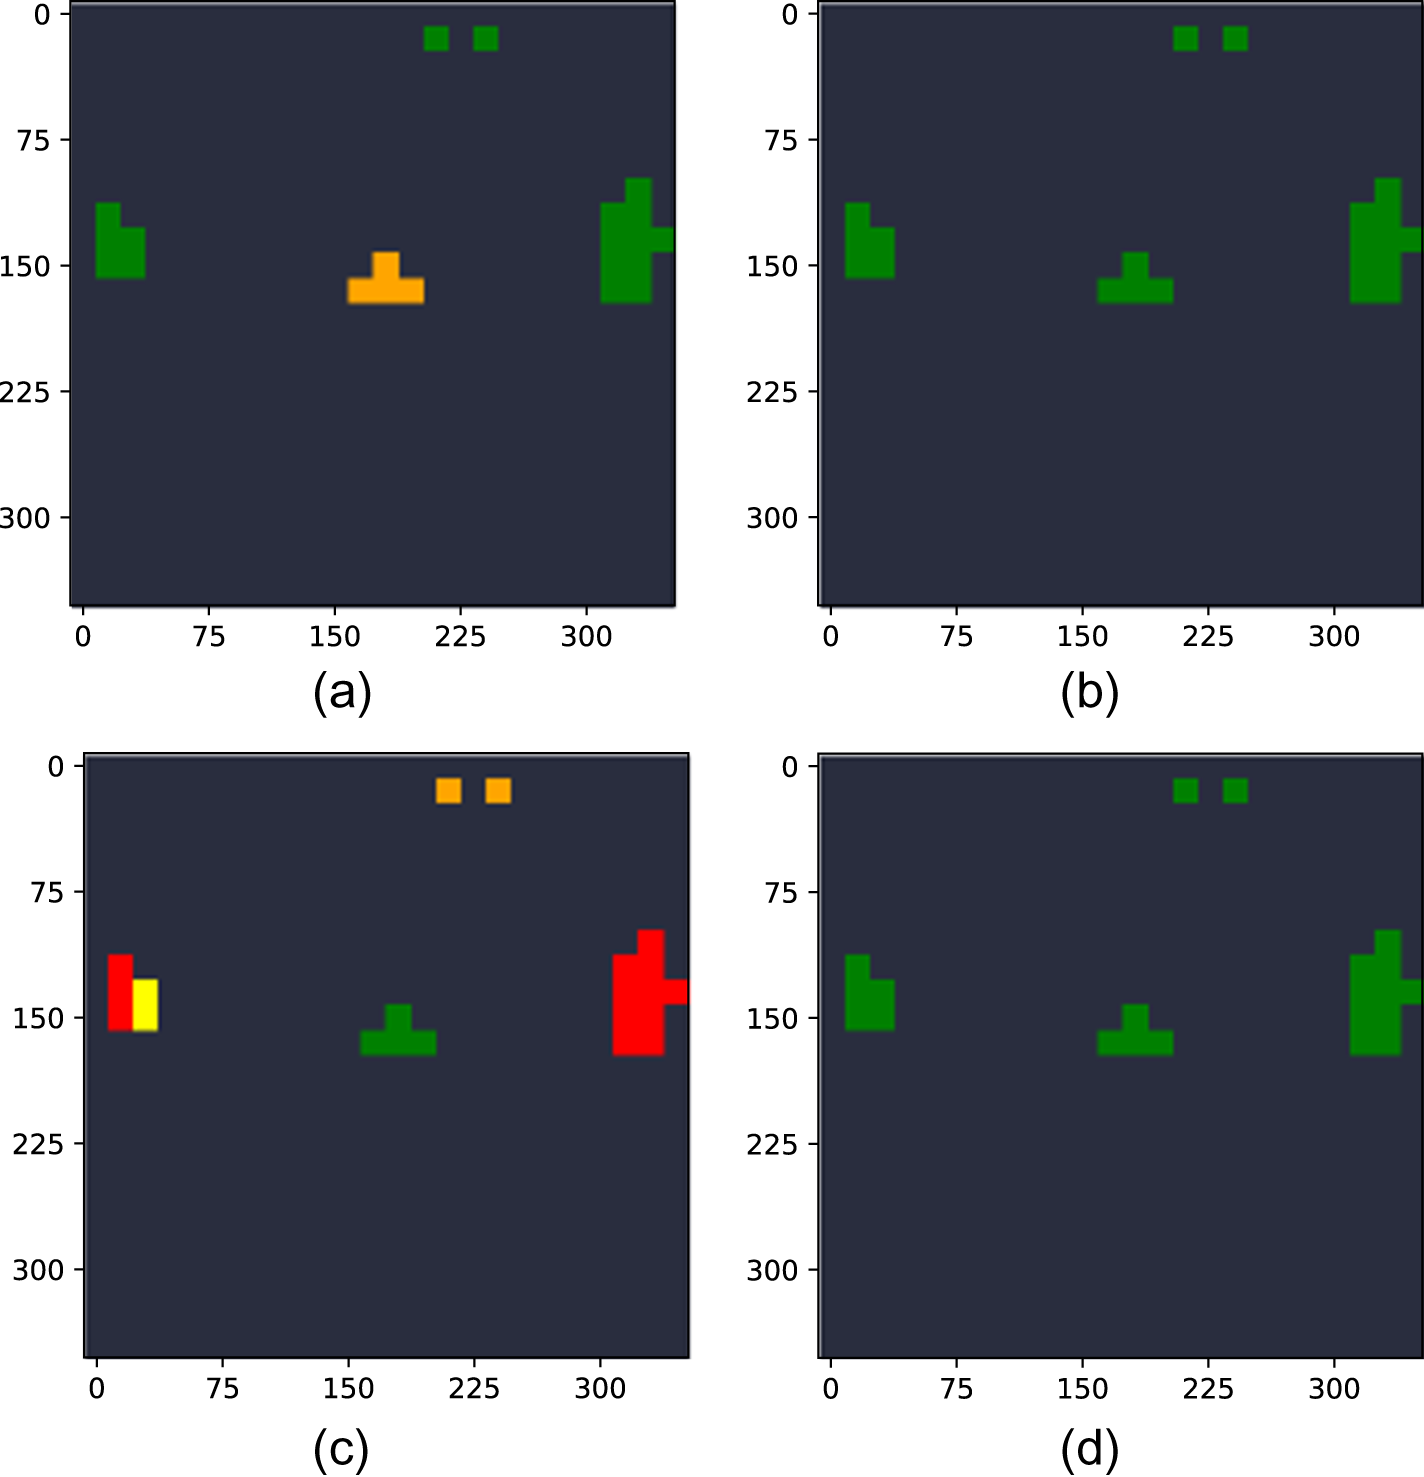
We plot the clustering results of the four methods for the MPC components shown in Figure 2(b) and Figure 2(c).
In Figure 3, where the two arriving MPCs are also close on the angular domain and thus belong to the same cluster, all clustering methods achieve the correct clustering results, except for K-means with power distance. Even though it is also practically viable to separate the MPCs, K-means with power distance also fail to correctly cluster the signals detected at the edge angles of MPCs (as seen in pixels marked in red in Figure 3).
Clustering results for two MPCs in the same cluster arriving at the same time. (a) K-means with Eucl. dist., (b) DBSCAN with Eucl. dist., (c) K-means with power dist, and (d) DBSCAN with power dist.

In the case where two arriving MPCs are far away from each other in the angular domain (as in Figure 4) and fall into different clusters, none of the four methods gives perfect solutions. We notice that the DBSCAN algorithm (in Figure 4(b) and Figure 4(d)) determines all arriving signals at the same time step to be in the same cluster, irrespective of the distance metrics, while the K-means algorithm separates the signals that are almost 180∘ apart in transmission azimuth. However, K-means with Euclidean distance (in Figure 4(a)) does not separate the two noise signals at 15∘ receiving azimuth, while K-means with power distance (in Figure 4(c)) fails to determine the signals of transmitter azimuth 30∘ (shown in yellow color) to be in the same cluster as other neighboring signals marked in red.
Clustering results for two MPCs in the same cluster arriving at the same time. (a) K-means with Eucl. dist., (b) DBSCAN with Eucl. dist., (c) K-means with power dist., and (d) DBSCAN with power dist.

Conclusions
In this paper, we applied two classic clustering algorithms to the multiband industrial wireless measurements. Different from previous solutions where the MPC is first identified from measurements, we propose a new process flow of preprocessing measurements, performing clustering, and post-processing the clustered results to facilitate extracting MPC cluster information. Inspired by the prior literature, we experimented with the metric of power distance together with traditional Euclidean distance in the two clustering algorithms. By evaluating the clustering results from time range identification as well as peak separation, we conclude that DBSCAN algorithms are performing well in identifying MPC clusters’ delay when there is only one MPC arriving at a time. For multiple MPCs arriving at the same time, K-means performs better when separating the MPCs. We observe that our algorithm is especially suitable for clustering high-frequency signals, e.g. in the THz range, thanks to the clear separation of arriving MPCs due to stronger attenuation. Future work includes automated parameter tuning of the clustering algorithms, as well as a detailed comparison of the clustering results in LOS and NLOS scenarios.
Acknowledgements
This work has been performed in part in the framework of the HORIZON JU-SNS-2022 project TIMES, cofunded by the European Union.
Competing interests
The author(s) declare none.

Mengfan Wu received a Bachelor’s degree in telecommunications from Tongji University, Shanghai, in 2018 and received his M.Sc. degree in electrical engineering and information technology from ETH Zurich in 2021. He is a doctoral student at Huawei Munich Research Center and TU Berlin. His main research interests are federated learning algorithms and machine learning solutions for high-frequency telecommunications.

Mate Boban received the Ph.D. degree in electrical and computer engineering from Carnegie Mellon University. He is a technical expert and team leader with Huawei Munich Research Center, Germany. Currently, he is a co-chair of COST INTERACT WG1 (Radio Channels) and a vice-chair of ETSI Industry Specification Group (ISG) on THz. He has co-chaired several IEEE conferences and workshops, was an Associate Editor of IEEE TMC, and has been actively involved in EU-funded 5G and 6G projects. His current research interests are in channel modeling and machine learning for radio access networks.

Falko Dressler (Fellow, IEEE) is full professor and Chair for Data Communications and Networking at the School of Electrical Engineering and Computer Science, TU Berlin. He received his M.Sc. and Ph.D. degrees from the Department of Computer Science, University of Erlangen in 1998 and 2003, respectively. Dr Dressler has been associate editor-in-chief for IEEE Trans. on Mobile Computing and Elsevier Computer Communications as well as an editor for journals such as IEEE/ACM Trans. on Networking, IEEE Trans. on Network Science and Engineering, Elsevier Ad Hoc Networks, and Elsevier Nano Communication Networks. He has been chairing conferences such as IEEE INFOCOM, ACM MobiSys, ACM MobiHoc, IEEE VNC, and IEEE GLOBECOM. He authored the textbooks Self Organization in Sensor and Actor Networks published by Wiley & Sons and Vehicular Networking published by Cambridge University Press. He has been an IEEE Distinguished Lecturer as well as an ACM Distinguished Speaker. Dr Dressler is an IEEE Fellow as well as an ACM Distinguished Member. He is a member of the German National Academy of Science and Engineering (acatech). He has been serving on the IEEE COMSOC Conference Council and the ACM SIGMOBILE Executive Committee. His research objectives include adaptive wireless networking (sub-6GHz, mmWave, visible light, molecular communication) and wireless-based sensing with applications in ad hoc and sensor networks, the Internet of Things, and cyber-physical systems.