





1. Introduction
Observations of both local and high-redshift starburst systems (McCrady and Graham Reference McCrady and Graham2007; Levy et al. Reference Levy, Bolatto and Mayya2024; Vanzella et al. Reference Vanzella, Claeyssens and Welch2023; Adamo et al. Reference Adamo, Bradley and Vanzella2024) have shown that massive star clusters can be born with high effective stellar surface densities (
 $\Sigma_\mathrm{eff}$
) in excess of
 $10^{4-5}$
 $\mathrm{M}_\odot$
pc
 $^{-2}$
. Some of the massive and dense clusters may be the progenitors of globular clusters (GCs) (Portegies Zwart et al. Reference Portegies Zwart, McMillan and Gieles2010) that are nowadays ubiquitous in almost all galaxies (Forbes et al. Reference Forbes, Read, Gieles and Collins2018) but whose origins remain poorly understood (Bastian and Lardo Reference Bastian and Lardo2018).
Numerical simulations of star-forming clouds (Fujii et al. Reference Fujii, Wang, Tanikawa, Hirai and Saitoh2024; Chon and Omukai Reference Chon and Omukai2025) and stellar N-body systems (Portegies Zwart et al. Reference Portegies Zwart, Baumgardt and Hut2004; Arca Sedda et al. Reference Arca Sedda, Kamlah and Spurzem2023; Rantala et al. Reference Rantala, Naab and Lahén2024; Rantala et al. Reference Rantala, Lahén, Naab, Escobar and Iorio2025; Vergara et al. Reference Vergara, Askar and Kamlah2025) indicate that at such high densities stellar collisions and sink particle accretion may lead to the mass growth of very massive stars (VMS;
 $\gt100$
 $\mathrm{M}_\odot$
) in the cores of the clusters. The growth can result in stellar masses beyond the typical upper mass limit of 100–300
 $\mathrm{M}_\odot$
observed in local young stellar systems (Brands et al. Reference Brands, de Koter and Bestenlehner2022), into the extremely massive or supermassive regime (SMS;
 $\gt1000$
 $\mathrm{M}_\odot$
). Evolutionary pathways of VMSs and SMSs, including binary stellar interactions, could provide a significant source of chemical enrichment (e.g. Langer et al. Reference Langer, Hoffman and Sneden1993; Prantzos et al. Reference Prantzos, Charbonnel and Iliadis2007; Maeder and Meynet Reference Maeder and Meynet2006; de Mink et al. Reference de Mink, Pols, Langer and Izzard2009; Denissenkov and Hartwick Reference Denissenkov and Hartwick2014) operating on a time scale of a few Myrs. VMSs and SMSs can also act as progenitors of intermediate mass black holes (IMBHs;
 $\gt100$
 $\mathrm{M}_\odot$
) especially in the low metallicity of the proto-GC-forming regions where mass-loss through stellar winds is weaker than at solar metallicity (Vink Reference Vink2018; Sabhahit et al. Reference Sabhahit, Vink, Sander and Higgins2023). As such, VMSs and SMS may provide a solution to both the mass-budget problem of multiple stellar population in GCs (e.g. Bastian and Lardo Reference Bastian and Lardo2018; Gratton et al. Reference Gratton, Bragaglia, Carretta, D’Orazi, Lucatello and Sollima2019 and references therein) and the origin of massive black hole seeds (e.g. Regan and Volonteri Reference Regan and Volonteri2024 and references therein). Because VMSs and SMSs beyond a few 100
 $\mathrm{M}_\odot$
still elude direct observations (Kuruvanthodi et al. Reference Kuruvanthodi, Schaerer and Messa2023), simulations of the formation and evolution of dense stellar systems with attention to stellar evolution are profoundly important for deciphering the impact of massive stars on the chemical composition and the spatio-kinematic structure of GCs and their host galaxies.
Several galaxy evolution codes nowadays include detailed treatment of the ISM, stellar evolution and gravitational dynamics (Dinnbier and Walch Reference Dinnbier and Walch2020; Fujii et al. Reference Fujii, Saitoh, Wang and Hirai2021; Jo et al. Reference Jo, Kim, Kim and Bryan2024; Bernard et al. Reference Bernard, Moraux and Price2025). The Galaxy Realizations Including Feedback From INdividual massive starsFootnote † (griffin) project is, however, thus far the only simulation set that combines all of these key ingredients in star-by-star simulations of galaxy evolution (Partmann et al. Reference Partmann, Naab and Lahén2025; Lahén et al. Reference Lahén, Rantala and Naab2025b). This IAU conference proceedings collects some main results on star cluster formation and evolution in the griffin project. We focus on the properties of the most massive star clusters formed in star-by-star simulations that model galaxy evolution and the evolution and interplay of stars and the interstellar medium (ISM) at low metallicity.
2. Modelling globular cluster formation in a galactic context
Details of the smoothed particle hydrodynamics simulation (SPH) code sphgal can be found in Hu et al. (Reference Hu, Naab, Walch, Moster and Oser2014, Reference Hu, Naab, Walch, Glover and Clark2016, Reference Hu, Naab, Glover, Walch and Clark2017); Hu (Reference Hu2019); Lahén et al. (Reference Lahén, Naab and Kauffmann2023); Partmann et al. (Reference Partmann, Naab and Lahén2025); Lahén et al. (Reference Lahén, Rantala and Naab2025b). sphgal is an updated version of the gadget-3 code (Springel Reference Springel2005). For star clusters the main features include the modelling of non-equilibrium cooling and heating processes at low ISM temperatures (
 $\lt3\times 10^4$
K) using a chemical network (H
 $_2$
, H
 $^+$
, H, CO, C
 $^+$
, O and free electrons) and using tabulated metallicity dependent cooling rates from Wiersma et al. (Reference Wiersma, Schaye and Smith2009) at higher ISM temperatures; the modelling of star formation and stellar evolution star-by-star assuming an input initial stellar mass function (IMF; Section 2.1); and the ketju integration module for gravitational dynamics (Section 2.3). The simulations assume a fixed metallicity of
 $0.1$
 $\mathrm{Z}_\odot$
(Lahén et al. Reference Lahén, Naab, Johansson, Elmegreen, Hu and Walch2020a) or
 $0.01$
 $\mathrm{Z}_\odot$
(since Lahén et al. Reference Lahén, Naab and Kauffmann2023).
2.1. Star formation
The griffin simulations have typically utilized a gas mass resolution of a few solar masses, here namely 4
 $\mathrm{M}_\odot$
. This resolution guarantees that the evolution and impact of supernova events can be modelled as injections of
 $10^{51}$
erg of thermal energy without overcooling in the majority of the cases (Hu et al. Reference Hu, Naab, Walch, Glover and Clark2016; Steinwandel et al. Reference Steinwandel, Moster, Naab, Hu and Walch2020). For treatment of individual stars we have recently introduced a method that samples stellar masses from the Kroupa (Reference Kroupa2001) IMF between 0.08
 $\mathrm{M}_\odot$
and 500
 $\mathrm{M}_\odot$
(Lahén et al. Reference Lahén, Naab and Kauffmann2023). When releasing stellar feedback, the code takes into account the initial mass of each star, while gravitational dynamics are treated according to the current stellar mass.
Star formation occurs in gas for which the Jeans mass
 \begin{equation} M_\mathrm{J} = \frac{\pi^{5/2}c_\mathrm{s}^3}{6G^{3/2}\rho^{1/2}}\end{equation}
is no longer well resolved and reaches a threshold defined as half of the SPH kernel mass, i.e.
 $M_\mathrm{J}\lt0.5 M_\mathrm{SPH}$
 $\sim 200$
 $\mathrm{M}_\odot$
. Here
 $c_\mathrm{s}$
is the sound speed,
 $\rho$
is the gas density and G is the gravitational constant. The particles that have been tagged as star forming are then decoupled from the hydrodynamics. Starting with the study in Lahén et al. (Reference Lahén, Naab and Kauffmann2023) we have used a time delay given by dynamical time scale
 $t_\mathrm{dyn}=(4\pi G \rho)^{-1/2}$
before proceeding with the sampling of the stars to mimic the gravitational collapse time scale. The sampling of the stars from the IMF is done via a locally mass conserving method. When the sampled stellar mass exceeds the particle mass of
 $\sim4$
 $\mathrm{M}_\odot$
, the method collects mass from other similar particles waiting to be sampled within the local volume of
 \begin{equation} R_\mathrm{J} = \left( \frac{3}{4\pi} \frac{M_\mathrm{J}}{\rho} \right) ^{1/3}.\end{equation}
This method was introduced to limit the random sampling of massive stars in regions of low star formation rate in line with the correlation between the maximum stellar mass and star cluster mass reported in observations (Weidner and Kroupa Reference Weidner and Kroupa2006) and cloud-scale simulations (e.g. Vázquez-Semadeni et al. Reference Vázquez-Semadeni, González-Samaniego and Coln2017; Grudic et al. Reference Grudic, Offner and Guszejnov2023).
In earlier work (e.g. Lahén et al. Reference Lahén, Naab, Johansson, Elmegreen, Hu and Walch2020a) we used the implementation for star formation and feedback described in Hu et al. (Reference Hu, Naab, Glover, Walch and Clark2017) except for the star formation threshold as described above.
2.2. Stellar evolution
Stars in our simulations act as sources of photoionizing radiation (
 $\gt13.6$
eV), far-ultraviolet radiation (FUV; 6–
 $13.6$
eV), stellar winds and supernovae. Detailed stellar evolution models and pair-instability supernovae models were introduced in Lahén et al. (Reference Lahén, Naab and Kauffmann2023). FUV causes photoelectric heating on dust grains for which we assume a fixed dust-to-gas mass ratio of
 $0.1Z$
. Massive stars (
 $\gt9$
 $\mathrm{M}_\odot$
) evolve according to their initial mass and metallicity as described by the Bonn Optimized Stellar Tracks (BoOST; Szécsi et al. Reference Szécsi, Agrawal, Wünsch and Langer2022). Stars with initial masses between 8–40
 $\mathrm{M}_\odot$
explode as core-collapse supernovae and stars with final helium core masses between 65–133
 $\mathrm{M}_\odot$
(corresponding to initial mass between
 $107.2$
–
 $203.4$
 $\mathrm{M}_\odot$
at 1%
 $\mathrm{Z}_\odot$
) explode as pair-instability supernovae, with properties interpolated according to Chieffi and Limongi (Reference Chieffi and Limongi2004) and Heger and Woosley (Reference Heger and Woosley2002) respectively. Stars with initial masses between
 $0.5$
–8
 $\mathrm{M}_\odot$
release a burst of asymptotic giant branch winds with chemical yields according to Karakas Reference Karakas2010. Lower mass stars receive fixed zero-age main sequence photoionization rates and FUV radiation luminosities from the Geneva stellar models at the corresponding initial metallicity (Georgy et al. Reference Georgy, Ekström and Eggenberger2013; Groh et al. Reference Groh, Ekström and Georgy2019) combined with the BaSeL spectral library (Lejeune et al. Reference Lejeune, Cuisinier and Buser1997, Reference Lejeune, Cuisinier and Buser1998; Westera et al. Reference Westera, Lejeune, Buser, Cuisinier and Bruzual2002). Chemical evolution in the galaxy is followed by tracing 13 chemical elements: H, He, N, C, O, Si, Al, Na, Mg, Fe, S, Ca and Ne.
The treecol algorithm (Clark et al. Reference Clark, Glover and Klessen2012) is used to compute the intensity of the FUV radiation field at the location of each gas particle, accounting for dust and gas self-shielding in 12 solid angles divided using the healpix algorithm (Górski and Hivon Reference Górski and Hivon2011). Energy and ejecta from stellar winds and supernovae are likewise distributed evenly around the stars using healpix, while photoionized HII regions are computed using overlapping Strömgren spheres.
2.3. Collisional stellar gravitational dynamics
The latest version of sphgal includes the gravitational dynamics module ketju (Rantala et al. Reference Rantala, Pihajoki, Johansson, Naab, Lahén and Sawala2017; Mannerkoski et al. Reference Mannerkoski, Rawlings and Johansson2023) that utilizes the algorithmically regularized mstar library (Rantala et al. Reference Rantala, Pihajoki, Mannerkoski, Johansson and Naab2020). In brief, non-softened interactions are computed for stellar particles (i.e. stars and their remnants) that are within a spherical region of radius
 $r_i$
placed around any star with initial mass in excess of
 $m_i$
. This guarantees that all two and few body interactions near massive stars, especially important in the cores of star clusters, are regularized.
The computational cost of collisional dynamics performed with ketju scale with the number of particles in the regularized regions and the number of regularized regions. The parameters controlling these quantities have in our simulations been set in the range of
 $r_i=0.03$
–0.3 pc and
 $m_i=3$
–8
 $\mathrm{M}_\odot$
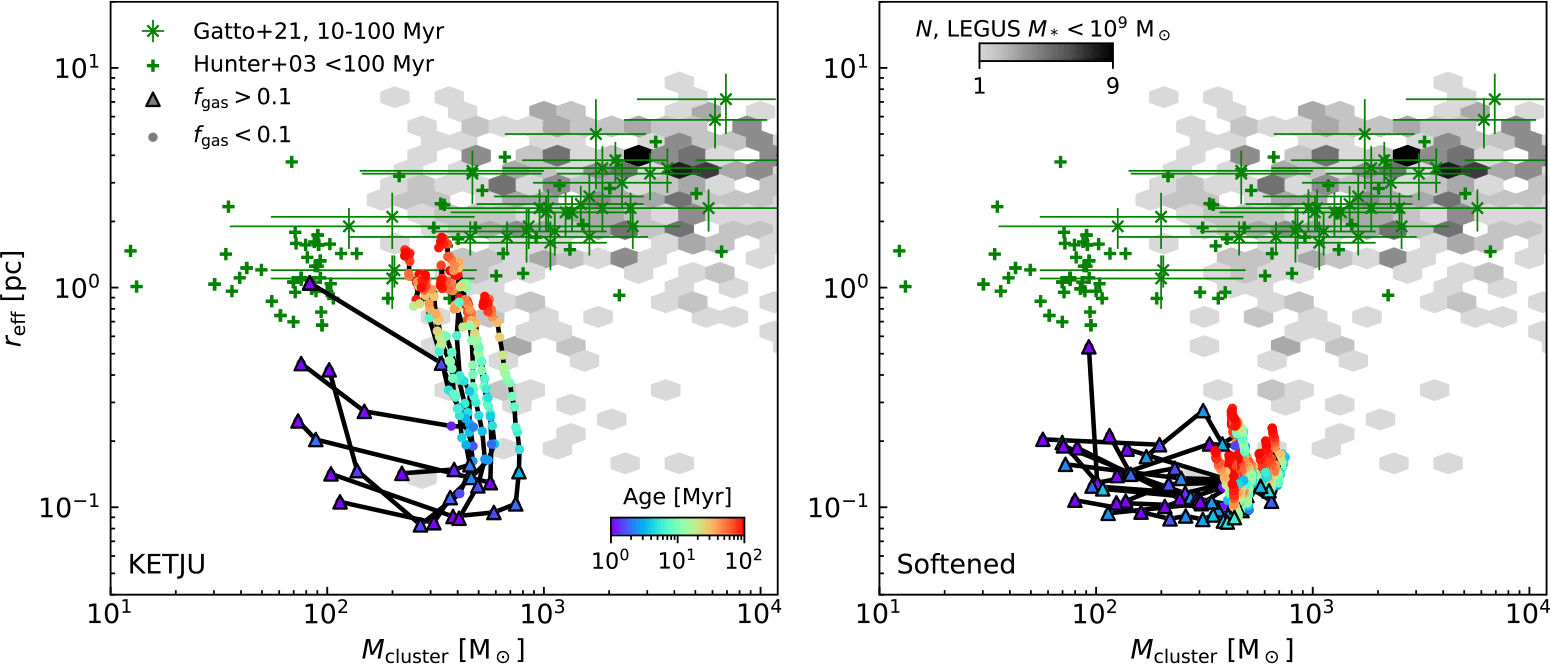
. Comparing with direct N-body simulations with bifrost (Rantala et al. Reference Rantala, Naab and Rizzuto2023) and simulations performed with standard softened gravity, these values have proven to significantly improve the internal evolution of star clusters while minimizing the computational cost (Lahén et al. Reference Lahén, Rantala and Naab2025b). Fig. 1 shows the long-term evolution of selected star clusters in isolated dwarf galaxy simulations (see Section 2.4) with sphgal, comparing the results using ketju to those employing a 0.1 pc gravitational softening length and the standard leap-frog integrator in gadget-3. Fig. 1 includes clusters that have a maximum bound stellar mass of 400–900
 $\mathrm{M}_\odot$
. We highlight epochs when the clusters are still embedded, defined as the inner 1 pc composed of at least 10% of gas. The clusters form compact but expand rapidly to match with the observed data from the Legacy ExtraGalactic UV Survey (LEGUS; Brown and Gnedin Reference Brown and Gnedin2021) and the Magellanic Clouds (Gatto et al. Reference Gatto, Ripepi and Bellazzini2021; Hunter et al. Reference Hunter, Elmegreen, Dupuy and Mortonson2003) when ketju is enabled, while the clusters run with softened gravity remain too compact.
The evolution of mass and projected half-mass radius of gravitationally bound star clusters (maximum mass 400–900
 $\mathrm{M}_\odot$
) in a low-metallicity dwarf galaxy simulated with the sphgal code combined with the ketju integration module to solve stellar gravitational interactions in the vicinity of stars that are initially more massive than 3
 $\mathrm{M}_\odot$
(left), compared to a simulation where all gravitational interactions are softened (right). The evolution tracks are coloured with cluster mean stellar age and the triangles show times when the clusters are still embedded with 10% of their mass within 1 pc in gas. The observational data are star clusters younger than 100 Myr in low-mass galaxies (
 $M_*\lt10^9$
 $\mathrm{M}_\odot$
) in the LEGUS survey (hexbins, Brown and Gnedin Reference Brown and Gnedin2021) and in the Magellanic Clouds (green crosses from Gatto et al. Reference Gatto, Ripepi and Bellazzini2021 and pluses from Hunter et al. Reference Hunter, Elmegreen, Dupuy and Mortonson2003. Adapted from (Lahén et al. Reference Lahén, Rantala and Naab2025b).

Figure 1 Long description
Panel A: A scatter plot titled 'KETJU' shows the evolution of mass and projected half-mass radius of gravitationally bound star clusters in a low-metallicity dwarf galaxy. The x-axis represents the cluster mass in solar masses (M☉) on a logarithmic scale from 10^1 to 10^4. The y-axis represents the effective radius in parsecs (pc) on a logarithmic scale from 10^-1 to 10^1. The data points are colored by cluster mean stellar age, ranging from blue (younger) to red (older). Triangles indicate times when clusters are still embedded with 10% of their mass within 1 pc in gas. Observational data from star clusters younger than 100 Myr in low-mass galaxies are shown as hexbins and green crosses. Panel B: A scatter plot titled 'Softened' shows a similar comparison for a simulation where all gravitational interactions are softened. The axes and data representations are consistent with Panel A.
With the introduction of collisional stellar dynamics, we have further introduced a model for stellar collisions and tidal disruption events by stellar black holes in Lahén et al. (Reference Lahén, Naab, Rantala and Partmann2025a). We have adopted the simplified stellar evolution methodology following N-body simulations (e.g. Hurley et al. Reference Hurley, Pols and Tout2000) wherein a stellar collision product follows the evolutionary track of a star that has a matching current mass while preserving the fractional stellar age as given by
 $f_\mathrm{age}=\mathrm{age}/\mathrm{lifetime}$
. Tidal disruption events are detected using the tidal radius given by
 \begin{equation} r_\mathrm{tidal} = 1.3 r_\mathrm{*} \left(\frac{m_\mathrm{BH}+m_\mathrm{*}}{2m_\mathrm{*}}\right)^{1/3}\end{equation}
where
 $r_\mathrm{*}$
is the current radius of the star and
 $m_\mathrm{*}$
and
 $m_\mathrm{BH}$
are the mass of the star and the black hole (Kochanek Reference Kochanek1992). Following N-body and Monte Carlo approaches (e.g. Giersz et al. Reference Giersz, Leigh, Hypki, Lützgendorf and Askar2015; Rizzuto et al. Reference Rizzuto, Naab and Rantala2023), half of the stellar mass is accreted by the black hole (Rees Reference Rees1988) while the rest is removed from the simulation.
2.4. Initial conditions and simulation parameters
The simulations discussed here use a gas-rich disk galaxy model that is based on the Local Group galaxy Wolf–Lundmark–Melotte as first described in Hu et al. (Reference Hu, Naab, Walch, Glover and Clark2016, Reference Hu, Naab, Glover, Walch and Clark2017) and constructed using the methods of Springel (Reference Springel2005). The initial galaxy model has a virial mass of
 $4\times 10^{10}$
 $\mathrm{M}_\odot$
that consists of a
 $4\times 10^7$
 $\mathrm{M}_\odot$
gas disk and a
 $2\times 10^7$
 $\mathrm{M}_\odot$
old stellar disk. The disk scale length is typically 0.73 kpc; an extended configuration with scale length 1.46 kpc for gas was used in Lahén et al. (Reference Lahén, Naab and Johansson2020b). The rest of the galaxy mass is dark matter. The initial mass resolution for baryonic matter is 4
 $\mathrm{M}_\odot$
and
 $\sim6800$
 $\mathrm{M}_\odot$
for dark matter. The initial metallicity is set low, as
 $\sim0.01$
 $\mathrm{Z}_\odot$
(Lahén et al. Reference Lahén, Naab and Szécsi2024; Lahén et al. Reference Lahén, Rantala and Naab2025b,a) or
 $\sim0.1$
 $\mathrm{Z}_\odot$
(Lahén et al. Reference Lahén, Naab and Johansson2020b). We have run both isolated galaxy simulations and galaxy merger simulations using two identical galaxy models set on collision orbit. The approach orbits have been described in Lahén et al. (Reference Lahén, Naab and Johansson2020b) and Lahén et al. (Reference Lahén, Naab and Szécsi2024). Gravitational softening is set as 62 pc for dark matter, 0.1 pc for gas and disk particles, and 0.01 or 0.1 pc for new star particles.
3. Massive star clusters form hierarchically and with high stellar densities
The first galaxy-scale griffin simulations showed that massive star clusters form rapidly over a timescale of less than 10 Myr (Lahén et al. Reference Lahén, Naab and Johansson2020b). The later models confirmed this result also at lower metallicity (Lahén et al. Reference Lahén, Naab and Szécsi2024). The gravitationally bound clusters exhibit a mass function that has a power-law slope close to
 $-2$
, and the normalization and upper mass limit increase with increasing star formation rate. The mass function starts to turn over below 1000
 $\mathrm{M}_\odot$
. In observations, the power-law slope of the high-mass end is often approximately
 $-2$
(Hunter et al. Reference Hunter, Elmegreen, Dupuy and Mortonson2003; Fall and Chandar Reference Fall and Chandar2012; Adamo et al. Reference Adamo, Hollyhead and Messa2020) as well. Simulated parameter studies e.g. by Andersson et al. (Reference Andersson, Mac Low, Agertz, Renaud and Li2024) have shown that energetic pre-supernova feedback helps regulate the shape of the cluster mass function into a
 $-2$
power-law. This is because radiative feedback is critical for setting the phase-structure of the ISM (e.g. Hu et al. Reference Hu, Naab, Glover, Walch and Clark2017; Rathjen et al. Reference Rathjen, Naab and Girichidis2021; Dobbs et al. Reference Dobbs, Bending, Pettitt and Bate2022) before the hot-phase generating supernovae occur (Steinwandel et al. Reference Steinwandel, Moster, Naab, Hu and Walch2020).
The clusters formed in the first griffin simulations of the dwarf starburst environment (Lahén et al. Reference Lahén, Naab and Johansson2020b) showed radial stellar density profiles similar to those in young massive clusters and evolved GCs (McLaughlin and van der Marel Reference McLaughlin and van der Marel2005), however the early internal evolution remained uncertain due to the use of gravitational softening below distances of
 $0.1$
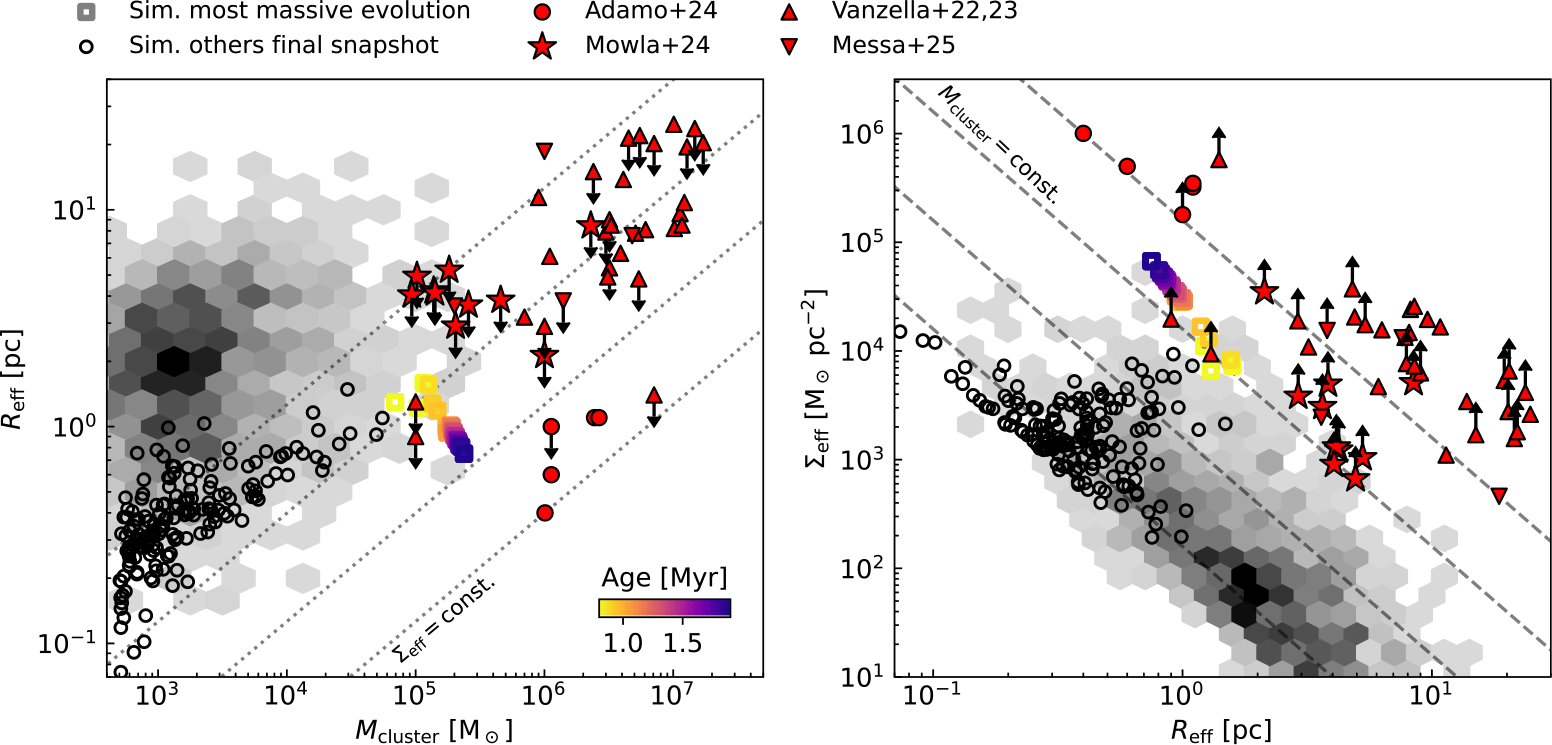
pc. In addition, the currently best-resolved observational size estimates (e.g. Vanzella et al. Reference Vanzella, Castellano and Bergamini2022b, Reference Vanzella, Claeyssens and Welch2023; Adamo et al. Reference Adamo, Bradley and Vanzella2024) of young proto-GCs in rest-frame UV from higher redshifts were still to come after the launch of James Webb Space Telescope (JWST) in 2021. Using simulations of the long-term evolution of low-mass clusters in low-metallicity dwarf galaxies using sphgal together with the ketju module in Lahén et al. (Reference Lahén, Rantala and Naab2025b), we showed that gravitational softening can suppress the expansion of star clusters despite stellar evolution driven mass loss. Employing the ketju module in a starburst simulation in Lahén et al. (Reference Lahén, Naab, Rantala and Partmann2025a) we confirmed that the initial stellar densities of young, massive and low-metallicity clusters can reach the high values reported in the new gravitational lensing surveys. Fig. 2 shows the sizes and the surface densities of the final population of star clusters in Lahén et al. (Reference Lahén, Naab, Rantala and Partmann2025a) and the size evolution of the most massive cluster through its assembly. The simulated results are compared with young star clusters in the LEGUS survey and in several recent observations of strongly lensed clusters at redshifts greater than
 $z\sim2.4$
. Our results support the high stellar densities found in cloud-scale (magneto-)hydrodynamical simulations by Fujii et al. (Reference Fujii, Wang, Tanikawa, Hirai and Saitoh2024), Polak et al. (Reference Polak, Mac Low and Klessen2024) and Cournoyer-Cloutier et al. (Reference Cournoyer-Cloutier, Sills and Harris2024), now for the first time accounting for stellar evolution and accurate gravitational dynamics in larger scale galactic environments.
The mass (
 $M_\mathrm{cluster}$
), effective radius (
 $R_\mathrm{eff}$
) and effective surface density (
 $\Sigma_\mathrm{eff}$
) of simulated star clusters in a dwarf starburst with initial metallicity of 1%
 $\mathrm{Z}_\odot$
. The black circles are young (
 $\lt4$
Myr) star clusters in the final snapshot and the colored points show the build-up of mass in the most massive cluster starting when its most massive progenitor cluster was 25% of the final cluster mass. Observed data are young (
 $\lt10$
Myr) star clusters from the LEGUS survey (hexbins, number of clusters increases with darker hue, Brown and Gnedin Reference Brown and Gnedin2021) and higher redshift (
 $z\gtrsim2.4$
) gravitationally lensed clusters (Vanzella et al. Reference Vanzella, Castellano and Bergamini2022a,b, Reference Vanzella, Claeyssens and Welch2023; Adamo et al. Reference Adamo, Bradley and Vanzella2024; Mowla et al. Reference Mowla, Iyer and Asada2024; Messa et al. Reference Messa, Vanzella and Loiacono2025). The dotted lines indicate values of constant
 $\Sigma_\mathrm{eff}$
from
 $10^3$
to
 $10^6$
 $\mathrm{M}_\odot$
pc
 $^{-2}$
on the left and constant
 $M_\mathrm{cluster}$
from
 $10^3$
to
 $10^6$
 $\mathrm{M}_\odot$
on the right. Adapted from Lahén et al. (Reference Lahén, Naab, Rantala and Partmann2025a).

The initial stellar surface densities of young massive clusters in our simulations show radial power-law profiles of approximately
 $R^{-2.2}$
down to an inner radius of less than 1 pc. Previous simulations on cluster scales have shown that a
 $\sim-2$
power-law slope is the expected outcome of hierarchical assembly of massive clusters though mergers of stellar sub-clusters (Sills et al. Reference Sills, Rieder, Scora, McCloskey and Jaffa2018; Grudić et al. Reference Grudić, Guszejnov and Hopkins2018; Rantala et al. Reference Rantala, Naab and Lahén2024). Indeed, hierarchical assembly seems to be a natural feature in the most massive clusters found in our starburst models. As seen in Fig. 2, the final assembly product can end up with more than an order of magnitude higher effective surface density compared to the sub-clusters. This is due to star formation that is concentrated in the core of the cluster in the later stages of the assembly process.
The high stellar density in our simulated clusters, reaching more than
 $10^6$
 $\mathrm{M}_\odot$
pc
 $^{-3}$
in the core of the most massive cluster, lead to VMS collisions. When collisions occur, only one VMS per cluster grows in mass. The most massive star in the most massive cluster begins as a 150
 $\mathrm{M}_\odot$
VMS and collides with 5 other VMSs and one other massive star into a star with 1046
 $\mathrm{M}_\odot$
over a period of 1 Myr. The simulation is stopped at this epoch due to our lack of implemented stellar models that can describe the evolution of the collision product, however already at a mass of
 $\sim 10^3$
 $\mathrm{M}_\odot$
and a metallicity of 1%
 $\mathrm{Z}_\odot$
we except the star to result in an IMBH of at least a few 100
 $\mathrm{M}_\odot$
(Vink Reference Vink2018; Sabhahit et al. Reference Sabhahit, Vink, Sander and Higgins2023; Gieles et al. Reference Gieles, Padoan, Charbonnel, Vink and Ramrez-Galeano2025). We have therefore presented the first supporting results for the collisional growth of VMSs and their remnant IMBHs, expected from N-body and cloud-scale models, in star-by-star galaxy scale simulations.
4. Young massive star clusters rotate
While bulk rotation can arise through the interaction of the cluster stars with the tidal environment (Vesperini et al. Reference Vesperini, Varri, McMillan and Zepf2014), net rotation is a natural outcome of the hierarchical star formation process of star clusters (Mapelli Reference Mapelli2017) even if the clouds are not influenced by any external tidal effects. In Lahén et al. (Reference Lahén, Naab, Johansson, Elmegreen, Hu and Walch2020a) we showed that the most massive star clusters are born with the highest angular momenta. This angular momentum is inherited from the star-forming clouds and corresponds to approximately 30–40% of the initial angular momentum in the gas that forms each cluster. The clusters show global rotation at a rate of less than 10 km s
 $^{-1}$
, which peaks within the half-mass radius. In the most recent simulation (Lahén et al. Reference Lahén, Naab, Rantala and Partmann2025a), which includes a fully sampled IMF and collisional dynamics, we confirm this rotation signal in the most massive cluster. We find a line-of-sight rotation rate of
 $V_\mathrm{LOS}\sim$
7 km s
 $^{-1}$
and tangential rotation rate of
 $v_\mathrm{tan}\sim$
12 km s
 $^{-1}$
right after the cluster has formed most of its mass. The most massive clusters have ellipticities within effective radius of up to
 $\epsilon\sim0.2$
–0.3. The mildly elliptic shape agrees with observations and the rotation rates are higher than observed in evolved GCs (Bianchini et al. Reference Bianchini, van der Marel and del Pino2018), in line with the expectation that the rotation rate will reduce with time.
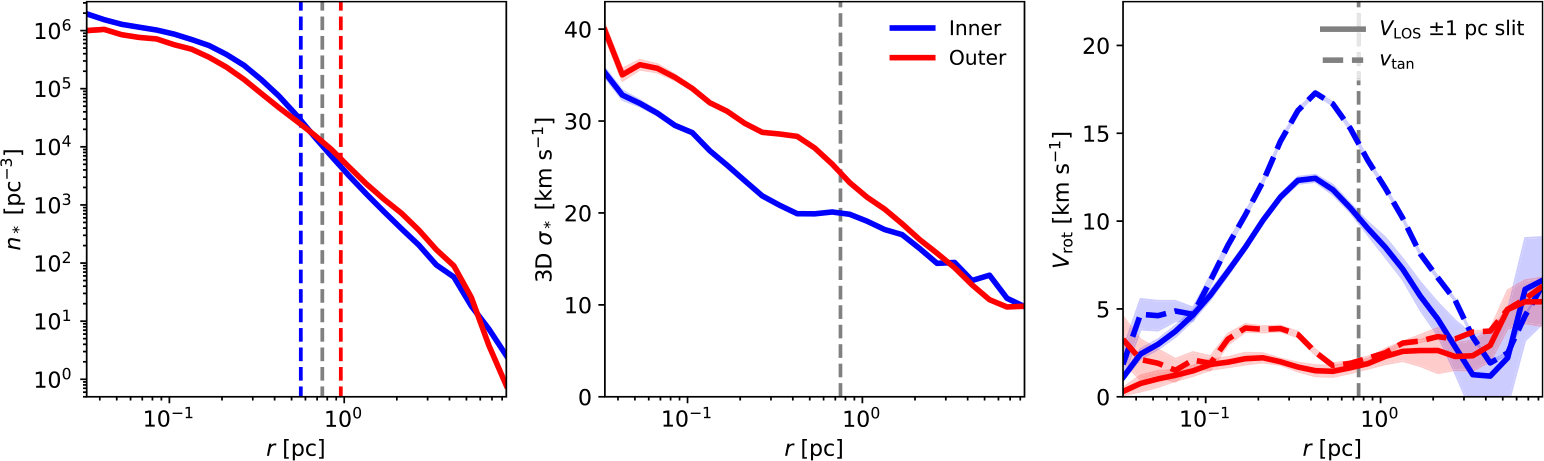
Fig. 3 shows the density profiles, velocity dispersions and rotation velocities for the cluster stars decomposed into stars that are younger or older than the mean stellar age of the cluster in the final snapshot in Lahén et al. (Reference Lahén, Naab, Rantala and Partmann2025a). This division results in two populations that span the 6 Myrs of star formation in two approximately 3 Myr halves. The older stars were mainly born during the hierarchical assembly phase and the younger stars formed predominantly in the central region of the cluster main body. This is reflected in the radial density profiles in the left panel, where the effective radius of the younger stars is smaller than that of the older stars even though the total masses of the populations are similar to within 7%. The older stars dominate the velocity dispersion while the younger stars dominate the bulk rotation in the cluster. The phase space of the relatively older stars, which formed while the hierarchical assembly was taking place, have relaxed as a result of the assembly and their rotation rate is very low compared to the later formed stars. The final rotation rate of the older stars matches well with the rotation rate obtained in direct N-body simulations (Rantala et al. Reference Rantala, Naab and Lahén2024; Rantala et al. Reference Rantala, Lahén, Naab, Escobar and Iorio2025) that use hierarchical sub-clustered initial conditions inspired by our previous simulations. On the other hand, the younger stars reach bulk 3D rotation rates in excess of 15 km s
 $^{-1}$
. The higher rotation rate of the younger stars is a results of their star formation history that is concentrated into a disky structure in the core of the cluster. This feature is only achievable in hydrodynamical models such as presented here and previously explored e.g. by Bekki (Reference Bekki2010); McKenzie and Bekki (Reference McKenzie and Bekki2021); Lacchin et al. (Reference Lacchin, Calura, Vesperini and Mastrobuono-Battisti2022).
Radial profiles of stellar number density (left), velocity dispersion (middle) and rotational velocity (right) for the cluster stars divided into those that are younger (blue) or older (red) than the mean stellar age of the cluster. The dashed grey lines in each panel indicate the effective radius of the entire cluster. We show both the projected line-of-sight rotation velocities (solid) and the tangential rotation velocities (dashed) on the right. Adapted from Lahén et al. (Reference Lahén, Naab, Rantala and Partmann2025a).

While observations of the kinematic structure of proto-GCs are still unobtainable, simulations can be used to infer the initial conditions that gave rise to the different kinematics sometimes observed in the multiple populations of present-day GCs (Richer et al. Reference Richer, Heyl and Anderson2013; Bellini et al. Reference Bellini, Vesperini and Piotto2015; Dalessandro et al. Reference Dalessandro, Cadelano and Della Croce2024; Leitinger et al. Reference Leitinger, Baumgardt and Cabrera-Ziri2025; Cordoni et al. Reference Cordoni, Casagrande and Milone2025). Our previous results in Lahén et al. (Reference Lahén, Naab and Szécsi2024) show that stellar winds by VMSs can be rapidly recycled in the cores of the clusters, on a time scale of a few Myr. If we make the assumption that the chemically peculiar stars observed in most GCs were formed as a result of chemical enrichment that occurred during the formation of those clusters, then we may deduce that they also formed in the later stages of the cluster assembly process. We have analysed the spatial and kinematic differences in the earlier and later formed stellar populations in the simulated most massive cluster in Lahén et al. (Reference Lahén, Naab, Rantala and Partmann2025a). Our results show that the later formed stars have a significantly higher bulk rotation rate than the stars that formed during the hierarchical phase of cluster assembly. Our results indicate that the higher rotation rates and central concentration of chemically peculiar stars compared to chemically field-like stars observed in some GCs (Martens et al. Reference Martens, Kamann and Dreizler2023; Leitinger et al. Reference Leitinger, Baumgardt, Cabrera-Ziri, Hilker and Pancino2023; Dalessandro et al. Reference Dalessandro, Cadelano and Della Croce2024; Leitinger et al. Reference Leitinger, Baumgardt and Cabrera-Ziri2025) could be a signature of hierarchical cluster assembly and rapid chemical enrichment in the high-redshift proto-GC-forming environments.
5. Conclusions and outlook
The griffin simulations have been the first attempt to model star cluster formation while self-consistently accounting for the galactic environment. Thanks to a variety of initial conditions, the simulations span systems from quiescent to starburst dwarf galaxies and cover orders of magnitude in density and thermal pressure in the ISM as well as in star formation rate. Our most recent models realize the entire IMF and treat the individual stars with methods that include state-of-the-art stellar evolution models and accurate gravitational dynamics. This allows us to probe the formation and evolution of star clusters across the cluster mass function from a few tens of solar masses up to the globular cluster mass range.
With a particle-based approach, we can easily trace the stars in each cluster to the gas reservoir that took part in their formation. Our results show that massive star clusters form hierarchically through filamentary collapse that involves inflows and outflows of gas on a scale of up to 100 parsecs. The integrated gas reservoir that is associated with the assembly of the most massive clusters can significantly exceed the mass of the final bound clusters (Lahén et al. in prep.). Due to the dynamic nature of the galactic ISM, the reservoir taking part in the formation of the massive clusters is not only associated with one cluster but can further contribute to star formation in other nearby regions as well. Such galaxy-scale simulations help us better understand the complex dynamical and chemical evolution of the ISM and e.g. the local star formation efficiency.
The star clusters inherit tens of per cents of the initial angular momentum in the progenitor gas. More massive clusters have larger rotation velocities, and the rotation in the clusters is dominated by stars formed in the central region of the main progenitor clusters. Meanwhile, the stars formed in the cores of the most massive clusters are also the most enriched in light chemical elements such as aluminum and sodium expelled by VMS winds and recycled into new stars. Together with chemical tracing that we separate into different channels (stellar winds, supernovae), we can begin to build a picture of the origin of the spatio-kinematic features of multiple populations in GCs. This will require further implementation of methods for evolving binary stars and the stellar collision products, as well as chemical enrichment through stellar collisions and tidal disruption events.
The authors gratefully acknowledge the Gauss Centre for Supercomputing e.V. (www.gauss-centre.eu) for funding this project by providing computing time on the GCS Supercomputer SUPERMUC-NG at Leibniz Supercomputing Centre (www.lrz.de) under project numbers pn49qi, and the Max Planck Computing and Data Facility for granting access to the FREYA cluster in Garching, Germany.
 M⊙
 M⊙
 M∗<109
 M⊙
 Mcluster
 Reff
 Σeff
 Z⊙
 <4
 <10
 z≳2.4
 Σeff
 103
 106
 M⊙
 −2
 Mcluster
 103
 106
 M⊙

 Open access

