1. Introduction
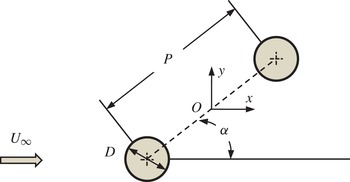
Flow around a cylinder undergoes substantial changes when it is a member of a group of cylinders in close proximity. The simplest case of a group of cylinders is two identical circular cylinders with various arrangements, which have been widely studied in the recent decades. Figure 1 shows a sketch of two identical cylinders in a staggered arrangement, which is the object of this study. Flow characteristics around the two-cylinder system are understandably dependent on the pitch ratio
 $P/D$
, flow approaching angle
 ${\it\alpha}$
and Reynolds number. The Reynolds number is defined as
 $\mathit{Re}=U_{\infty }D/{\it\nu}$
, where
 $U_{\infty }$
is the free-stream velocity and
 ${\it\nu}$
is the kinematic viscosity of the fluid.
A schematic representation of flow around two cylinders. The approaching uniform flow
 $U_{\infty }$
is from left to right. The cylinders of diameter
 $D$
are represented by two circles. The flow approach angle
 ${\it\alpha}$
is defined relative to the line linking the centres of the cylinders.

A variety of flow interferences have been studied around two cylinders, such as interactions between the shear layers, vortex shedding and the Kármán vortex streets at the downstream. These interferences present a rich spectrum of flow features, accompanied by a great diversity of forces and other parameters on the structures. Zdravkovich (Reference Zdravkovich1977, Reference Zdravkovich1987) classified the flow field into two basic types of interference based on the location of the downstream cylinder with respect to the upstream one, i.e. the wake interference and the proximity interference. For the convenience of discussions, the upstream and downstream cylinders are referred to as Cyl_up and Cyl_down respectively, here afterwards. The wake interference is obvious when the two cylinders are in a tandem arrangement (
 ${\it\alpha}=0^{\circ }$
), where one cylinder is submerged in the wake of the other. The proximity interference occurs when the two cylinders are close to one another, but neither is in the wake of the other, as in the side-by-side configuration (
 ${\it\alpha}=90^{\circ }$
). Both wake and proximity interferences may present in flow around two cylinders in a staggered arrangement.
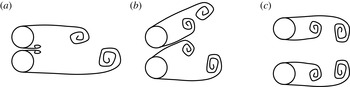
Igarashi (Reference Igarashi1981, Reference Igarashi1984) identified eight different flow regimes for flow past two tandem cylinders, which were later narrowed down into three (Zdravkovich Reference Zdravkovich1987; Xu & Zhou Reference Xu and Zhou2004; Sumner Reference Sumner2010), namely: (i) extended-body regime at small pitch ratios, where the two cylinders behave as a single bluff-body; (ii) reattachment regime at intermediate pitch ratios, where the separated shear layers from the upstream cylinder reattach to the downstream cylinder; and (iii) co-shedding regime at large pitch ratios, where Kármán vortices are shed from both cylinders. Schematic profiles of these flow regimes based on Zdravkovich (Reference Zdravkovich1987) and Xu & Zhou (Reference Xu and Zhou2004) are shown in figure 2. The overlaps of pitch ratios shown in figure 2 for different flow regimes are likely due to the differences in Reynolds number in these studies.
A broad classification of the flow regimes for two tandem circular cylinders in steady current, reproduced from Zdravkovich (Reference Zdravkovich1987) and Xu & Zhou (Reference Xu and Zhou2004). The approach flow is from left to right: (a) extended body regime
 $1<P/D<2$
; (b) reattachment regime
 $1.2<P/D<5.0$
; (c) co-shedding regime
 $P/D>3.4$
.

Flow around two side-by-side cylinders has also been studied extensively. Three flow regimes around two side-by-side cylinders have been identified by Sumner (Reference Sumner2010). They are: (i) single-bluff-body regime at small pitch ratios, where the two cylinders are close enough to act as a single structure; (ii) biased flow regime at intermediate pitch ratios, where the gap flow deflects towards one of the two cylinders, resulting in an asymmetric flow field; and (iii) parallel vortex streets at large pitch ratios, where a symmetric Kármán vortex street is observed behind each cylinder. The aforementioned flow regimes for two side-by-side cylinders are illustrated in figure 3. Again, the flow features at two adjacent flow regimes are sensitive to Re.
A broad classification of flow regimes for two side-by-side circular cylinders in steady current, reproduced from Sumner (Reference Sumner2010): (a) single-bluff-body regime
 $1<P/D<1.2$
; (b) biased flow regime
 $1.1<P/D<2.2$
; (c) parallel vortex streets regime
 $P/D>2.0$
. The approach flow is from left to right.

Flow around two cylinders in staggered arrangement is also commonly encountered in practical applications. The side-by-side and tandem arrangements of two cylinders mentioned above are two special cases of the two staggered cylinders (Hu & Zhou Reference Hu and Zhou2008a
). Most experimental studies about flow past two staggered cylinders were carried out at the high end of the subcritical flow regime for an isolated cylinder. Classifications of flow regimes around two staggered cylinders have been discussed in several studies. By examining pressure distributions and flow fields, Gu & Sun (Reference Gu and Sun1999) identified three flow interference patterns for
 $P/D$
ranging from 1.1 to 3.5 and Re ranging from
 $2.2\times 10^{5}$
to
 $3.3\times 10^{5}$
, which are referred to as wake interference, shear layer interference and neighbourhood interference. Sumner, Price & Paidoussis (Reference Sumner, Price and Paidoussis2000) identified nine different flow patterns through detailed flow visualizations, which include shear layer reattachment and separation, vortex pairing, synchronization and impingement. The studies by Hu & Zhou (Reference Hu and Zhou2008a
,Reference Hu and Zhou
b
) focused on the evolution of flow structures, Strouhal number in the wake, and the heat and momentum transfer in the flow in the wake of two staggered cylinders. The wake flow fields at
 $\mathit{Re}=7000$
were classified into four regimes based on flow visualizations and Strouhal numbers, namely the two single-wake regimes and two twin-wake regimes. It is clear from the existing studies that the flow behaviour is heavily dependent on the arrangement of the cylinders. Sumner (Reference Sumner2010) provided a comprehensive review on the experimental studies on flow around two staggered cylinders. It was suggested that the flow patterns around two staggered cylinders can be classified into three broad regimes, which are named single-bluff-body flow regimes, small-incidence-angle flow regimes, and large-incidence-angle flow regimes (Sumner Reference Sumner2010). The flow regimes shown in figures 2 and 3 are the fundamental elements of the flow patterns identified for two staggered cylinders so far.
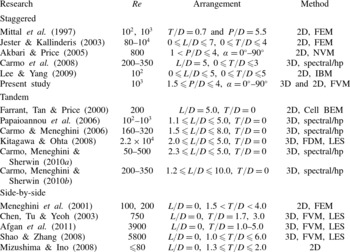
Numerical studies of flow around two staggered cylinders have been rather limited. Most available numerical studies are carried out at low Re values using two-dimensional (2D) models. This was likely attributed to the limitation of available computational power to resolve the complicated flow field. The only three-dimensional (3D) numerical study on two staggered cylinders (Carmo et al. Reference Carmo, Sherwin, Bearman and Willden2008) focuses on Floquet stability analysis of wake transitions from two to three dimensions. No 3D numerical work has been carried out to investigate the effect of pitch ratio and alignment angle on vortex shedding and hydrodynamic forces on two staggered cylinders, although this has been carried out in many 2D numerical simulations (Mittal, Kumar & Raghuvanshi Reference Mittal, Kumar and Raghuvanshi1997; Jester & Kallinderis Reference Jester and Kallinderis2003; Akbari & Price Reference Akbari and Price2005; Lee & Yang Reference Lee and Yang2009). Table 1 summarizes the numerical investigations on steady flow around two staggered cylinders, known to the authors, together with selected numerical studies on two cylinders in both side-by-side and tandem arrangements.
Selected numerical studies of two staggered circular cylinders in cross-flow (cylinders in the tandem and side-by-side configurations are also included). 2D
 $=$
two-dimensional study; 3D
 $=$
three-dimensional study; FEM
 $=$
finite-element method; NVM
 $=$
numerical vortex method; IBM
 $=$
immersed boundary method; FDM
 $=$
finite difference method; LES
 $=$
large eddy simulation.

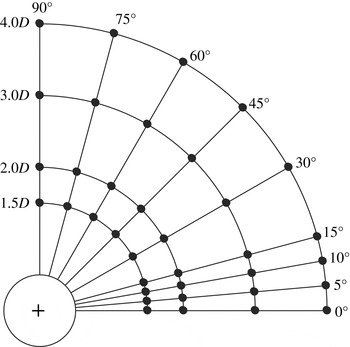
With the rapid increase in computational power in recent years, numerical studies have been widely used to understand the underlying physics of many complex flow problems due to their unique attributes over experimental investigations. To this end, this work presents a numerical study on the effects of pitch ratio and alignment angle on steady flow around two staggered cylinders near the lower end of the subcritical Re regime with
 $\mathit{Re}=10^{3}$
. Figure 4 presents a summary of the parameter space covered in this study. A total of four pitch ratios (1.5, 2, 3 and 4) and nine alignment angles are considered in the present study. The selected pitch ratios cover all possible flow regimes (based on the knowledge derived from existing experimental studies), while the alignment is chosen based on the consideration that the forces and flow features are sensitive to
 ${\it\alpha}$
at small alignment angles. Although much of the result is based on 3D numerical simulations, 2D simulations are also provided to explain some fluid features. The 2D simulation is not expected to capture the physics of the flow at
 $\mathit{Re}=10^{3}$
, but it numerically disposes the flow in the third direction thus provides a way to estimate the influence of 3D flow. The remainder of the paper is organized in the following manner. In § 2, the numerical model and model validations are presented, while § 3 presents the forces and pressure distributions on both cylinders. Vortex shedding frequencies are discussed in § 4, followed by the discussion on the flow characteristics in § 5. Finally, the conclusions are given in § 6.
A schematic summary of the present simulation cases of two cylinders in staggered arrangements:
 $+$
represents the centre of one cylinder and ● represent the centre of the second cylinder.

2. Numerical model
2.1. Numerical method
Steady uniform flow around the two-cylinder system is simulated by solving the incompressible Navier–Stokes (NS) equations. The vector form of 3D NS equations in the Cartesian coordinate system are expressed as
 $$\begin{eqnarray}\displaystyle & \displaystyle \frac{\partial \boldsymbol{U}}{\partial t}+\boldsymbol{{\rm\nabla}}\boldsymbol{\cdot }(\boldsymbol{U}\boldsymbol{U})-{\it\nu}{\rm\nabla}^{2}\boldsymbol{U}=-\frac{\boldsymbol{{\rm\nabla}}p}{{\it\rho}} & \displaystyle\end{eqnarray}$$
 $$\begin{eqnarray}\displaystyle & \boldsymbol{{\rm\nabla}}\boldsymbol{\cdot }\boldsymbol{U}=0 & \displaystyle\end{eqnarray}$$
 $\boldsymbol{U}$
has three components
 $U_{x},U_{y}$
and
 $U_{z}$
in the
 $x$
-,
 $y$
- and
 $z$
-directions, respectively,
 $t$
is the time,
 ${\it\rho}$
is the density of the fluid and
 $p$
is the pressure. The NS equations are solved by the Open-source Field Operation and Manipulation (OpenFOAM®) C
 $++$
libraries, which is an open-source computational fluid dynamics (CFD) package developed by OpenCFD Ltd. The finite volume method (FVM) is used in the solver and the pressure–velocity coupling is based on the pressure implicit with splitting of operators (PISO) method. The convection terms are discretized using the Gauss cubic scheme, while the Laplacian and pressure terms in the momentum equations are discretized using the Gauss linear scheme. The Euler implicit scheme is adopted for the temporal discretization.
The initial values for flow velocity and pressure in the whole domain are set to zero and boundary conditions for the governing equations are: (i) at the inlet, a uniform velocity
 $U_{\infty }$
with certain incident angle is given and the pressure gradient in the streamwise direction is specified as zero; (ii) at the outlet, the pressure is set to zero and the velocity gradients in the streamwise direction are zero; (iii) no-slip boundary condition is adopted on the cylinder surfaces and (iv) symmetry boundary conditions are applied at two lateral boundaries that are perpendicular to the cylinders.
2.2. Mesh dependency and model validation
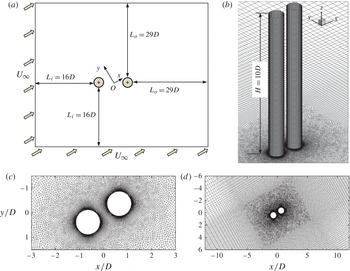
A cubic computational domain as shown in figure 5(a) is used in this study. In the present numerical simulation, the alignment angle is varied by changing the flow direction. Two inlet boundaries are set for simulating flow past two cylinders at oblique approaching angles. The two inlet boundaries are
 $16D$
away from Cyl_up and the two outlet boundaries are
 $29D$
away from Cyl_down. This leads to a blockage ratio ranging from 2.2 % at
 ${\it\alpha}=0^{\circ }$
to 4.4 % at
 ${\it\alpha}=90^{\circ }$
. The height of the domain (
 $H$
) in the spanwise direction of the cylinders is
 $10D$
. The size of the computational domain is selected based on a domain size dependency study and the experience from Barkley & Henderson (Reference Barkley and Henderson1996). The choice of
 $H$
was based on the considerations of both efficiency and accuracy and the length of
 $3{\rm\pi}$
was found to be sufficient for capturing the flow variation in the spanwise direction of the cylinders (Henderson & Karniadakis Reference Henderson and Karniadakis1995; Lei, Cheng & Kavanagh Reference Lei, Cheng and Kavanagh2001; Labbé & Wilson Reference Labbé and Wilson2007).
A schematic representation of the computational domain and mesh distributions of the two-circular cylinder system: (a) computational domain, and the inlet flow
 $U_{\infty }$
is from bottom left to top right; (b) 3D view of the mesh around two cylinders; (c) close view of the mesh surrounding the cylinders, which consist layers of structured quadrilateral cells, followed by unstructured cells; (d) local view of the mesh surrounding the cylinders, where the unstructural cells shown in (c) are followed by structured quadrilateral mesh again.

The computational mesh is generated using an open-source generator named Gmsh (Geuzaine & Remacle Reference Geuzaine and Remacle2009). Unstructured hexahedron finite volumes are used in the numerical simulations. Each computational mesh consists of structured cells near the cylinder surfaces (figure 5
c) and also in the far field (figure 5
b), and unstructured cells in a rectangular area as shown in figure 5(d). The size of the structured cells around the cylinder surfaces is chosen based on a mesh dependence study to ensure the numerical accuracy at
 $\mathit{Re}=10^{3}$
. The rectangular domain that bounds the unstructured cells is chosen based on the criteria that the distance between its outer boundaries to the nearest cylinder is
 $4D$
. Small unstructured cells are deliberately distributed in areas where velocity and pressure gradients are anticipated to be high. The 3D mesh is formed by extending the two-dimensional mesh as shown in figure 5(c,d) in equidistance in the
 $z$
-direction of 100 layers.
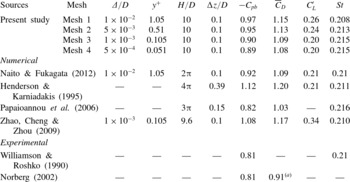
To investigate the effect of mesh density on the accuracy of the solution, a mesh dependence study is carried out for flow past a single cylinder with four different meshes at
 $\mathit{Re}=10^{3}$
in table 2. The four meshes differ from each other in the mesh density near the cylinder surface as well as in the wake region. The radial sizes of the cell on the cylinder surface
 $({\rm\Delta})$
for mesh 1, 2, 3 and 4 are
 $1\times 10^{-2}D$
,
 $5\times 10^{-3}D$
,
 $1\times 10^{-3}D$
and
 $5\times 10^{-4}D$
, respectively. The corresponding non-dimensional distances from the first nodal point to the cylinder surface,
 $y^{+}=u_{f}{\rm\Delta}/{\it\nu}$
are also included in table 2, where
 $u_{f}$
is the friction velocity. The computational domain size around a single cylinder is
 $32D\times 45D$
, and the mesh density and distribution are similar to those shown in figure 5.
To ensure the establishment of a fully developed flow field, each computation is run for at least
 $t^{\ast }=$
400, where
 $t^{\ast }$
is non-dimensional time defined as
 $t^{\ast }=U_{\infty }t/D$
. The numerical results of the force coefficient and Strouhal number for a single cylinder are listed in table 2 along with published experimental and 3D numerical results. Here,
 $C_{D}$
is the drag coefficient,
 $\bar{C}_{D}$
is the mean drag coefficient;
 $C_{L}$
is the lift coefficient,
 $C_{L}^{\prime }$
is root-mean-square (r.m.s.) lift coefficient; and St is Strouhal number, which are defined as
 $$\begin{eqnarray}C_{D}=\frac{F_{x}}{{\it\rho}U_{\infty }^{2}HD/2},\quad C_{L}=\frac{F_{y}}{{\it\rho}U_{\infty }^{2}HD/2},\quad \mathit{St}=\frac{f_{s}D}{U_{\infty }}\end{eqnarray}$$
where
 $F_{x}$
is the drag force in the direction of approaching flow and
 $F_{y}$
is the lift force perpendicular to the approaching flow,
 $f_{s}$
is the frequency of the fluctuating lift force, obtained by performing the fast Fourier transition (FFT) analysis of the lift coefficient.
 $C_{p}$
is pressure coefficient and is defined as
 $$\begin{eqnarray}C_{p}=\frac{p-p_{\infty }}{{\it\rho}U_{\infty }^{2}/2}\end{eqnarray}$$
where
 $p_{\infty }$
is the free-stream pressure. Here
 $C_{pb}$
is the pressure coefficient at the base point. The mesh dependence study shows that the numerical results are less sensitive to the mesh density if a mesh as fine as (or finer than) mesh 3 is chosen. The overall numerical results from all meshes appear to agree reasonably well with the published results.
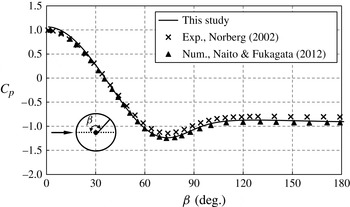
In addition to the comparison of the integrated flow quantities, distribution of pressure coefficient
 $(C_{p})$
around the cylinder based on mesh 3 are compared with available data from literature in figure 6. Good agreement of the present
 $C_{p}$
values with experimental results by Norberg (Reference Norberg, Hourigan, Leweke, Thompson and Williamson2002) and numerical results from Naito & Fukagata (Reference Naito and Fukagata2012) is observed. All three studies suggest the minimum pressure coefficient occurs at approximately 75° measuring from the stagnation point.
Comparison of the pressure coefficient on the surface of the cylinder from mesh 3 with data of Norberg (Reference Norberg, Hourigan, Leweke, Thompson and Williamson2002) and Naito & Fukagata (Reference Naito and Fukagata2012).

Mesh details and the influence of mesh size on simulation results for a single cylinder at
 $\mathit{Re}=10^{3.}$
((a) Mean pressure drag coefficient.)

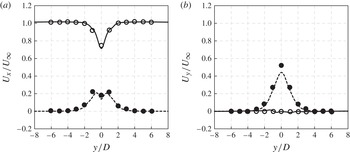
The mesh resolution in the cylinder wake region is examined by comparing the velocity profile along
 $x/D=5$
with the spectral element numerical result from Henderson & Karniadakis (Reference Henderson and Karniadakis1995) in figure 7. Both streamwise and normal velocity profiles are consistent with the published data, and active velocity fluctuations are observed within a
 $2D$
distance in each side of the cylinder. The increased mesh resolution in the wake in mesh 2, 3 and 4 leads to negligible differences in the mean velocity profile; therefore further increasing in grid number makes little change on the flow field, while only requires more the computational effort.
Variation of mean and fluctuation velocity profile for
 $U_{x}$
and
 $U_{y}$
at
 $x/D=5$
: — / ○, mean velocity; - - - - / ●, velocity fluctuation; lines, present study; symbols, Henderson & Karniadakis (Reference Henderson and Karniadakis1995).

The blockage effect of the cylinders on the numerical results is investigated by simulating flow past two side-by-side cylinders (
 ${\it\alpha}=90^{\circ }$
) at a pitch ratio of 1.5, where the blockage ratio (4.4 %) is the maximum among all of the cases investigated in this study. At such a small spacing, it is anticipated that the blockage effect is more pronounced because the two cylinders may behave as a single structure of a characteristic width of
 $3.5D$
. Simulations are conducted using two domain sizes with similar mesh densities to that used in mesh 3. The first domain size is the same as that used in table 2 and is named mesh 5. The second domain size doubles that of mesh 5 and is named mesh 6. The simulation results are compared in table 3, where the differences between the two cases are negligible, with the maximum difference of approximately 4 % in the mean lift. The flow patterns (not shown here) based on the two cases are also found to be similar. For a cross-comparison, the domain size used in the present study is larger than those used by Lam & Zou (Reference Lam and Zou2010) and Tong et al. (Reference Tong, Cheng, Zhao, Zhou and Chen2014) for the study on flow around four cylinders. In light of this evidence, the computational domain sizes are considered to be adequate for the purpose of this study.
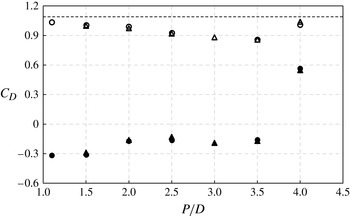
Comparison of mean drag coefficients on the cylinders; ○, Papaioannou et al. (Reference Papaioannou, Yue, Triantafyllou and Karniadakis2006); ▵, present study; open symbol, upstream cylinder; solid symbol, downstream cylinder; - - - -, isolated cylinder.

Influences of the blockage effect on the simulation of two side-by-side cylinders at
 $\mathit{Re}=10^{3}$
; subscript 1 and 2 represent the top and bottom cylinders respectively.

To further validate the present numerical model, the calculated drag coefficients for two tandem circular cylinders at
 $\mathit{Re}=10^{3}$
are compared with numerical results data by Papaioannou et al. (Reference Papaioannou, Yue, Triantafyllou and Karniadakis2006) in figure 8. The mean
 $C_{D}$
for an isolated cylinder is also given in figure 8 as a reference. The agreement between the two sets of numerical results is excellent. For all pitch ratios, the mean
 $C_{D}$
of each of the two cylinders typically remains smaller than that of an isolated cylinder. When the pitch ratio is small (
 ${<}3.5$
) vortex shedding occurs only in the wake of Cyl_down. The
 $C_{D}$
of Cyl_up decreases slowly with the pitch ratio to a value between 3.5 and 4.0, where the co-shedding regime starts (i.e. vortex shedding occurs from both cylinders), resulting in a sudden jump in
 $C_{D}$
of Cyl_up to the value close to that of a single cylinder. The mean drag on Cyl_down remains negative for
 $P/D\leqslant 3.5$
(within the extended-body and reattachment regimes). It experiences a more prominent jump to be positive after the occurrence of vortex shedding from Cyl_up. This suggests that the sudden increase of the drag coefficient on the downstream cylinder is a good indicator of the occurrence of vortex shedding from upstream cylinder.
The 2D numerical model is also validated by comparing the present results with the published data for flow around two tandem cylinders at
 $\mathit{Re}=10^{3}$
and
 $P/D=3$
in table 4. The Strouhal numbers for the two cylinders are found to be the same. It is seen that the present results agree well with those reported in the literature.
Comparison of the present 2D results with published data for flow around two tandem cylinders at
 $\mathit{Re}=10^{3}$
; subscripts 1 and 2 in the force coefficients represent the upstream and downstream cylinders, respectively.

These validation results suggest that a domain size with
 $16D$
at inlet and
 $29D$
at outlet is sufficient for modelling steady flow around two cylinders at
 $\mathit{Re}=10^{3}$
; and the numerical results are mesh independent if the mesh is equivalent to or denser than those in mesh 3. Thus, the computational domain for two staggered cylinders is meshed on the basis of mesh 3 in table 2, resulting in a total number of cells varying from 4.1 million at
 $P/D=1.5$
to 4.8 million at
 $P/D=4$
.
3. Pressure and force
3.1. Pressure distribution
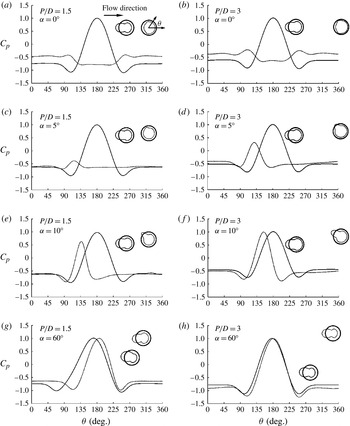
First, the effect of staggered arrangements on pressure distribution around two cylinders is presented. The variations of the pressure coefficient
 $C_{p}$
with the position angle
 ${\it\theta}$
for flows with two pitch ratios of
 $P/D=1.5$
and 3 and four selected alignment angles from 3D simulations are shown in both Cartesian and polar coordinates in figure 9, where the sectional averaged
 $C_{p}$
at the middle cross-section plane
 $(z=5D)$
are illustrated. The position angle
 ${\it\theta}$
along a cylinder surface is defined in figure 9(a). The pressure in the polar coordinate system is negative inside the cylinder surface and positive outside. It should be clarified that in the following discussion, the base point on a cylinder surface is defined as the extreme aft point (
 ${\it\theta}=0^{\circ }$
) in the flow direction, regardless of the influence from the other cylinder, and the pressure at the base point is defined as base pressure,
 $C_{pb}$
; while the stagnation point is referred to as the point with the maximum pressure coefficient, which is referred as stagnation pressure,
 $C_{ps}$
. The variations of stagnation point from its non-affected position
 ${\it\theta}=180^{\circ }$
, the averaged stagnation pressure and the base pressure with
 ${\it\alpha}$
for
 $P/D=3$
are shown in figure 10.
The pressure distribution around two staggered cylinders at various arrangements:
 ${\it\alpha}$
, the alignment angle;
 $C_{p}$
, the pressure coefficient; thin solid line, pressure on upstream cylinder; dashed line, pressure on downstream cylinder.

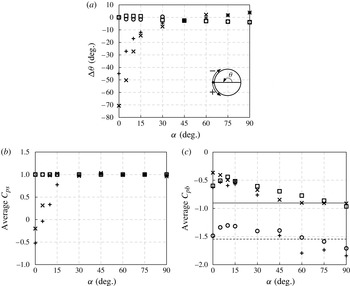
Comparison pressure results as a function of alignment angle for two staggered cylinders between 2D and 3D simulations at
 $P/D=3$
and
 $\mathit{Re}=10^{3}$
: (a) the movements of averaged stagnation points where
 ${\rm\Delta}{\it\theta}(={\it\theta}_{s}-180^{\circ })$
is defined as the difference between the angle of stagnation point (
 ${\it\theta}_{s}$
) and
 ${\it\theta}=180^{\circ }$
; (b) stagnation pressure; (c) base pressure; ▫, 3D upstream cylinder; ○, 2D upstream cylinder;
 $\times$
, 3D downstream cylinder;
 $+$
, 2D downstream cylinder; —, 3D single cylinder; - - - -, 2D single cylinder.

3.1.1. Upstream cylinder
For Cyl_up, the variation of the alignment angle has little influence on the stagnation pressure for all
 ${\it\alpha}$
values, as seen from figure 9 and from figure 10(a). For
 $P/D=3$
in figure 10(a), the location of the stagnation of Cyl_up moves less than 1.5° towards the bottom side for
 ${\it\alpha}\leqslant 15^{\circ }$
, and 2°–5° towards the top side for
 ${\it\alpha}\geqslant 30^{\circ }$
from the location of
 ${\it\theta}=180^{\circ }$
. This indicates Cyl_down has very limited influence on the flow around the front face of Cyl_up.
The base pressure changes greatly with the change of both pitch ratio and alignment angle for Cyl_up. For instance, in figure 9(a), the base pressure coefficient is increased from
 $-$
0.78 at
 $(P/D,{\it\alpha})=(1.5,0^{\circ })$
to
 $-$
0.63 at
 $(P/D,{\it\alpha})=(1.5,5^{\circ })$
and
 $-$
0.62 at
 $(P/D,{\it\alpha})=(3,0^{\circ })$
. For
 $P/D=3$
the base pressure coefficient of Cyl_up increases from
 $-$
0.62 to approximately
 $-$
0.44 as
 ${\it\alpha}$
increases from 0° to 10°, and decreases monotonically afterwards (from
 $-$
0.52 at
 ${\it\alpha}=15^{\circ }$
to
 $-$
0.91 at
 ${\it\alpha}=90^{\circ }$
). The increase of base pressure indicates the weakening of the interactions of the top and bottom shear layers from Cyl_up and the decrease of the base pressure suggests the enhancement of vortex shedding from Cyl_up due to the influence of Cyl_down. The weakening (
 ${\it\alpha}\leqslant 10^{\circ }$
) and enhancement of vortex shedding (
 ${\it\alpha}\geqslant 15^{\circ }$
) can also be observed from the r.m.s. lift coefficient and vortex shedding frequency (St) to be presented later on in figures 12 and 16. The weakening of vortex shedding corresponds to small r.m.s. lift and low vortex shedding frequency and the enhancement corresponds to large r.m.s. lift and high vortex shedding frequency. The base pressure of Cyl_up for
 ${\it\alpha}>60^{\circ }$
is close to the base pressure of a single cylinder, indicating the decay of influence from Cyl_down.
3.1.2. Downstream cylinder
In contrast, the pressure on Cyl_down is greatly affected by the alignment of the cylinders. It is almost always negative at
 ${\it\alpha}=0^{\circ }$
and
 ${\it\alpha}=5^{\circ }$
for both
 $P/D=1.5$
and 3, where Cyl_down is wholly immersed in a negative pressure zone (a slight positive pressure is found near the stagnation point at
 $P/D=3$
and
 ${\it\alpha}=5^{\circ }$
). At these two alignments, Cyl_down is expected to have a negative drag–thrust force (Zdravkovich Reference Zdravkovich1977), a mean force in the opposite direction of the approaching flow, as the negative pressure on the windward side (
 $110^{\circ }\leqslant {\it\theta}\leqslant 245^{\circ }$
) exceeds the pressure on the base side (approximately,
 $|{\it\theta}|\leqslant 60^{\circ }$
) of Cyl_down. The stagnation pressure of Cyl_down for
 $P/D=3$
increases rapidly from
 $-$
0.20 at
 ${\it\alpha}=0^{\circ }$
to approximately 1.0 at
 ${\it\alpha}=10^{\circ }$
and remains around 1.0 for
 ${\it\alpha}\geqslant 15^{\circ }$
(refer to figure 10
b). In the meantime, the stagnation point moves rapidly from
 ${\it\theta}=110^{\circ }$
at
 ${\it\alpha}=0^{\circ }$
to
 ${\it\theta}=167^{\circ }$
at
 ${\it\alpha}=15^{\circ }$
, and then gradually to
 ${\it\theta}=183^{\circ }$
at
 ${\it\alpha}=90^{\circ }$
(refer to figure 10
a). The base pressure of Cyl_down decreases with larger
 ${\it\alpha}$
from
 $-$
0.37 at
 ${\it\alpha}=0^{\circ }$
to
 $-$
0.85 at
 ${\it\alpha}=45^{\circ }$
, and then stays at approximately
 $-$
0.90 for increasing
 ${\it\alpha}$
. For
 ${\it\alpha}\geqslant 60^{\circ }$
, the base pressure on the two cylinders is almost identical to its single-cylinder counterpart. It is also observed that the stagnation points of both cylinders are located in the gap sides at
 ${\it\alpha}\geqslant 60^{\circ }$
(figure 10
a) and this will induce outward-directed forces on the two cylinders, which will be discussed in detail in § 3.2.
A significant discontinuous change is found in the pressure distribution on Cyl_down at a small alignment angle. It is symmetric approximately
 ${\it\theta}=180^{\circ }$
in the tandem configuration with two peaks appearing at approximately
 ${\it\theta}=110^{\circ }$
and 250°, respectively. This is because these two locations are attacked by the shear layers from the two sides of Cyl_up. When
 ${\it\alpha}=5^{\circ }$
, the pressure peak at
 $250^{\circ }$
disappears because this location is immersed in the wake zone of Cyl_up and the value of the other peak increases slightly. The stagnation point rapidly moves towards
 ${\it\theta}=180^{\circ }$
location with the increase of alignment angle. The movement of the stagnation point indicates the formation of a biased gap flow between the two cylinders. This gap flow along with the shear layer and vortex interactions are responsible for many results reported here.
3.1.3. Comparison of 2D and 3D results
Since available numerical simulations on two staggered cylinders were mainly carried out based on 2D numerical models (Mittal et al.
Reference Mittal, Kumar and Raghuvanshi1997; Jester & Kallinderis Reference Jester and Kallinderis2003; Akbari & Price Reference Akbari and Price2005; Lee & Yang Reference Lee and Yang2009), we include a brief discussion on the comparison of 2D and 3D numerical results. The 3D results of the variations of the stagnation point, stagnation pressure and base pressure with the alignment angle for two staggered cylinders at
 $P/D=3$
and a single cylinder are compared with the 2D results in figure 10. The 2D model appears to predict similar results of the variation of stagnation point and stagnation pressure on Cyl_up to those by the 3D model for
 ${\it\alpha}\geqslant 45^{\circ }$
and
 ${\it\alpha}=0^{\circ }$
. The 2D model also predicts the trends of the variation of the stagnation point and stagnation pressure of Cyl_down well, but underpredicts the variation angle of the stagnation point and yields a smaller stagnation pressure of Cyl_down for
 ${\it\alpha}<30^{\circ }$
, which is because the 2D model predicts the inception of vortex shedding from Cyl_up at a smaller
 $P/D$
than the 3D model. For example, vortex shedding from Cyl_up is captured by the 2D model for
 $P/D=3.0$
and
 ${\it\alpha}<30^{\circ }$
but not by the 3D model. The prediction of the early inception of vortex shedding from Cyl_up by the 2D model will be discussed in § 5.2.
Large discrepancies between the 2D and 3D results are observed in the base pressure of both cylinders (refer to figure 10
c). Coincidentally the 2D and 3D models provide similar base pressures of Cyl_down for
 ${\it\alpha}\leqslant 30^{\circ }$
. The 2D model fails to predict the base pressure of the both cylinders for
 ${\it\alpha}\geqslant 45^{\circ }$
, which is not surprising because the base pressure of both cylinders for
 ${\it\alpha}\geqslant 45^{\circ }$
is close to the base pressure of a single cylinder and the 2D models generally underpredict the base pressure of a single cylinder at the considered Reynolds number.
3.2. Force coefficient
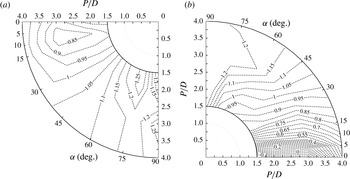
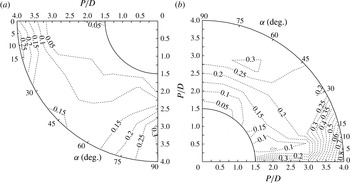
The influence of the pitch ratio and the alignment angle on the drag coefficient is presented by the contours of the mean drag coefficient in the
 $P/D{-}{\it\alpha}$
plane as shown in figure 11. Similar to that on the pressure distributions, the arrangement of the two cylinders has much less influence on the force of Cyl_up than that of Cyl_down. This is because the approaching flow for Cyl_down is affected by Cyl_up, depending on the location of Cyl_down, while the approaching flow for Cyl_up is less affected by Cyl_down. Both cylinders experience small drag forces at low alignment angles, and vice versa. The smallest mean drag coefficient on Cyl_up is found to be approximately 0.82, which is 25 % less than that of a single cylinder at
 $\mathit{Re}=10^{3}(\bar{C}_{D}=1.09)$
. One interesting feature of the drag forces on Cyl_up is that the smallest drag coefficient does not occur in the tandem configuration (
 ${\it\alpha}=0^{\circ }$
). It occurs at a combination of a pitch ratio of around 2.75 and an alignment angle of around 7.5°. It can be seen from the pressure distribution that the base pressure of Cyl_up approaches to the maximum value at approximately this combination of
 $P/D$
and
 ${\it\alpha}$
, suggesting a less energetic wake behind Cyl_up. This is because, at small
 ${\it\alpha}$
, the existence of Cyl_down disturbs the top shear layers around Cyl_up and weakens the interaction between the top and bottom shear layers around Cyl_up. In contrast, the drag coefficient on Cyl_up is generally enhanced at large
 ${\it\alpha}$
. The drag coefficient on Cyl_up is close to but slightly larger than that of an isolated cylinder when
 ${\it\alpha}$
exceeds 45° for all pitch ratios in the present study. This is because, at large
 ${\it\alpha}$
, the existence of Cyl_down pushes the top shear layer from Cyl_up closer to the bottom shear layer of Cyl_up, leading to a strong interaction between the shear layers and thus a more energetic wake behind Cyl_up.
Contours of mean drag coefficient on the two staggered cylinders: (a) upstream cylinder; (b) downstream cylinder.

It is also observed in figure 11 that the variation gradients of drag force at small
 ${\it\alpha}$
are higher than those at large
 ${\it\alpha}$
, indicating dramatic changes in flow condition at small
 ${\it\alpha}$
. The drag force on Cyl_down reaches its minimum (negative drag–thrust force) in the tandem configuration at the smallest pitch ratio investigated, where the shielding effect of Cyl_up is the strongest. When the two cylinders are in a tandem arrangement with small
 $P/D$
, Cyl_down is either completely or partially immersed in between the two shear layers from Cyl_up, resulting in small (or even negative) drag coefficients. The mean drag coefficients on Cyl_up are consistently larger than those on the downstream one at small flow approaching angles. It is expected that the magnitude of difference will decrease as
 $P/D$
increases and will eventually diminish at large pitch ratios. It is observed that both cylinders may experience a smaller drag than that of a single cylinder at certain arrangements and such a feature have been utilized in practical applications such as sports.
Figure 12 shows the contours of r.m.s. lift coefficient on both cylinders from 3D simulations. The r.m.s. lift coefficient on Cyl_up is suppressed at a large region on the
 $P/D{-}{\it\alpha}$
plane, and it is only at the two corners of the plane (
 ${\it\alpha}\leqslant 15^{\circ }$
and
 ${\it\alpha}\geqslant 75^{\circ }$
for large pitch ratios) that the r.m.s. lift on Cyl_up is close to that of an isolated cylinder (0.20). The maximum r.m.s. lift coefficient on Cyl_up occurs when the two cylinders are in the side-by-side arrangement (
 ${\it\alpha}=90^{\circ }$
) at
 $P/D=3$
. The r.m.s. lift on Cyl_down also peaks at both small and large alignment angles and large pitch ratios. It reaches the maximum when Cyl_down is directly placed behind Cyl_up at the largest pitch ratio 4 in the present study. The r.m.s. lift on Cyl_down quadruples the value of an isolated cylinder at
 $(P/D,{\it\alpha})=(4,0^{\circ })$
, where the vortices start to be shed from Cyl_up and fully impinge on the downstream one.
Contour of the r.m.s. lift coefficient on two staggered cylinders by 3D simulations: (a) upstream cylinder; (b) downstream cylinders.

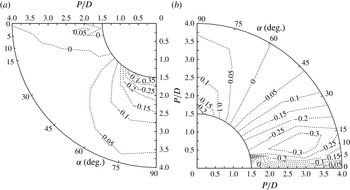
Figure 13 shows the contours of the mean lift coefficient on the
 $P/D{-}{\it\alpha}$
plane by 3D simulations. The lift coefficients on the two cylinders are not zero except when
 ${\it\alpha}=0$
. One prominent feature is the existence of attractive and repulsive lift forces on the two cylinders. The attractive lift force is an inward-directed force (negative on downstream cylinder and positive on the upstream one), indicating the cylinders tend to attract one and another; while the repulsive lift force is an out-directed force (signs are contrary to the attractive force), where the cylinders tend to repel each other (Sumner, Richards & Akosile Reference Sumner, Richards and Akosile2005). Different reasons for the attractive lift (inward-directed) forces have been discovered and reported (Zdravkovich Reference Zdravkovich1977; Ting et al.
Reference Ting, Wang, Price and Païdoussis1998). In our study, the attractive lift force on Cyl_down is found at
 $5^{\circ }\leqslant {\it\alpha}\leqslant 45^{\circ }$
for all pitch ratios. The attractive lift force on Cyl_up is only observed in a very small area with small flow approaching angles. It is seen from figure 13 that the attractive lift force on Cyl_down peaks at approximately 10°, and the maximum absolute value is 0.34 at
 $P/D=3$
, corresponding to a high St which will be discussed later on. The obvious attractive lift force on Cyl_down can be explained by referencing the pressure distributions around Cyl_down shown in figures 9 and 10, where it is observed that the stagnation point of Cyl_down moves downwards from
 ${\it\theta}=130^{\circ }$
at
 ${\it\alpha}=5^{\circ }$
to
 ${\it\theta}=172^{\circ }$
at
 ${\it\alpha}=30^{\circ }$
while the stagnation pressure increases from approximately 0.37 to approximately 1.0. The movement of stagnation point leads to a downward drag component. The location of the stagnation point of Cyl_down also suggests that the approaching flow for Cyl_down is directed towards the centreline of the system (i.e. the
 $x$
-axis as defined in figure 1). This biased flow also contributes to the generation of attractive force by causing a pressure difference in the inner and outer sides of Cyl_down. The pressure distributions are almost symmetric to the approaching flow direction on Cyl_up for
 $5^{\circ }\leqslant {\it\alpha}\leqslant 30^{\circ }$
. As a result, no obvious attractive force is observed on Cyl_up.
Contour of mean lift coefficient on two staggered cylinders by 3D simulations: (a) upstream cylinder; (b) downstream cylinders.

The repulsive lift forces (out-directed), on the other hand, are found on both cylinders at large alignment angles (
 ${\it\alpha}\geqslant 45^{\circ }$
) and are strong at small
 $P/D$
values (1.5 and 2). The maximum magnitude of the repulsive lift force on Cyl_up is much larger that on the Cyl_down (0.40 compared with 0.26). One of the reasons for the outward repulsive force can be explained, again, by examining the pressure distributions on both cylinders. For instance, in figure 9 at
 $(P/D,{\it\alpha})=(1.5,60^{\circ })$
, the stagnation points of the two cylinders are both located on the inner side of the system, creating an outward force on both cylinders. The positive pressure on Cyl_up is much more widely distributed while the base pressure is smaller than those on the downstream one, which are responsible for the difference in magnitude of the repulsive forces. The mean repulsive lift forces observed in this study were reported independently at large subcritical Reynolds number of
 $3.2\times 10^{4}{-}7.4\times 10^{4}$
(Sumner et al.
Reference Sumner, Richards and Akosile2005).
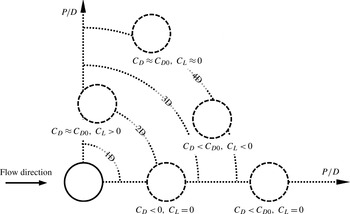
The hydrodynamic forces on two staggered cylinders by 3D simulations are summarized graphically in figure 14. Emphasis has been put on Cyl_down, as it is affected by the arrangement more than Cyl_up. The solid and the dashed circles stand for the position of the upstream and downstream cylinders, respectively. Negative drag is found for cases with small alignment angles at medium pitch ratios (
 ${\it\alpha}\leqslant 5^{\circ }$
and
 $P/D\leqslant 3$
); for medium angles
 $(5^{\circ }\leqslant {\it\alpha}\leqslant 30^{\circ })$
, the drag forces on Cyl_down is less than that of an isolated cylinder under the same flow condition, but the averaged lift coefficient is characterized by the attractive force; at larger angles (
 ${\it\alpha}\geqslant 30^{\circ }$
), the drag forces for two cylinders are less than 15 % different from that of a single cylinder, while repulsive force is found in the lift at small pitch ratios (
 $P/D<3$
) and fades out with the increase of pitch ratio.
A summary of force characteristics on the downstream cylinder in the two staggered cylinder system.

4. Strouhal number
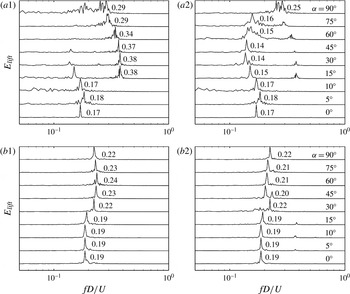
The time history of lift coefficients is analysed by FFT and the peak frequency of the FFT spectrum is used to determine the St. The FFT spectra of the lift coefficient for
 $P/D=2$
and 4 by 3D simulations are shown in figure 15, where on the left and right are those for the upstream and downstream cylinders, respectively. For
 $P/D=2$
, the FFT spectrum is featured by one pronounced peak at
 ${\it\alpha}=0^{\circ }$
and one broadband peak accompanied by many lower peaks at large
 ${\it\alpha}$
. The broadband spectrum indicates the occurrence of very complex flow structures, such as shear layer and vortex interactions, which will be presented in § 5 on wake flow regimes. When the pitch ratio is increased to 4, the smaller peaks disappear at large
 ${\it\alpha}$
, suggesting the weakening of interactions between the two cylinders. Another interesting feature is the difference in peak frequencies of the lift force on both cylinders at intermediate
 ${\it\alpha}$
. This indicates the vortex shedding frequency from the two cylinders is different under wake and proximity interferences.
FFT Power spectral density of
 $C_{L}$
: (a)
 $P/D=2$
; (b)
 $P/D=4$
; 1 and 2 represents upstream and downstream cylinder, respectively.

It is also observed that each FFT spectrum of the lift coefficient has a secondary peak for a medium alignment angle between
 $15^{\circ }\leqslant {\it\alpha}\leqslant 75^{\circ }$
at
 $P/D=2$
(figure 15
a1 and a2). The secondary peak of one cylinder is exactly the primary peak of the other, and thus it is reasonable to conclude that the secondary peak is caused the shear layer or vortex shedding from the other cylinder.
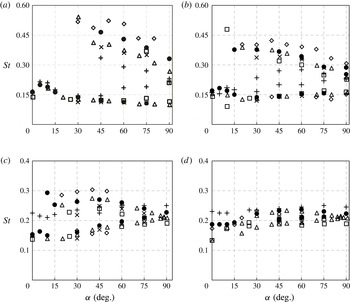
Figure 16 shows the variations of the two sets of St with
 ${\it\alpha}$
for different
 $P$
by both 2D and 3D simulations. Of the two sets of St for each flow approaching angle, the smaller one is for Cyl_down and the larger one is for Cyl_up. The experimental data of St reported by Kiya et al. (Reference Kiya, Arie, Tamura and Mori1980) at
 $\mathit{Re}=15\,800$
, Sumner et al. (Reference Sumner, Price and Paidoussis2000) at
 $\mathit{Re}=1350$
, Alam & Sakamoto (Reference Alam and Sakamoto2005) at
 $\mathit{Re}=55\,000$
and Hu & Zhou (Reference Hu and Zhou2008a
) at
 $\mathit{Re}=7000$
are also included in figure 16 for comparison. The St obtained from the reported experiments were determined either by analysing the frequency of oscillating velocity at certain locations downstream the cylinders (Hu & Zhou Reference Hu and Zhou2008a
) or by counting and timing individual vortices that are shed from the cylinders (Sumner et al.
Reference Sumner, Price and Paidoussis2000). In general, the present 3D numerical results agree reasonably well with the experimental data, despite the differences in flow conditions and statistical method. Although the experiments of Sumner et al. (Reference Sumner, Price and Paidoussis2000) were carried out at a Re closest to that considered in the present study, St of Sumner et al. (Reference Sumner, Price and Paidoussis2000) are greater than the present results and others experimental data at relatively low
 $P/D$
and/or low
 ${\it\alpha}$
, where the flow interactions are vigorous and thus it is hard to count the number of vortices, due to the modulations of the original vortex frequencies and the interactions among the shear layers and vortices. On the other hand, St determined through measuring the velocity at a fixed location may be dependent on the location of the measurement (Sumner Reference Sumner2010). Hu & Zhou (Reference Hu and Zhou2008a
) measured St at six locations ranging from
 $x/D=2.5$
to 20. It was found that for the case of
 $P/D=2$
, the St measured at
 $x/D=2.5$
was more than twice the St measured at
 $x/D=10$
, which was attributed to vortex interactions and evolution. The St determined from the lift forces is a direct manifestation of vortex shedding from the cylinders, which will inevitably different from the St determined from quantities measured in the wake flow due to the complex vortex interactions in the wake such as vortex pairing and merging.
Comparison of Strouhal numbers for two staggered cylinders: (a)
 $P/D=1.5$
; (b)
 $P/D=2$
; (c)
 $P/D=3$
; (d)
 $P/D=4$
. Data of experimental studies are included:
 $\times$
, Kiya et al. (Reference Kiya, Arie, Tamura and Mori1980) at
 $\mathit{Re}=15\,800$
; ♢, Sumner et al. (Reference Sumner, Price and Paidoussis2000) at
 $\mathit{Re}=1350$
; ▫, Alam & Sakamoto (Reference Alam and Sakamoto2005) at
 $\mathit{Re}=55\,000$
; ▵, Hu & Zhou (Reference Hu and Zhou2008a
); ●, present 3D numerical study;
 $+$
, present 2D numerical study.

The results shown in figure 16 suggest that St of two staggered cylinders is highly dependent on cylinder configuration. At small
 ${\it\alpha}$
, the lift coefficients of both cylinders oscillate with the same frequency for all four spacing ratios (see figure 16
a for
 ${\it\alpha}\leqslant 30^{\circ }$
and figure 16
b for
 ${\it\alpha}\leqslant 10^{\circ }$
), implying the occurrence of one vortex street. In those cases, the two cylinders behave like one single body. Owing to the larger size of the combined cylinders, St is much smaller than that of a single cylinder under the same flow condition.
Two different sets of St were detected at intermediate
 $P/D$
and intermediate
 ${\it\alpha}$
, with one lower than that of an isolated cylinder (
 ${\approx}0.215$
) and the other higher. The critical
 ${\it\alpha}$
above which double St values occur decreases with the increasing
 $P/D$
. The difference between the two sets of St tends to diminish with increasing
 $P/D$
or
 ${\it\alpha}$
, which is obviously due to the weakened wake and proximity interferences. A straightforward explanation of the existence of two sets of St is that the different vortex shedding frequencies from both cylinders contributes to the two distinct values (Zdravkovich Reference Zdravkovich1985; Sumner et al.
Reference Sumner, Price and Paidoussis2000; Hu & Zhou Reference Hu and Zhou2008a
). Hu & Zhou (Reference Hu and Zhou2008a
) explained that the Cyl_down imposes a corner effect (as the effect of sharp corners to a square cylinder) to Cyl_up, resulting in a relative high base pressure behind Cyl_up and consequently, a higher vortex shedding frequency than that of an isolated cylinder. While at the same time, Cyl_down is submerged in the wake of Cyl_up with relatively low velocity, which contributes to the lower St associated with Cyl_down.
It is worth mentioning the seemingly abnormal very high St of Cyl_down predicted at
 $(P/D,{\it\alpha})=(3,10^{\circ })$
shown in figure 16(c). A similar feature was also found in the experimental study by Sumner et al. (Reference Sumner, Richards and Akosile2005) at
 $\mathit{Re}\sim 10^{4}$
for
 $P/D=2.5$
and
 ${\it\alpha}\approx 7^{\circ }{-}11^{\circ }$
(of approximately 0.4). This high St is found to correspond to the maximum attractive lift force.
The St calculated from 2D simulations is also presented in figure 16 for comparison. The 2D model also gives two distinct sets of St at
 $P/D=1.5,2$
and 3, but not at
 $P/D=4$
. However, the values are generally within the envelope formed by the 3D results, indicating that the 2D model underpredicts the St on Cyl_up, while overpredicts it on Cyl_down. The comparison also suggests St calculated by the 2D model at a specific pitch ratio resembles St at a larger pitch ratio predicted by the 3D model. For instance, St calculated by 2D model at
 $P/D=1.5$
is similar to the St by 3D model at
 $P/D=2$
. Since two sets of St are caused by shear layer and vortex interactions in the shared wake, this observation tends to suggest that the 2D model underpredicts the flow interference which will be illustrated through flow fieldsin § 5.
5. Wake flow regime
5.1. Classification of cross-sectional flow fields
The flow regimes of steady flow around two staggered cylinders are examined based on the 3D simulation results. The flow regimes of steady flow around two staggered cylinders have been classified through experimental studies by Sumner et al. (Reference Sumner, Price and Paidoussis2000, Reference Sumner, Richards and Akosile2005) and Hu & Zhou (Reference Hu and Zhou2008a
,Reference Hu and Zhou
b
). In these studies, flow regimes are classified by analysing the vortex shedding frequency, force coefficients and the cross-sectional flow field. Four distinct flow structures, including two single-street modes (S-I and S-II) and two twin-street modes (T-I and T-II) have been identified by Hu & Zhou (Reference Hu and Zhou2008a
,Reference Hu and Zhou
b
) based on two sets of St in the wake, flow topography and their downstream evolution. In the present study, although the similar method as that by Hu & Zhou (Reference Hu and Zhou2008a
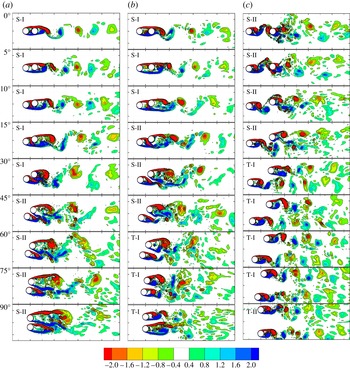
) is used to classify the vortex shedding flow, it is anticipated that more underlying physics responsible for the flow regimes can be revealed due to the availability of more detailed flow information in the numerical simulation. It is arguably easier to classify flows in numerical studies compared to experimental studies because the vortex shedding flow field can be easily revealed by visualizing detailed flow fields in any cross-section of the cylinders. The contours of non-dimensional vorticity
 ${\it\omega}_{z}$
in the middle cross-section of the cylinders are shown in figure 17 for
 $P/D=1.5,2$
and 4 at all alignment angles (
 $P/D=3$
is given in figure 19 to compare with 2D simulations), where the vorticity is defined as the curl of the velocity field,
 $$\begin{eqnarray}{\it\omega}_{x}=\left(\frac{\partial w}{\partial y}-\frac{\partial v}{\partial z}\right)\frac{D}{U_{\infty }},\quad {\it\omega}_{y}=\left(\frac{\partial u}{\partial z}-\frac{\partial w}{\partial x}\right)\frac{D}{U_{\infty }},\quad {\it\omega}_{z}=\left(\frac{\partial v}{\partial x}-\frac{\partial u}{\partial y}\right)\frac{D}{U_{\infty }}.\end{eqnarray}$$
Instantaneous vorticity contours in the mid-section of the cylinders illustrating the different flow regimes observed in the flow around two staggered circular cylinders: (a)
 $P/D=1.5$
; (b)
 $P/D=2$
; (c)
 $P/D=4$
. The dotted contours denote positive vorticity, whereas continuous ones are for negative vorticity, with cutoff
 $\text{level}=\pm 0.4$
. The background dashed square is 2D in size.

When both
 $P/D$
and
 ${\it\alpha}$
are small, no vortices are observed in the wake of Cyl_up. The separated shear layers from Cyl_up re-attach to the surface of Cyl_down (shear layer reattachment). Therefore, vortices are shed only from Cyl_down (single wake) and the St for the two cylinders are the same (one St). This is essentially vortex shedding mode S-I, as named by Hu & Zhou (Reference Hu and Zhou2008a
). The wake flow for case of
 $P/D=1.5~({\it\alpha}\leqslant 30^{\circ })$
falls in the S-I regime. As
 $P/D$
increases, the highest alignment angle
 ${\it\alpha}$
, below which mode S-I exists, decreases. It is reduced to 5° for
 $P/D=3$
and when
 $P/D$
increases to 4, no S-I mode is observed and vortex shedding occurs from both cylinders at all alignment angles investigated in this study.
Vortex shedding from both cylinders can be detected with either slightly increased
 $P/D$
or
 ${\it\alpha}$
from regime S-I, but the vortices from the two cylinders fully merge together to a single asymmetric wake. Thus, there are usually two distinct St for the two cylinders, as revealed by the lift forces, but only one St in the wake. This flow feature is named regime S-II. For
 $P/D=1.5$
and 2, the vortices that are shed from the bottom cylinder are weak and dissipated quickly due to the strong influence from the bottom shear layer of the top cylinder. The shear layer from the bottom side of the top cylinder is strong due to the jet flow through the gap between the cylinders. The vortex shedding mechanism in regime S-II for
 $P/D=3$
and 4 at large alignment angles is generally different from that for
 $P/D=1.5$
and 2. For
 $P/D=3$
and 4, the vortices that are shed from Cyl_up attack Cyl_down and merge with the vortices shed from Cyl_down, forming a single wake behind the cylinder pairs.
The wake is characterized by two Kármán vortex streets that interact with each other strongly as
 $P$
or
 ${\it\alpha}$
are further increased. The St values for these two Kármán vortex streets are different and maintain so in the wake, leading to flow regime T-I. The interactions between the shear layers in regime T-I are not as significant as those observed in regime S-I and S-II. This is because Cyl_down is further away from the wake zone of Cyl_up; however, strong interactions among the vortices from the two streets are still observed in the wake, including vortex pairing.
It is observed from the flow fields that S-II and T-I are featured with biased vortex shedding, where vortex cores shed from Cyl_down are considerably larger than those from Cyl_up and the gap flow is directed downwards to the wake of Cyl_up. The relative smaller vortex cores from Cyl_up are due to the confined space (built up by Cyl_down itself and its shear layer) in its wake which restricts the growth of vortex cores and also because of the generation of energetic wake flow as observed from force coefficients. As a result, small vortex from Cyl_up takes a shorter period of time to develop and shed than large vortex from Cyl_down. This explains the existence of two sets of St. Depending on how close the two cylinders are, the shed vortex (with different frequency) from the two cylinders may or may not merge together, leading to regime S-II or T-I, respectively. The biased flow is not capable of changing its inclined direction in the staggered arrangement in regime S-II and T-I; however, at the side-by-side configuration, gap flow intermittently flips over. Whichever cylinder the flow inclines to, its wake is half enclosed and thus the vortex shedding is restrained; as a result the cylinder experiences higher St than the other. It is still unclear when and how the gap flow in the side-by-side arrangement alters its biased direction and this remains to be an interesting topic to study. It is worth mentioning that the existence of a stable deflection regime has been found by Williamson (Reference Williamson1985) even in a perfect symmetric system. In such cases, the two side-by-side cylinders behave differently and lead to different statistic data, such as St.
Furthermore, at the side-by-side or nearly side-by-side arrangements and at large pitch ratios (
 $P/D\geqslant 3$
), the flow field is characterized by two vortex streets with weak or no interactions, and is named regime T-II. In this flow regime, the vortex shedding from one cylinder is similar to that from the other, and St of each cylinder is close to that of an isolated cylinder. The flow interference in T-II is the weakest in all of the regimes identified above due to the weak wake interference or the proximity interference at large
 $P/D$
and
 ${\it\alpha}$
. Regime T-II is among the first studied wake pattern around two cylinders (Williamson Reference Williamson1985). Because the two vortex shedding processes from both cylinders are found to be either in-phase or in anti-phase with each other, regime T-II was named synchronized vortex shedding or anti- and in-phase vortex shedding in previous studies (Bearman & Wadcock Reference Bearman and Wadcock1973; Williamson Reference Williamson1985).
It should be noted that above flow classifications are not possible without quantitative measurement of velocity singles in the wake, especially at around boarder lines where the flow regimes cannot simply be classified based on the flow structures and the FFT lift spectrum only. For instance, no obvious differences can be detected between the flows with
 $(P/D,{\it\alpha})=(2,45^{\circ })$
and (2, 60°) based on qualitative observations on the flow field and the spectrum of lift coefficient. Their classifications of flow regimes of S-II and T-I respectively are achieved by FFT analysis of flow velocity samples in the wake of the cylinders. In this case, we sampled horizontal velocity component
 $U_{x}$
at 11 spatial points along a line of
 $x=10D~(-4.5D\leqslant y\leqslant +4.5D)$
downstream of the cylinder system (see figure 1) in the middle plane perpendicular to the cylinder and conducted the FFT analysis of the velocity signals. The results of the FFT analysis are listed in table 5. It is seen that St remains a constant across the wake for the case of
 $(P/D,{\it\alpha})=(2,45^{\circ })$
, suggesting a single wake and thus being classified as S-II, while two distinct St values are detected in the wake of the cylinders for
 $(P/D,{\it\alpha})=(2,60^{\circ })$
, indicating the interactions between two wakes, and thus being classified as T-I.
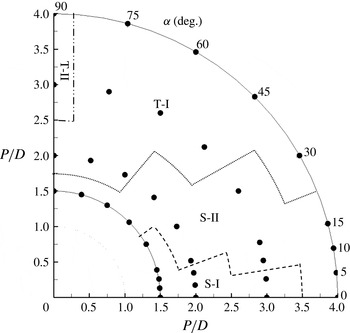
The flow regimes identified in this study are mapped out on the
 $P/D{-}{\it\alpha}$
plane as shown in figure 18, which is similar to figure 14 in Hu & Zhou (Reference Hu and Zhou2008a
), despite the differences in Reynolds number in the two studies. The case of
 $(P/D,{\it\alpha})=(1.5,15^{\circ })$
and
 $(1.5,30^{\circ })$
was classified as S-I because St for both cylinders are the same, while the case of
 $(P/D,{\it\alpha})=(4,0^{\circ })$
was classified as S-II because vortices are found to be shed from both cylinders in the present study. In general S-I occurs at small alignment angles. The boundary value of
 ${\it\alpha}$
between S-I and S-II regimes decreases as
 $P/D$
increases. Similarly, the boundary value of
 ${\it\alpha}$
between S-II and T-I regimes also decreases with the increasing
 $P/D$
. The T-II regime only occurs at large
 $P/D$
and large
 ${\it\alpha}$
.
Map of flow classifications around two staggered circular cylinders in steady cross-flow at
 $\mathit{Re}=10^{3}$
: S-I, single vortex street with vortex only shed from downstream cylinders; S-II, single street with vortex shed from both cylinders; T-I, twin streets with strong interactions; T-II, twin streets with weak interactions; ●, the cases investigated in the present study.

Variation of St at
 $10D$
downstream the staggered cylinder system for
 $P/D=2$
.

5.2. 3D effects on the flow fields
In all of the reviewed studies on two staggered cylinders, the flow field classifications were based on sectional flow visualization, pressure distributions and/or velocity signals. Surprisingly, the 3D effects on the flow field have not been investigated.
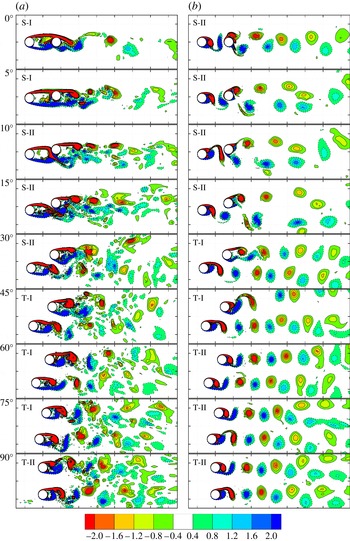
The flow fields predicted by 2D and 3D models at
 $P/D=3$
are qualitatively compared in figure 19, since this pitch ratio covers all flow regimes as discussed in figure 18. Generally speaking, the vortices in the 2D model are more energetic and regular than those in 3D model, and remain so further downstream of the wake. This is mainly due to the absence of disruptions to the two-dimensional flow structures from three-dimensionality, such as the energy transferring to the streamwise vortices and vortex dislocations. On the other hand, the shared wake predicted by the 3D model comprises many small-scale vortex structures. The flow fields calculated by the 2D model for all other cases show similar features and thus will not be shown here. In figure 19, the 2D model fails to predict the shear layer reattachment regime at
 ${\it\alpha}=0$
and 5° (S-I) revealed by the 3D model, which is consistent with the drag force feature between the two models. Strong vortices shed from Cyl_up are predicted by the 2D model for these two cases. Since the vortex interactions predicted by the 2D model are also less obvious for
 ${\it\alpha}=60$
and 75° and the Strouhal numbers for the two cylinders are equivalent, the flow is classified as regime T-II in contrast to the flow regime T-I predicted by the 3D model. It appears to be clear that it is inappropriate to classify flow around two staggered cylinders based on 2D simulation results.
Comparison of the instantaneous vorticity contours in the cross-section of the cylinders between 3D and 2D numerical simulations: (a)
 $P/D=3$
(3D); (b)
 $P/D=3$
(2D). The dotted contours denote positive vorticity, whereas continuous ones are for negative vorticity, with cutoff
 $\text{level}=\pm 0.4$
. The background dashed square is 2D in size.

To quantify the extra energy dissipation of the 3D flow fields observed in figure 19, the enstrophy of flow around the two-cylinder system is computed. The enstrophy, which represents a measure of kinetic energy that corresponds to the dissipation effect in the flow field, is determined as the integral of the squared vorticity
 ${\it\omega}_{i}$
(
 ${\it\omega}_{x},{\it\omega}_{y},{\it\omega}_{z}$
) given a velocity field
 $\boldsymbol{U}$
throughout the whole computational domain
 ${\it\Omega}$
(Papaioannou et al.
Reference Papaioannou, Yue, Triantafyllou and Karniadakis2006),
 $$\begin{eqnarray}{\it\varepsilon}(t)=\int _{{\it\Omega}}{\it\omega}_{i}^{2}(x_{i},t)\,\text{d}V=\int _{{\it\Omega}}|\boldsymbol{{\rm\nabla}}\times \boldsymbol{U}|^{2}\,\text{d}V.\end{eqnarray}$$
Therefore, the enstrophy is time-dependent scalar and is calculated by squaring and integrating the magnitude of the vorticity. In the 3D simulations, the vorticity is a three component vector, but has only one non-zero component in the
 $x{-}y$
plane (
 ${\it\omega}_{z}$
) in 2D simulations. Thus, the primary and secondary enstrophy are introduced to distinguish the enstrophy based on different components of the vorticity field. The primary component of the enstrophy is calculated through spanwise (
 $z$
) vorticity,
 $$\begin{eqnarray}{\it\varepsilon}_{z}(t)=\int _{{\it\Omega}}{\it\omega}_{z}^{2}(x_{z},t)\,\text{d}V.\end{eqnarray}$$
Similarly, the secondary enstrophy is calculated by summing the streamwise (
 $x$
) and lateral (
 $y$
) components of the vorticity, i.e.
 $$\begin{eqnarray}{\it\varepsilon}_{xy}(t)=\int _{{\it\Omega}}\left[{\it\omega}_{x}^{2}(x_{x},t)+{\it\omega}_{y}^{2}(x_{y},t)\right]\,\text{d}V.\end{eqnarray}$$
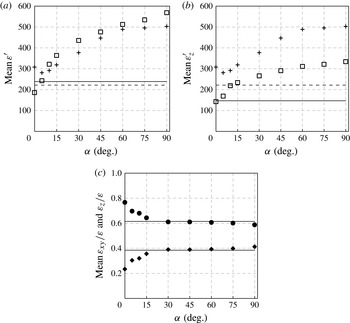
Since the secondary enstrophy only exists in 3D simulations, it is an alternative way to quantify the three-dimensionality of the flow. These definitions make the enstrophy shown in (5.2) as the total enstrophy. It is readily seen that the total enstrophy in 2D simulations is equivalent to the primary enstrophy. The results of calculated enstrophy for
 $P/D=3$
are presented in figure 20, along with the corresponding data for the single cylinder case in the same flow condition. The enstrophy shown in figure 20 is normalized by the inlet velocity and height of the computational domain, formulated as
 $$\begin{eqnarray}{\it\varepsilon}^{\prime }={\it\varepsilon}/(U_{\infty }^{2}H).\end{eqnarray}$$
Variation of total enstrophy (a), primary enstrophy (b) and enstrophy proportion (c) as a function of alignment angle for
 $P/D=3$
: ▫, 3D;
 $+$
, 2D; —, 3D single cylinder; - - - -, 2D single cylinder; ●,
 ${\it\varepsilon}_{z}/{\it\varepsilon}$
; ♦,
 ${\it\varepsilon}_{zy}/{\it\varepsilon}$
.

It is observed that the total enstrophy is very low at small alignment angles. This is the reason why the wake seems to be more robust at the tandem arrangement. The total enstrophy shows a trend of increase with increasing
 ${\it\alpha}$
, indicating the increase of fluid rotation and energy dissipation; and it reaches approximately two times of the enstrophy of the single cylinder case at regime T-I and T-II, due to the vortex shedding from both bodies. It is not surprising to see that the deviations between 2D and 3D models are small, which are within 15 % difference at
 ${\it\alpha}>10^{\circ }$
; however, it is interesting to see the 2D model overpredicts the total enstrophy when
 ${\it\alpha}\leqslant 5^{\circ }$
(regimes S-I). The overprediction of enstrophy by the 2D model at low alignment angles is caused by the early inception of vortex shedding in the gap, which was also discussed by Papaioannou et al. (Reference Papaioannou, Yue, Triantafyllou and Karniadakis2006) for two tandem cylinders.
Figure 20(b) shows that the primary enstrophy of the two-cylinder system at tandem configuration is restrained to the value of a single cylinder; and again, it grows as the Cyl_down moves away from the wake and roughly doubles the enstrophy of the single cylinder case after
 ${\it\alpha}\geqslant 45^{\circ }$
. The primary enstrophy of the 3D simulations is significantly lower than that of the 2D simulations, and the discrepancy further increases at large alignment angles. These large deviations of the primary enstrophy are obviously attributed to the kinetic energy in the
 $z$
-direction. This quantitative analysis is consistent with the qualitative observations of the differences in flow structures predicted by the 2D and 3D models shown in figure 19, where much disturbed flow fields are seen in 3D simulations.
For flow around a single cylinder at
 $10^{3}$
, the primary component of the enstrophy only takes up approximately 60 % the energy dissipation, so the three-dimensionality contributes to almost 40 % of the total enstrophy. Figure 20(c) illustrates the composition of enstrophy of flow around the two-cylinder system. It is observed that three-dimensionality of the flow is significantly suppressed at low
 ${\it\alpha}~({\leqslant}30^{\circ })$
in regimes S-I and S-II, indicating a more robust 2D wake could be achieved by simply extending the length of a structure in the direction of the flow. At the tandem arrangement, more than three quarters of the enstrophy is primary enstrophy. Although the proportion of secondary enstrophy in the 3D simulations grows significantly at larger alignment angles in the two single-wake regimes, S-I and S-II, it stays flat in regime T-I, nearly equivalent to the value of the single cylinder case, followed by a slight raise at
 ${\it\alpha}=90^{\circ }$
(regime T-II). Therefore, the flow interaction around multiple structures does not necessarily increase the three-dimensionality.
We further investigate the flow field by comparing the stretching of the vorticity with the diffusion of the vorticity, as expressed in vorticity transport equations,
 $$\begin{eqnarray}\frac{\text{D}{\it\omega}}{\text{D}t}=({\it\omega}\boldsymbol{\cdot }\boldsymbol{{\rm\nabla}})\boldsymbol{U}+{\it\nu}{\rm\nabla}^{2}{\it\omega}.\end{eqnarray}$$
The first term on the right-hand side of (5.6) represents vortex stretching, which is absent in 2D flows, while the second term denotes vortex diffusion, which only occurs in viscous flows, since the coefficient of vortex diffusion is the kinematic viscosity. This study calculates the competition between the terms of vortex stretching and vortex diffusion by comparing their integration over a selected computational domain covering the cylinders and the wake region. To facilitate the comparison, the resulting competition coefficient is normalized by the height of computational domain and the diameter of the cylinders, formulated as
 $$\begin{eqnarray}C_{{\it\omega}}^{\prime }=\frac{\displaystyle \int _{{\it\Omega}}|({\it\omega}\boldsymbol{\cdot }\boldsymbol{{\rm\nabla}})\boldsymbol{U}|\,\text{d}V}{\displaystyle \int _{{\it\Omega}}|{\it\nu}{\rm\nabla}^{2}{\it\omega}|\,\text{d}V}\bigg/HD^{2}.\end{eqnarray}$$
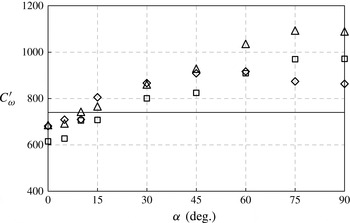
Figure 21 illustrates the variations of time-averaged
 $C_{{\it\omega}}^{\prime }$
with alignment angle at three pitch distances, along with that of the isolated cylinder at
 $\mathit{Re}=10^{3}$
. It is observed that
 $C_{{\it\omega}}^{\prime }$
generally increases with
 ${\it\alpha}$
and is impervious to the pitch distance until a critical alignment angle is reached. It is observed that the magnitude of
 $C_{{\it\omega}}^{\prime }$
does not exhibit a clear trend with the gap distance for
 ${\it\alpha}\leqslant 45^{\circ }$
. This suggests that
 ${\it\alpha}$
is a dominant factor for vortex stretching at
 ${\it\alpha}\leqslant 45^{\circ }$
and is consistent with the observation in regimes S-I and S-II, where vortex shedding from the upstream cylinder is significantly constrained at low
 ${\it\alpha}$
, regardless of pitch distances. It is seen that
 $C_{{\it\omega}}^{\prime }$
does not increase with
 ${\it\alpha}$
significantly for
 ${\it\alpha}\geqslant 75^{\circ }$
, suggesting that the pitch ratio becomes a dominant factor for vortex stretching.
Variation of the competition between terms of vortex stretching and vortex diffusion in the vorticity transport equations: ♢,
 $P/D=2$
; ▫,
 $P/D=3$
; ▵
 $P/D=4$
; —, single cylinder.

Bloor (Reference Bloor1964) found that the wake behind a single cylinder becomes turbulent at
 $\mathit{Re}\geqslant 400$
and the shear layer behind a single cylinder becomes turbulent at approximately
 $x/D=2.0$
along
 $y/D\approx 0.6$
for
 $\mathit{Re}=1.35\times 10^{3}$
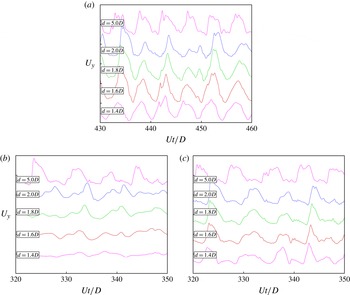
. The transition to turbulence in the shear layers are observed by sampling velocity signals at a number of discrete points in the downstream wake of both a single cylinder and two tandem cylinders at
 $P/D=3$
in this study, as shown in figure 22. For the single-cylinder case, small-scale oscillations are observed for
 $x/D\geqslant 1.6$
along
 $y/D=0.5$
, although high-frequency velocity is more obvious at
 $x/D\geqslant 2.0$
. These small-scale, high-frequency velocity oscillations are thought to be a typical signature of turbulence. With the existence of an additional cylinder, it is seen from figure 22 that the velocity signals sampled behind the tandem cylinders appear to be smoother than those sampled at the corresponding locations downstream of the single cylinder. This tends to suggest that the transition to turbulence for the tandem cylinders at
 $P/D=3$
occurs further downstream, compared with the single cylinder case. It is speculated that the delay in the transition to turbulence behind the tandem cylinders is due to the weak three-dimensionality of the flow in the cylinder wakes. It is recognized however that the results shown in figure 22 are less conclusive and are justified for a separate investigation.
Sampled velocity signal
 $U_{y}$
at several points at
 $y=0.5D$
along the wake of a single (a) and two-tandem cylinders, (b) upstream cylinder and (c) downstream cylinder;
 $d$
is the normal distance (in the
 $x$
-direction) from the centre of the cylinder to the sampling point.

5.3. Variation of the flow in the spanwise direction
The variation of the flow fields in the spanwise direction of the cylinder is further investigated by showing the second negative eigenvalue
 ${\it\lambda}_{2}$
of the tensor
 ${\it\bf\Psi}^{\mathbf{2}}+{\it\bf\Omega}^{\mathbf{2}}$
. Here
 ${\it\bf\Psi}$
and
 ${\it\bf\Omega}$
are the symmetric and the anti-symmetric parts of the velocity-gradient tensor, respectively. It has been demonstrated that the second eigenvalue
 ${\it\lambda}_{2}$
can be used to accurately identify the location of the vortex cores, because it captures the minimum pressure in a plane perpendicular to the vortex axis at both high and low Reynolds numbers (Jeong & Hussain Reference Jeong and Hussain1995).
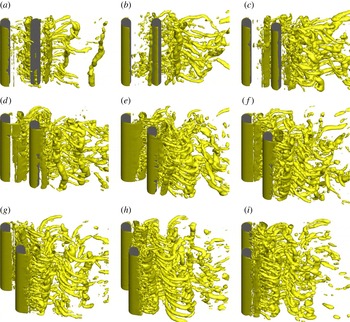
Figure 23 shows the isosurfaces of non-dimensional
 ${\it\lambda}_{2}=-1$
under the influence of alignment angles at
 $P/D=3$
. The vertical tubes in the isosurfaces of
 ${\it\lambda}_{2}$
generally indicate the locations where vortices in the
 $z$
-direction (
 ${\it\omega}_{z}$
) dominate, while the horizontal rib-like tubes represent the locations where the vortices in the directions perpendicular to the cylinders (
 ${\it\omega}_{x}$
or
 ${\it\omega}_{y}$
) dominate.
Instant isosurfaces of non-dimensional
 ${\it\lambda}_{2}$
at different alignment angles for two staggered cylinders with
 $P/D=3$
: the solid dark, cylinders; the light color,
 ${\it\lambda}_{2}=-1$
; (a)
 ${\it\alpha}=0^{\circ }$
; (b)
 ${\it\alpha}=5^{\circ }$
; (c)
 ${\it\alpha}=10^{\circ }$
; (d)
 ${\it\alpha}=15^{\circ }$
; (e)
 ${\it\alpha}=30^{\circ }$
; ( f)
 ${\it\alpha}=45^{\circ }$
; (g)
 ${\it\alpha}=60^{\circ }$
; (h)
 ${\it\alpha}=75^{\circ }$
; (i)
 ${\it\alpha}=90^{\circ }$
.

In all arrangements, the vertical vortex structures are highly inclined in some cases, suggesting the high level of three-dimensionality of the flow around the cylinders. One such example is seen at
 ${\it\alpha}=15^{\circ }$
with greatly distorted wake. Another feature in the flow field is that the intensity of rib-like vortex flow structures increases with the increase in the alignment angle. When one cylinder is immersed in the wake of the other, the two cylinders behave like an elongated body in the streamwise direction and the shielding effects discourage the generation of three-dimensionality, as quantified in the enstrophy calculation. This is especially evident in the gap between the two cylinders at low alignment angles, where only a few rib-like vortices are seen, for instance, at
 ${\it\alpha}=0^{\circ }$
, 5° and 10°.
At high alignment angles, the rib-like vortices dominate the wake flow, leading to the increase of enstrophy of the flow fields. At high alignment angle in the shared wake, these spanwise flow structures cut the vertical tubes that are seen at
 ${\it\alpha}=0$
and 5° into pieces and therefore can hardly be found at
 ${\it\alpha}=75^{\circ }$
and 90°. As a result, the primary enstrophy accounts for a major part of the total enstrophy in the flow field. It is reasonable to conclude based on 3D flow field observations that the presence of a downstream cylinder not only weakens the 3D flow structures in the gap region between the two cylinders, but also in the shared wake of the two cylinders.
A single wake is formed at low incident angles (
 ${\it\alpha}=0^{\circ }$
and
 ${\it\alpha}=5^{\circ }$
), where the separated shear layers from Cyl_up reattach onto the surface of the downstream one, instead of forming vortices within the gap. It can be seen in figure 23 that very few vortices are located in the gap at
 ${\it\alpha}=0^{\circ }$
and 5°. This is similar to the flow reattachment regime at intermediate pitch ratios for two tandem cylinders. At
 ${\it\alpha}=10^{\circ }$
, wake vortex shedding from Cyl_up can be identified. The vortices that are shed from Cyl_up are very weak and they are attracted towards the inner side of Cyl_down and then merge with the vortices from the inner side of the downstream, forming a single wake in regime S-II. The 3D flow feature at
 ${\it\alpha}=15^{\circ }$
is similar to that at
 ${\it\alpha}=10^{\circ }$
but with stronger vortices being shed from Cyl_up.
Two wakes can be clearly seen for alignment angles larger than 45° inclusive, where the vorticity shed from both cylinders are convected in the downstream direction for a considerable distance forming a flow regime T-I. Strong interaction between the two vortex streets in the wake leads to a very chaotic flow pattern in flow regime T-I. At larger alignment angles (
 ${\it\alpha}=75^{\circ }$
and 90°) the flow in the wake of each cylinder is very similar to that in the wake of an isolated single cylinder. At
 ${\it\alpha}=90^{\circ }$
, the vortex shedding processes from the two cylinders are either in-phase or in anti-phase with each other, forming the so-called synchronized vortex shedding (Sumner et al.
Reference Sumner, Price and Paidoussis2000).
The variation of the flow in the spanwise direction of the cylinders is further investigated by analysing the variation of pressure coefficient along the spanwise direction. The time evolution of the distribution of the base pressure (pressure exerted on aft end of the body) on Cyl_down along the spanwise direction is shown in figure 24, for three selected alignment angles of
 ${\it\alpha}=5^{\circ }$
, 30°and 75°, representing flow regimes S-I, S-II and T-I, respectively (regime T-I and T-II are too similar to be distinguished from each other based on pressure). In general, the base pressure decreases significantly with increasing
 ${\it\alpha}$
, which contributes to the increase of drag coefficient. It is also observed from the contours of the pressure coefficient that the spanwise flow features become more obvious when Cyl_down moves out from the wake of Cyl_up. At
 ${\it\alpha}=5^{\circ }$
, the pressure colour ribbons are generally intact and parallel to the
 $z$
-axis, for instance, between
 $330\leqslant Ut/D\leqslant 360$
, although the pressure colour ribbons are less intact at around
 $Ut/D=310$
, 370–400. A single colour ribbon (to cylinder axis) indicates strong two-dimensionality of the flow. The discontinuity of pressure colour ribbons is more prevailing at
 ${\it\alpha}=30^{\circ }$
, where only occasionally, parallel pressure colour ribbons are observed. At
 ${\it\alpha}=75^{\circ }$
, pressure ribbons are broken into small pieces, indicating the dominance of fine flow structures and weakening of organized flow modes. The change in base pressure distribution is a manifestation of lessening of the shielding effect and wake interference with the increase of alignment angle.
Time histories of the base pressure coefficients on the downstream cylinders in spanwise direction at
 $P/D=3$
for three selected alignment angles: (a)
 ${\it\alpha}=5^{\circ }$
; (b)
 ${\it\alpha}=30^{\circ }$
; (c)
 ${\it\alpha}=75^{\circ }$
.

The variation of the flow in the spanwise direction is quantified by measuring the spanwise standard deviation of the base pressure at an instant
 $C_{pb}^{dev}(t)$
for the two cylinders, which is defined as
 $$\begin{eqnarray}C_{pb}^{dev}(t)=\sqrt{\frac{1}{N}\mathop{\sum }_{i=1}^{N}\left(C_{pb}(z_{i},t)-\overline{C_{pb}(t)}\right)^{2}}\end{eqnarray}$$
where
 $\{C_{pb}(z_{1},t),C_{pb}(z_{2},t),\dots ,C_{pb}(z_{N},t)\}$
are the observed values of base pressure at an instant along the spanwise direction (
 $z$
), while the denominator
 $N$
stands for the size of the sampling points and a total of 100 points were sampled at each of the baseline along the spanwise length of the two cylinders;
 $\overline{C_{pb}(t)}$
is the instantaneous mean value of these observations, which can be formulated as
 $$\begin{eqnarray}\overline{C_{pb}(t)}=\frac{\displaystyle \mathop{\sum }_{i=1}^{N}C_{pb}(z_{i},t)}{N}.\end{eqnarray}$$
Then averaging in the time domain of
 $C_{pb}^{dev}(t)$
yields
 $\overline{C_{pb}^{dev}}$
. The method measures the r.m.s. value of base pressure in the spanwise direction and then averages it in time, thus can be regarded as an indicator of spanwise variation. The results for the case of
 $P/D=3$
are presented in figure 25, including both upstream and downstream cylinders, as well as those for a single cylinder for comparison. The flow regimes S-I, S-II, T-I and T-II are also marked from left to right for this case. The pressure fluctuation on Cyl_up are considerably smaller than that of a single cylinder for
 ${\it\alpha}\leqslant 60^{\circ }$
, while it is much larger on Cyl_down than the single-cylinder case for
 ${\it\alpha}\geqslant 15^{\circ }$
. For the same reason as explained in drag forces, the minimum fluctuations are found at a slight inclined arrangement of around
 ${\it\alpha}=10^{\circ }$
instead of
 ${\it\alpha}=0^{\circ }$
for both cylinders (0.012 and 0.051, respectively). In regime S-II, a leap of pressure fluctuations is observed because of inception of vortex shedding from Cyl_up. The fluctuations of pressure on Cyl_down stay nearly flat at the end of regime S-II and T-I because the interaction has reached to its maximum; in contrast, Cyl_up experiences a steady increase from 0.029 at
 ${\it\alpha}=30^{\circ }$
as the three-dimensionality increases in the gap region. At
 ${\it\alpha}=90^{\circ }$
, as anticipated, the fluctuations are close for both cylinders of approximately 0.08, which is slightly higher than the value for the isolated cylinder (0.06) due to the flow interference from the two cylinders.
Mean base pressure fluctuations for two staggered cylinders of
 $P/D=3$
as a function of alignment angle at
 $\mathit{Re}=10^{3}$
: ▫, upstream cylinder; ▵, downstream cylinder; - - - -, single cylinder.

6. Conclusions
Steady uniform flow around two staggered cylinders is simulated numerically at a low subcritical Reynolds number of
 $10^{3}$
. The flow through and after the two-cylinder system are analysed for pitch ratios (
 $P/D$
) of 1.5, 2, 3 and 4 with the flow incident angle (
 ${\it\alpha}$
) between 0° and 90°. The main conclusions are summarized below.
-
(i) The pressure distribution on each of the two cylinders changes significantly with the change of the arrangement, especially when
 $P/D\leqslant 3$
and
${\it\alpha}\leqslant 60^{\circ }$
. The movements of stagnation points and variations in pressure distribution around the cylinder surface are the manifestations of the vigorous interference in the flow field under the presence of another cylinder.
-
(ii) Owing to the shear layer and vortex interactions, both cylinders experience smaller drag force at low alignment angles than that of a single cylinder, and vice versa at high alignment angles. Negative drag is found on the downstream cylinder for cases with small alignment angles and medium pitch ratios (
${\it\alpha}\leqslant 5^{\circ }$
and
$P/D\leqslant 3$
). Because of the biased flow field and the gap flow, the mean lift coefficient is characterized by the attractive force at medium alignment angles (
$5^{\circ }\leqslant {\it\alpha}\leqslant 30^{\circ }$
) and by repulsive force at large alignment angles (
${\it\alpha}\geqslant 30^{\circ }$
). All of these force features become less obvious with the increase of pitch ratio. -
(iii) Each of the two cylinders exhibits an individual vortex shedding frequency for intermediate pitch ratios and alignment angles. The St of the upstream cylinder is higher because the limited space in the wake restricts the growth of large vortex cores; but instead, only small-scale vortices are shed from the upstream cylinder, which takes a short period of time to develop. On the other hand, there is less limited space in the wake of the downstream cylinder for large vortex to grow in longer time, which forms a biased flow deflecting to the upstream cylinder.
-
(iv) Four distinct vortex shedding regimes are identified based on numerical flow visualization, FFT analysis of lift forces and FFT analysis of velocity sampled from the wake of the cylinders. It is demonstrated through numerical examples that accurate classification of the vortex shedding regimes behind two staggered cylinders can only be achieved by 3D simulations (rather than 2D simulations) and also by the combination of the flow visualization and the FFT analyses of lift forces and velocity.
-
(v) It is found that the flow approaching angle has a significant effect on the three-dimensionality of the flow, which applies not only to the gap region between the two cylinders, but also to the shared wake of both cylinders. At
$P/D=3$
, the qualitative analysis on enstrophy and spanwise pressure fluctuations demonstrates that the three-dimensionality of the flow is significantly weakened at low
${\it\alpha}$
in almost two of the classified regimes. Interestingly and probably surprisingly, strong wake interaction around two-staggered cylinders at
$P/D=3$
and
${\it\alpha}\geqslant 15^{\circ }$
, which results in very disturbed flow field, does not obviously increase the three-dimensionality of the flow.


Acknowledgements
This work was supported by Australian Research Council Discovery grant (project ID: DP110105171) and by iVEC through the use of advanced computing resources (Epic and Magnus supercomputers) located at iVEC@Murdoch. F.T. would like to acknowledge the support of the Australian Government and the University of Western Australia by providing SIRF and UIS scholarships for a doctoral degree.