


Introduction
Surface drag coefficients (CDN10) are used to calculate the atmospheric stress on the ice, given a wind speed, from which the movement of the ice floes can be estimated. This is a significant component in the total sea-ice momentum balance, and is important for improving global climate models, as well as models confined to the Antarctic region. While atmospheric models calculate the surface drag, ice models using prescribed winds often adjust this value to improve the results. For example, Fischer and Lemke (1994) found better agreement between their model and Weddell Sea buoy-drift tracks by changing CUMIO from 2.75 X10 −3 (a value commonly used in Arctic models) to 1.5 X 10 −3.
Although there have been many sets of drag coefficients published for Arctic sea-ice data (e.g. Banke and Smith, 1973; Reference OverlandOverland, 1985), there are only about seven published studies for the Antarctic (e.g. Reference Martinson and WamserMartinson and Wamser, 1990; Reference Andreas, Lange, Ackley and WadhamsAndreas and others, 1993). The differences in the ice and atmospheric conditions between the two polar regions can result in significant differences in the drag coefficients. Arctic coefficients have been found to range from as low as 0.2 X 10⁻³ (Reference SmithSmith and others, 1992) to at high as 8.0 X 10 −3 for extremely rough multi-year ice (Guest and Davidson, 1991). Antarctic coefficients generally range between much closer limits, with an average first-year Antarctic coefficient of 1.5 X 10⁻³ found by Andreas and others (1993). This is 25% lower than the median Arctic values determined by Guest and Davidson (1991).
Arctic sea ice is generally much thicker than sea ice in the Antarctic, and is typically deformed into long linear ridges several metres high. in contrast, the thinner Antarctic sea ice often displays centimetre-scale roughness on its surface caused by wind deposition of snow. Andreas (1995a) showed that drag coefficients depend more directly on roughness elements on the order of centimetres (e.g. sastrugi and snowdrifts), and these small undulations are often the dominant factor in determining the value of the drag coefficient. Andreas'S adaptation of Reference RaupachRaupach'S (1992) model provides theoretical justification for this conclusion, which has also been stated by other authors (e.g. Reference Jackson and CarrollJackson and Carroll, 1978).
This study adds to the relatively few Antarctic surface-drag studies, and compares coefficients from the eastern and the western Weddell Sea. The ice in these regions can differ substantially in age and deformation. The Weddell Gyre sweeps clockwise around the Weddell Sea, causing the pack ice to be forced in a westerly direction, increasing floe interaction and the interaction of the ice with the Ant-arctic Peninsula coastline. This leads to an increase in deformation in the western Weddell Sea (Reference Lange and EickenLange and Eicken, 1991). Most of the ice found in the eastern Weddell Sea can be classified as first-year ice, while I hat in the western region is generally multi-year ice.
Although there have been other drag-coefficient studies in the Weddell Sea, most have used vertical wind-velocity profiles to determine the ice-roughness length (ZQ) and CDNIO- This study uses the method of Andreas and others (1993), where 100-200 m profiles of snow-surface elevation measurements are used to calculate CDN10 from an empirical relationship derived by Banke and others (1980). The data also include repeated profiles which enable temporal changes to be examined. Pairs of profiles, with one profile taken in a perpendicular direction to the other profile, are compared, to determine the directional dependence of CDN10.
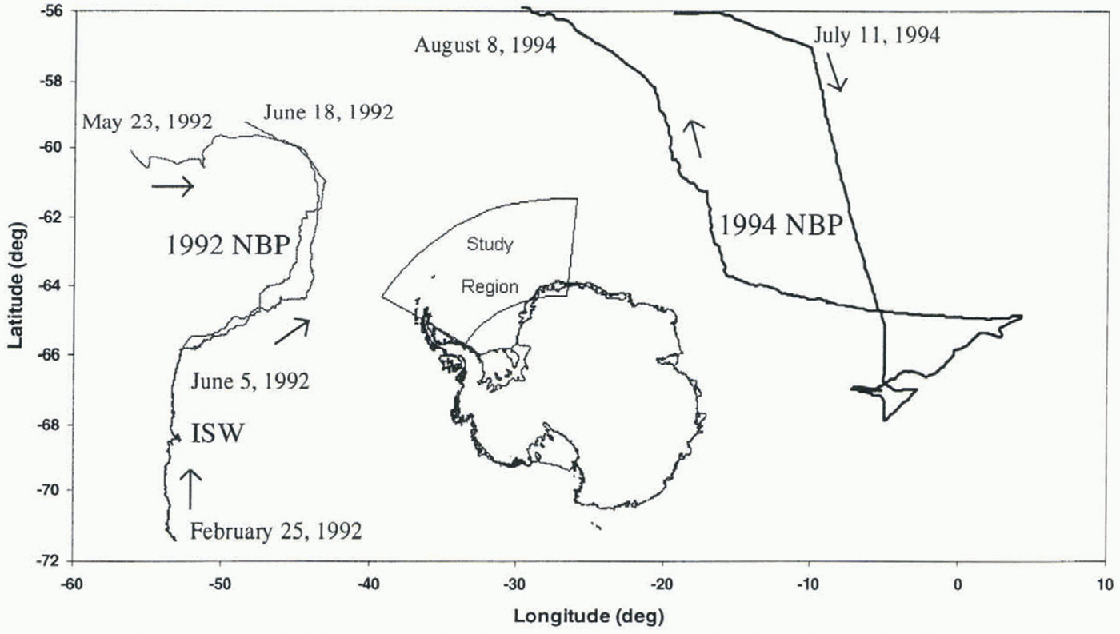
Study location of Ice Station Weddell (ISW), and 1992 and 1994 R/V Nathaniel B. Palmer (NBP) voyages.
Drag Coefficient Theory
The balance of forces on an ice floe determines its v elocity (Martinson and Warmer, 1990), such that

where  is the net force exerted on the ice floe mice
is the ice mass per unit area, Vice is the ice-velocity vector), —imicefVice
is the Coriolis term (i is the imaginary unit
 is the Coriolis force),
 is the atmospheric stress, Tw is the water stress, and I is the internal ice stress. The atmospheric and water stresses can be related to the air or water velocity by
 where p is the density of the air or water, CD
is the drag coefficient acting at the air-ice or ice-water interface, and U is the air or water velocity.
The relationship used for calculating CDN10 (Banke and others, 1980) is given by Equation (2), where Z is the roughness scale, in cm. Neutral atmospheric stability is assumed for this study, and the coefficients are referenced to a standard height of 10 m a.s.1.

The roughness scale is calculated from the Fourier spectrum, x(k), of the surface elevation measurements, where k0 is the wavenumber and is the lowest wavenumber.
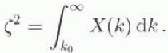
A linear regression performed on Arctic data by Banke and others (1980) correlated measured wind-speed profiles with surface roughness, obtaining Equation (2). Although it is an empirical relationship, and Arctic and Antarctic sea-ice conditions generally differ significantly, theoretical justification of the regression's use in either polar region is provided by Andreas (1995b) through a modified version of Raupach'S (1992) model. The results have also been com-pared with drag coefficients calculated using more conventional methods, such as wind-velocity profiles (e.g. Andreas and others, 1984; Martinson and Wamscr, 1990).
All the floes measured had a snow cover. CDN10 was calculated using both snow-surface elevation data, and ice-elevation data, symbolising a hypothetical snow-free ice surface. The rms roughness of the surfaces was also calculated to investigate the relationship between this and the drag coefficient. A full explanation of the theory behind the method can be found in Andreas and others (1993) or Fisher (1996).
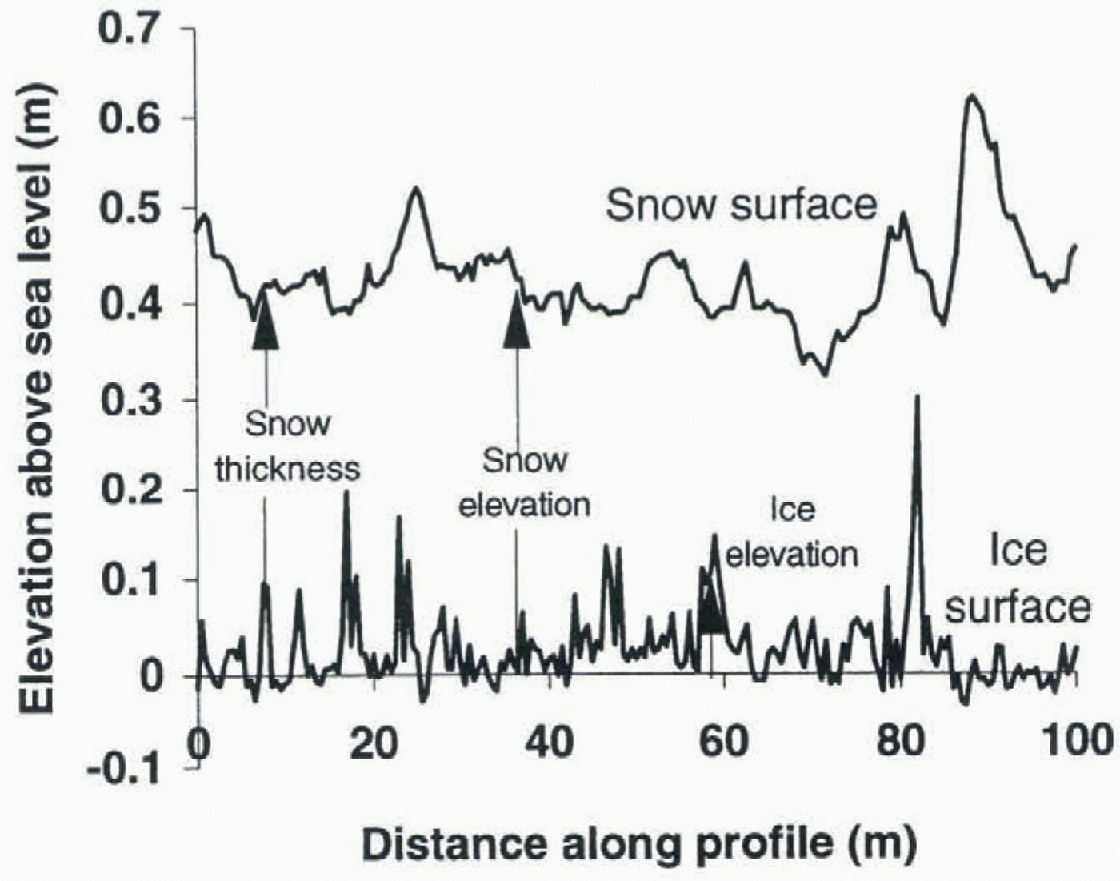
Example of the measured and calculated distances taken for each profile. This profile shows an example taken on 10 June 1992. The snow-surface rms roughness for this profile is 4.9 cm and the ice surface rms roughness is 4.2 cm.
Data
The data analyzed in this study were collected during three field experiments, in 1992 and 1994. The date and location of each experiment are shown in Figure 1. Surface roughness measurements were taken in the Weddell Sea during two ship-based voyages using R/V Nathaniel B. Paimer (NBP), and also from Ice Station Weddell (ISW). See Andreas and Claffey (1995), Reference Ackley, Gow, Lytle, Yankielun and DarlingAckley and others (1992) and Reference McPheeMcPhee and others (1996) for details of the ISW, 1992 NBP and 1994 NBP experiments, respectively. The data collected included elevation measurements of the snow cover, ice surface and ice draft, and meteorological data. The elevation profiles were collected using two methods: drillholes or laser levelling devices. All datascts provide measurements at regular intervals, either 0.5 or 1.0 m intervals along a linear transect. There were no significant differences in the results from the diff érent measurement intervals. Figure 2 shows an example of the elevation measurements made during the 1992 NBP voyage.
The elevation data were collected with an error of ± 0.5 cm. This measurement error results in drag coefficients with an absolute error of 5.6 X 10 −6, which equates to 0.4% of the average drag coefficients, 1.3 X 10⁻³ and 1.4 X 10⁻³. This is negligible compared with the errors involved in using the regression line of Banke and others (1980), who gave errors of 0.2-0.4 X 10⁻³. Other published errors for drag-coefficient work are in the range 0.3 0.5 X 10⁻³ (Reference AndersonAnderson, 1987), while Guest and Davidson (1991) gave accuracies of 20% or better.
Data summary for Ihr three dataseis used. in each case, snow and ice surface elevation profiles were measured
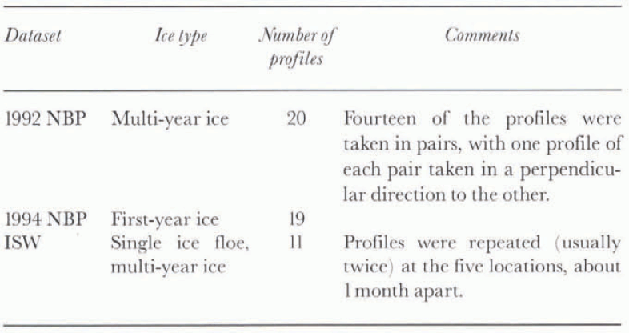
Table 1 summarises ihe dala collected. Twenty profiles were collected over multi-year ice during the 1992 NBP voyage, of which seven pairs were taken with the profiles perpendicular to each other to examine the directional dependence of CDN10. During the 1994 XBP voyage 19 profiles were collected over first-year ice. The 11 profiles collected during the ISW experiment were all taken on a single floe, in five locations. Each of the five initial profiles was remeasured after about 25-55 days, and one location was measured three times. These repeated profiles are used to examine temporal changes in CDN10, in particular the effect of snow-ice formation. The profiles are named after the day of the year on which they were collected (e.g. profile 66 refers to the transect ofsur-faee elevation measurements recorded on 6 March). The two profiles taken at each location on ISW are considered as a “pair” of profiles, and the notation 56-112 (for example) is used. This refers to the profile taken on day 56 and that taken on day 112, both along the same lines.
During ISW, the camp location was determined using a global positioning system (GPS) about 20 times per day. These locations were interpolated to hourly values, and compared to measured wind speeds as reported in Andreas and Claffey (1995). Similarly, during the 1994 NBP voyage, the ice velocity was estimated from GPS position mcasurc-ments (lining two drifting ice camps, each approximately 1 week long, and compared to measured wind speeds (McPhee and others, 1996). The results from a linear correlation of the wind speed with ice-drift rates are presented to highlight the different dynamics observed in the two regions during the different experiments.
Results
The drag coefficients calculated in this study range between 1.2 X 10 −3 and 2.2 X 10⁻³ for the eastern Weddell Sea and 1.2 X 10 −3 and 1.6 X 10 −3 for the western Weddell Sea. Table 2 shows the minimum, average and maximum coefficients, and the average rms roughness ofeach dataset. All the drag coefficients are remarkably similar, considering the different regions, ice types and years from which the data were collected.
Minimum, average and maximum drag-coefficient values for the snow surface, and average rms roughness of the snow profiles
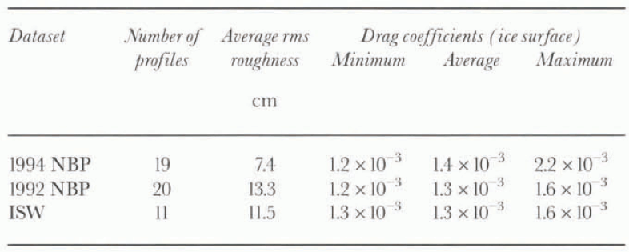
The eastern Weddell Sea region shows much lower snow-surface rms roughness, with the dataset'S (1994 NBP) average (7.4cm) 44% lower than the average rms roughness of the 1992 NBP western Weddell Sea voyage (13.3 cm), and 36% lower than the ISW dataset (11.5 cm). The ice surface of the eastern region is similarly lower in rms roughness.
The drag coefficients calculated for the eastern Weddell Sea region are, on average, higher than those for the western region, possibly due to the greater amount of small roughness elements, such as saslrugi and snowdrifts, in the eastern Weddell Sea.
Snow Cover
The snow layer typically found on Antarctic ice floes tends to collect around roughness elements, modifying the ice surface (Andreas, 1995b) which may affect the drag coefficient. To determine the effect of snow on CDN10, drag coefficients were calculated for the ice surface underlying the snow.
This gives an idea of the ice surface's roughness and the way in which it would interact with the atmosphere if there were no snow cover. Since the ice surface is not actually exposed to the atmosphere, it is possible that the surface is not the same as it would be without its protecting snow layer. Rafting and ridging of the ice occurs regardless of the presence of snow and is still represented in the ice-surface elevation measurements. Therefore the coefficients calculated (table 3) may not perfectly represent snow-free ice, but they do present an estimate of the coefficients for snow-free ice. This provides a means for investigating the effect of the snow cover on the surface roughness, and hence the drag coefficient. It is intuitively expected that the ice surface would be rougher than the snow surface, which has the snow cover smoothing it. However, the snow develops its own roughness which is a combination of roughness from the ice surface and wind-created disturbances (e.g. sastrugi).
Minimum, average and maximum drag-coefficient values for the ice surface, and average rms roughness of the ice-surface elevation measurements
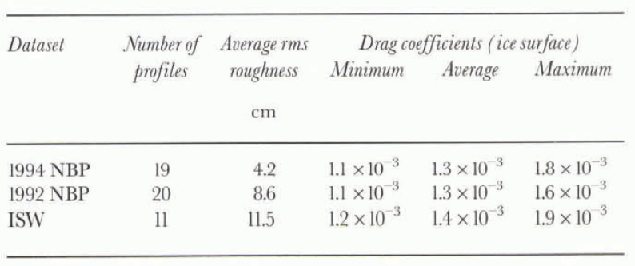
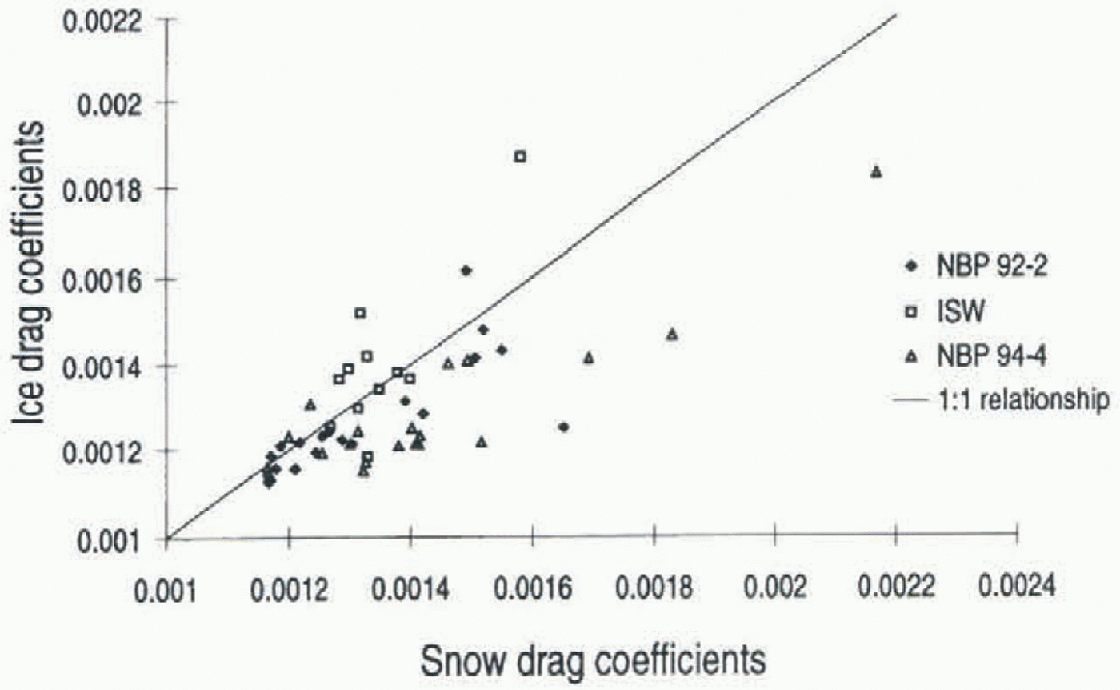
The snow and ice drag coefficients were found to be similar, although there is a tendency for the snow values to be larger (Fig. 3), indicating a rougher snow than ice surface. This implies that sastrugi and other snowdrifts increase the surface roughness, and hence the snow CDN10. Most of the coefficients are located around the 1:1 relationship line, which is similar to the results of Andreas and others (1993).
Average snow thickness over the profiles ranged between 7.2 and 70 cm. There was no correlation between snow thickness and either the snow or ice CDN10.
Comparison of drag coefficients over snow and ice surfaces, where the 1992 NBP and ISW data were collected in the western Weddell Sea and the 1994 NBP dala in the eastern Weddell Sea.
Surface Flooding
Changing surface winds have been shown to modify the snow surface and alter the drag coefficient (Andreas and Claffey, 1995). Here, the effect of a changing ice surface on the snow-surface drag coefficient is investigated, in particular the influence of refreezing slush on the ice surface. Surface slush is frequently found on Antarctic sea ice, and the refreezing of the slush can significantly alter the ice surface roughness (Lytle and Ackley, 1996). This in turn can alter the snow surface roughness, affecting the amount of atmospheric stress acting on the floe.
A comparison of profile pairs, with the two profiles collected a month or more apart on ISW, is shown in Figure 4. Two of the locations had slush over most of the ice stirface during the first profile (56 and 66), which refroze before the second profile (112 and 110) was measured. A third location (78) was initially covered partially with slush. No slush was observed on the second profile (104) or on the subsequent profile pairs (110(b)-134, 97-131). No ice deformation was observed between the measurements. A decrease in two of the three flooded pairs of ice-drag coefficients over time indicates a smoothing of the ice surface roughness. This is also reflected by less variability in the coefficients calculated for the second profiles compared with the first profiles. This suggests that there is less variation in ice roughness after flooding has occurred.
Temporal comparison of drag coeffients of ISW profile pairs. ♦ indícales that substantialflooding was evident in the first profile; □ indicates that only partial flooding was evident. The names of the profile pairs given on the X axis represent the two days on which the profiles in the pair were measured. The symbol representing the “first profile” corresponds to the profile named first. See text for more details. Note: Where only one symbol is visible, the coefficients of the first and second profiles are the same.
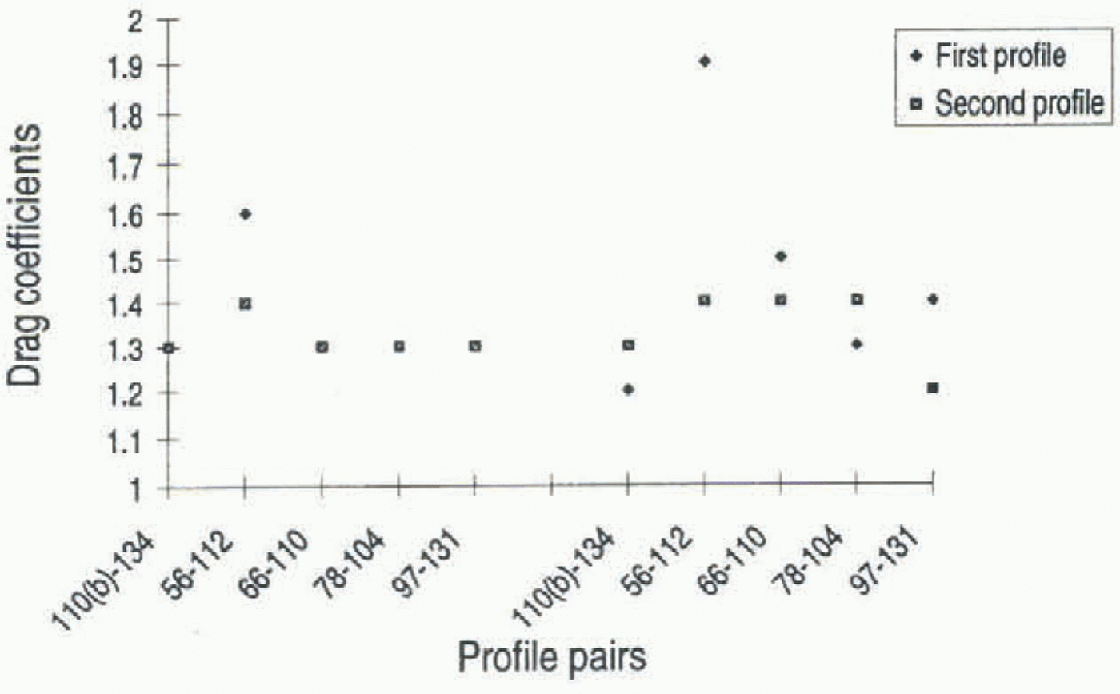
In the partially flooded profile pair where there was little temporal change in the ice coefficients (78-104), there was also no change in the snow coefficients. Both the profile pairs witli substantial flooding (56-112,66-110) showed a significant decrease in the ice coefficient. This led to a significant change in the snow coefficient and snow surface roughness of the 56-112 pair. This indicates that flooding, which can lead to a smoothing of the ice-floe surface, may at times be a significant factor affecting the snow surface CDN10, if the change in ice CDN10 is large enough.
High ice roughness may indicate that a floe has been deformed but no smoothing from frozen slush has occurred. This is supported by results from the 1994 NBP voyage where the highest drag coefficients were calculated for profiles 224b and 224c shortly after significant deformation occurred. in this situation, day 223 saw a storm with hurricane-force winds and increased ice deformation. By day 224, the ice surface still appeared deformed and had not yet been smoothed through flooding or weathering. This floe had significantly higher coefficients calculated for this day (224b: snow CDN10 = 1.8 X 10 −3, ice CDN10 = 15 X10−3 224c: snow CDN10 = 2.2 X 10⁻³, ice CDN10= 1.8 X10 −3) than for the other 1994 NBP coefficient s.
Wind-Speed Dependence
Although the ice drift correlates well with wind speed, the average ratio of the wind to ice velocities differs between the eastern and the western Weddell Sea. Figure 5 shows the ice-drift rate compared to the 10 m wind speed for ISW and 1994 NBP, and the calculated regression. Ice-drift speeds for 1992 NBP are not available.
Dependence of drift rale on wind speed at 10 m a.s.l. The solid lines in the plot show the correlation between the wind speed and ice drift, where the ice was found to drift at about 3.5% of the wind speed for the 1994 NBP data, and at about 2.5% for the ISW data.
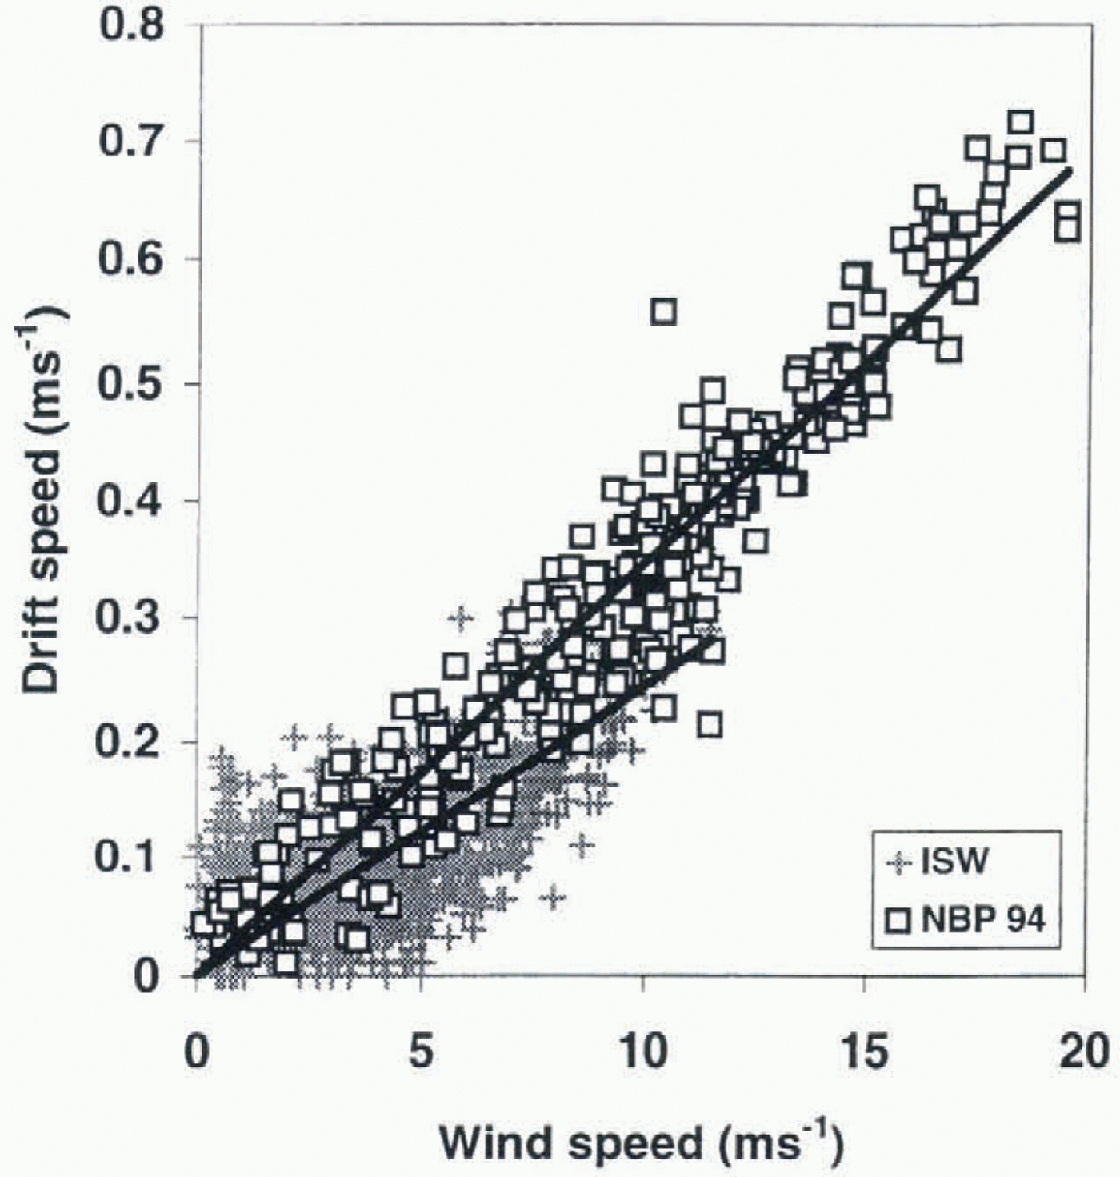
The ISW dataset shows lower drift rates than 1994 NBP and a lower dependence on wind speed, while the 1994 NBP data show a very strong wind-speed dependence and higher wind speeds. The ice drifted at about 3.5% of the wind speed for the 1994 NBP data, and at about 2.5% for the ISW data. Since the surface drag coefficients in the two regions are similar, these differences are due to different ocean currents, internal ice stress and water drag.
Directional Dependence
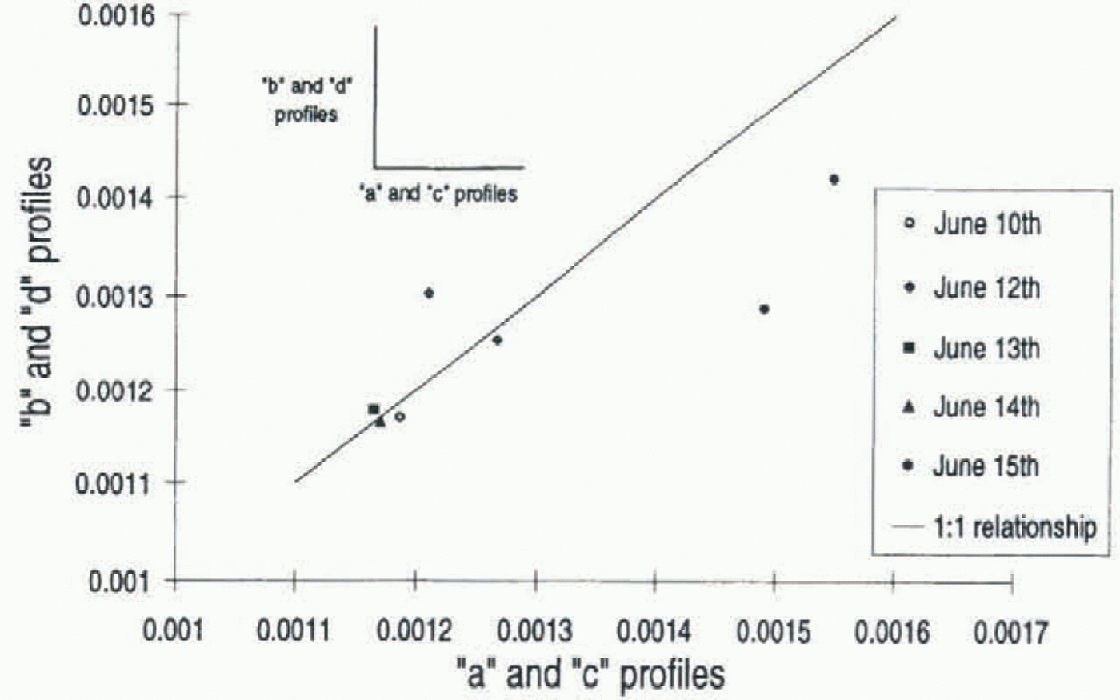
Perpendicular profile pairs collected during the 1992 NBP voyage were used to establish the directional dependence of CDN10 (Fig- 6). Most of the profile pairs show little directional dependence, indicating that the floes had similar roughness features in both directions. Only the two pairs taken on 15 June, which have the highest values, show differences in CDN10 when measurements are taken in perpen-dicular directions. Therefore, on at least this floe, the wind direction could result in different ice movements. This is somewhat contrary to the results of Andreas and Clafley (1995) who show that changes in wind direction can markedly change CDN10- Because the ship was only on station a few hours, a detailed history of the wind and floe orientation relative to the profiles is unavailable. Higher CDN10 values may be necessary for directional anisotropy to occur, or the profile lines may not have been oriented optimally to measure the anisotropy.
Comparison of the 1992 NBP perpendicular pairs. Profiles a and c are perpendicular to profiles b and d.
Conclusions
The results of this study are similar to those in the literature (e.g. Andreas and Claffey, 1995; Reference DierkingDierking, 1995), regardless of the study location or method of determination, although there is a tendency in the published coefficients towards slightly higher values than found here. Little difference was found between the drag coefficients of the eastern and western regions of the Weddell Sea, which is supported by the similarity of both regions coefficients in the literature.
This is the first study to investigate the effect of flooding on CDN10, and results show that it can cause a change in CDN10, Where the ice CDN10 is higher (at least 1.5 X 10 −3), the formation of snow ice was found to Contribute to a smoothing of the ice surface, in turn altering the snow surface roughness and reducing both the snow and ice CDN10-No significant change in CDN10 was found for lower initial values of CDN10 or where snow-ice formation did not occur. The modifying effect of flooding may partially expla in the similar range of CuNio found throughout the Weddell Sea region, where flooding is often found.
Despite similar drag coefficients in both regions, the difference in ice-drift rate between the regions suggests the influence of factors other than wind speed, such as water stability, ice interaction, water drag or ocean currents.
There has been a concentration in past Antarctic studies on the Weddell Sea. Little work has been done in other areas, although there are a few published results for East Antarctica (e.g. Reference Allison and AkermanAllison and Akerman, 1980). The large difference established between the drag coefficients in the Antarctic and Arctic, and the variability of the CDN10 within each of the polar regions, emphasises the need for more data to be collected in the Antarctic, especially areas other than the Weddell Sea, in order to make allowances for a variable drag coefficient, both spatially and temporally, in future models.
ACKNOWLEDGEMENTS พc thank S. Ackley, E. Andreas and p. Guest for the generous use of their data, and the reviewers for their helpful comments. Thanks to the officers and crew of R/V Nathaniel B. Palmer and the Academic Federov. Numerous people helped collect the data, including p. Amati, E. Andreas, J. Ardai, B. Castillo, J. Cavanaugh, K. Claffey, N. Darling, F. Evans, K. Golden, A. Gow, G. Kuehn and the Antarctic Science Associates personnel. This work was supported in part by NSF OPP 9315934 (principal investigator S. F. Ackley).



