Implications
Livestock production is one of the major consumers of fresh water, and the influence of livestock production on water resources is increasing because of the growing demand for livestock products. The results suggest that water use efficiency could be improved by alleviating resource constraints such as access to farm labor and livestock assets, oxen in particular. The findings of this research help in making decisions about where to invest scarce resources in order to improve water use efficiency in livestock production under rain-fed conditions.
Introduction
The global demand for fresh water to feed the world’s growing population is projected to increase. Part of this increase in demand for water will be in areas that rely on rain-fed agriculture (Wisser et al., Reference Wisser, Frolking, Douglas, Fekete, Schumann and Vörösmarty2010). The availability of rainwater is, however, limited because of the finite amount and uneven distribution of precipitation. Agricultural seasons in Ethiopia are characterized by high-intensity precipitation extremes followed by long dry periods, which result in water scarcity during the dry season (Alemayehu et al., Reference Alemayehu, Amede, BÖhme and Peters2012). The severity of water scarcity has prompted researchers, practitioners and policymakers to recognize water scarcity as an important constraint to increased food production over the next few decades (Hoekstra et al., Reference Hoekstra, Chapagain, Aldaya and Mekonnen2009). Therefore, maximizing yield per unit of rainwater has become an important management issue (Ali and Talukder, Reference Ali and Talukder2008; Bossio, Reference Bossio2009; Molden et al., Reference Molden, Oweis, Steduto, Bindraban, Hanjra and Kijne2010; Rockström et al., Reference Rockström, Karlberg, Wani, Barron, Hatibu, Oweis, Bruggeman, Farahani and Qiang2010). Strategic measures are, therefore, needed to increase the productivity of rainwater in agricultural production.
Livestock production is one of the major consumers of fresh water (Amede et al., Reference Amede, Descheemaeker, Peden and van Rooyen2009b; Peden et al., Reference Peden, Taddesse and Haileslassie2009; Diogo et al., Reference Diogo, Buerkert and Schlecht2010; Molden et al., Reference Molden, Oweis, Steduto, Bindraban, Hanjra and Kijne2010). Globally, livestock production accounts for about 20% of agricultural evapo-transpiration (ETa) (Molden et al., Reference Molden, Oweis, Steduto, Bindraban, Hanjra and Kijne2010). Water used to grow livestock feed is far greater than water required to meet the drinking requirements of livestock. Drinking water accounts for only about 2% of the total water need for livestock production, with much of the remainder being accounted for by water needed for feed production (Peden et al., Reference Peden, Tadesse and Misra2007). Increasing the efficiency of water used for livestock feed production could reduce future demands for agricultural water. Peden et al. (Reference Peden, Tadesse and Misra2007) defined livestock water productivity (LWP) as the ratio of beneficial livestock outputs and services to actual evapo-transpiration (ETa) of water in the production of livestock feeds. In mixed-crop livestock systems, the concept of LWP is a measure of the ability of the livestock production system to convert available rainwater into beneficial livestock outputs and services.
Different studies have estimated LWP in mixed-crop livestock systems in Ethiopia (Amede et al., Reference Amede, Geheb and Douthwaite2009a; Gebreselassie et al., Reference Gebreselassie, Peden, Haileslassie and Mpairwe2009; Peden et al., Reference Peden, Taddesse and Haileslassie2009; Descheemaeker et al., Reference Descheemaeker, Amede and Haileslassie2010). These studies show significant variation in LWP within and among farming systems, indicating a scope for improving LWP. We need insights into the factors that explain the observed variation in LWP in order to identify opportunities for improving LWP in mixed-crop livestock systems. To our knowledge, no study has systematically explored the factors that explain the variation in LWP between farming systems and farm households. Thus, we lack the information required to determine where to best invest resources in order to improve LWP. Therefore, the objective of this paper is to identify the factors that explain the variation in LWP within and between farming systems, taking Ethiopia as a case. We quantified LWP for various farms in diverse mixed-crop livestock systems and explored the effect of a range of factors including household demographic characteristics, farm assets and wealth status on LWP, using ANOVA and multilevel mixed-effect linear regression.
Materials and methods
Description of the study areas
This research was part of the larger Nile Basin Development Challenge (NBDC) research for development project in Ethiopia. The NBDC research program ran from 2010 to 2013, and aimed to improve the resilience of rural livelihoods in the Ethiopian highlands through a landscape approach to rainwater management (Sharma et al., Reference Sharma, Langan, Amede and Team2012; Merrey, Reference Merrey2013). The present study contributes to the research theme related to developing integrated rainwater management strategies. The research was carried out in the following three districts: Fogera, Jeldu and Diga in the Blue Nile Basin (locally known as Abay basin) in Ethiopia (Supplementary Figure S1). These three districts represent different agro-ecological zones and livelihood systems. Farmers practice low-input rain-fed agriculture, which results in low levels of production. Farming is basically subsistence oriented, implying that many farmers produce just enough to sustain their own families. Household resources (e.g. land, labor, local breeds of livestock) are the main production inputs used by the farmers. The mixed-crop livestock system is the dominant farming system in these districts. As the emphasis of this research is on assessing strategies to improve the efficiency of rainwater used in livestock production, we focused on the major contributor to this – that is, crops grown under rain-fed conditions to provide both food grains and crop residues for livestock feed. We also considered feed from private grazing lands.
The Fogera district is located in the north-eastern part of the Blue Nile Basin, close to Lake Tana (Supplementary Figure S1). The altitude ranges from 1800 to 2410 masl (meters above sea level) in the uplands and from 1774 to 1800 masl in the flood plains. Annual rainfall ranges from 1101 to 1651 mm. The district comprises of a large flat flood plain in the vicinity of the lake and undulating landscape in the uplands. Farmers in the flood plains practice relay cropping of grass pea (Lathyrus hirsutus) after the rice harvest using residual moisture. The majority of farmers in the district keep indigenous breeds of cattle, sheep, goats and equines to sustain their livelihoods. As in mixed systems in other developing countries (Diogo et al., Reference Diogo, Buerkert and Schlecht2010; Udo et al., Reference Udo, Aklilu, Phong, Bosma, Budisatria, Patil, Samdup and Bebe2011; Herrero et al., Reference Herrero, Grace, Njuki, Johnson, Enahoro, Silvestri and Rufino2013), the purpose of livestock rearing in the district encompasses provision of milk, meat and hides, traction, manure, standing asset and socio-cultural functions. Livestock is also used as an income buffer and is sold to cope with temporary shortfalls in income. Most households have no savings account other than the market value of their livestock. Smallholder farmers often save some surplus income in livestock. Sheep and goats are particularly kept for cash income and meat. Equines are used as pack animals for transportation. On the other hand, livestock makes use of crop residues that would otherwise go to waste. The major sources of feed for livestock in the district include crop residues and grazing on natural pasture (from private and communal grazing lands), seasonal fallow lands and road sides. Experts and farmers in the districts estimated that over 50% of livestock feed comes from crop residues. The contribution of supplementary feeds such as brans, oilseeds and other agro-industrial by-products is negligible.
Jeldu district is located in the south-western part of the Blue Nile Basin (Supplementary Figure S1). The altitude ranges from 1480 to 2880 masl in the district. Mean annual rainfall ranges from 856 to 1010 mm. Teff (Eragrostis tef) straw, wheat straw and barley straw are used for livestock feed, particularly during the dry seasons. Livestock rearing at Jeldu serves similar purposes outlined for Fogera, except that the role of horses as pack animals is more prominent at Jeldu.
Diga district is located in the south-western part of the Blue Nile Basin (Supplementary Figure S1). The altitude ranges from 1338 to 2180 masl in the district. Mean annual rainfall ranges from 1101 to 1936 mm. Distinct from the other two districts, fallow land and stubble grazing is very common at Diga. After harvesting the grain, animals are allowed to graze freely on the stubbles of maize and sorghum fields. Crop residues are mainly left on the fields for livestock grazing. Although the purpose of livestock rearing is similar to that of Fogera, farmers at Diga commonly use manure for soil fertility improvement through a corralling system. The use of manure for fuel is not common at Diga.
Household survey design and data collection
For this study, data were collected using a household survey. One watershed within each district was selected to implement the survey. In each watershed, we selected villages and farm households using a multi-stage sampling technique. First, three villages were selected within the selected watershed. Second, farm households were randomly selected from a list of all the farmers in a given village. In total, 220 households, comprising 62 households from Fogera, 91 households from Jeldu and 67 households from Diga districts, were selected for the survey. Using a pre-tested questionnaire, we collected information on household demographics, household assets such as land, labor and livestock holdings and major livelihood activities including crops, livestock and other economic activities, from October to December 2011. The questionnaire was completed through interviews with the head of the household or, in his/her absence, the most senior member available in the household. Through the household survey, we collected information on crop types, area under each crop and production of each crop, livestock herd structure, production and services. Feed resources from communal grazing lands contributed to the total livestock feed supply in the mixed-crop livestock systems. However, accurately estimating the areas under communal grazing lands and their biomass yields was not possible in household surveys. In our household survey, the area under communal grazing land was estimated as 0.40 ha at Fogera, 0.24 ha at Jeldu and 0.20 ha at Diga per household. This was a rough estimate of the available communal grazing lands. Our household survey methodology could not generate reliable information about the total area under communal grazing lands, biomass yield, number of users of the communal grazing land and the intensity of use by individual households. Therefore, area under communal grazing land was not included in the analysis. The focus in the present study was, therefore, on water use in feed production from land owned by individual farmers. Therefore, we focused on data collection in areas under private grazing and crop production for each household. The dry matter productivity of private grazing lands was estimated using existing grazing land productivity bench marks. Several studies reported grazing land biomass yields ranging from 0.4 to 12 ton dry matter/ha per year (Gabrielle and Gagnaire, Reference Gabrielle and Gagnaire2008; Borrion et al., Reference Borrion, McManus and Hammond2012). In our study a productivity of 2 ton dry matter/ha per year (Henricksen and Pauw, Reference Henricksen and de Pauw1988) was used as a bench mark to estimate total dry matter production in grazing lands, because the study by Henricksen and Pauw (Reference Henricksen and de Pauw1988) was more representative of the present study areas.
To enable comparison of farming systems, households were clustered into farming systems based on the dominant crops grown by the farmers. Categorization of sample households into farming systems is relevant because households pursue different livelihood strategies in each farming system to take advantage of the available agricultural potential. Accordingly, seven farming systems were identified. Fogera had two farming systems as follows: teff–millet in the uplands and rice–pulse in the flood plains. Jeldu had three major farming systems as follows: barley–potato in the uplands, wheat–teff in the midlands and maize–sorghum in the lowlands. Diga had two major farming systems as follows: teff–millet in the midlands and maize–sorghum in the lowlands. To enable a comparison of wealth categories, farm households were also categorized into three wealth categories – that is, poor, medium and better-off – based on farmers’ self-reported wealth rankings.
Computation of LWP
LWP is defined as the ratio of beneficial livestock outputs and services to actual evapo-transpiration (ETa) of water in the production of livestock feeds (Peden et al., Reference Peden, Tadesse and Misra2007; Haileslassie et al., Reference Haileslassie, Peden, Gebreselassie, Amede and Descheemaeker2009; Descheemaeker et al., Reference Descheemaeker, Amede and Haileslassie2010). Evapo-transpiration related to the actual production of above-ground biomass (ETa in millimeters per crop growth period) was computed based on the relationship between potential evapo-transpiration (ETc) and crop yields, collected through farmer recall interview (Fermont and Benson, Reference Fermont and Benson2011). To determine ETc, we first used the FAO Penman–Monteith equation to estimate evapo-transpiration of the reference crop (ET0). The Penman–Monteith equation determines the evapo-transpiration from the hypothetical grass reference surface and provides a standard to which the evapo-transpiration of other crops can be related (De Boer et al., Reference De Boer, Hoving, Vellinga, Van de Ven, Leffelaar and Gerber2013). Climate data (temperature, wind speed, precipitation) were estimated using New LocClim (Grieser et al., Reference Grieser, Gommes and Bernardi2006), which uses observations from meteorological stations to predict climate data at a given location by interpolation. Second, potential evapo-transpiration of the crop (ETc) was computed by multiplying ET0 with the crop coefficient K c (Allan, 1998). The crop coefficient is determined by crop type and the stage and length of growing period. The length of the growing period was determined for each crop in the three districts based on the estimates generated by New LocClim. Soil data were taken from the literature values corresponding to the study areas (Haileslassie et al., Reference Haileslassie, Peden, Gebreselassie, Amede and Descheemaeker2009). Actual yield of each crop for the main cropping season in 2011 was collected from the sample households using face-to-face interviews. Finally, the ETa for each crop type was computed based on ETc and additional data on soil and actual crop yields, using CropWat 8.0 software (Muñoz and Grieser, 2006).
In a multiple-output situation, such as cultivation of wheat producing grain and crop residues, we allocated ETa to the multiple outputs based on their relative economic values (Gabrielle and Gagnaire, Reference Gabrielle and Gagnaire2008; Borrion et al., Reference Borrion, McManus and Hammond2012). The harvest index and crop yield were used first to compute the mass value of various products produced per ha (Haileslassie et al., Reference Haileslassie, Bluemmel, Clement, Descheemaeker, Amede, Samireddypalle, Acharya, Radha, Ishaq and Samad2011). Subsequently, mass values were multiplied by their economic values to compute relative economic values of various products.
Livestock beneficial outputs and services including milk, livestock off-take, manure, traction, threshing and transportation were estimated in monetary values. All livestock types kept by the households were considered in calculating livestock beneficial outputs and services. Livestock off-take was defined as the proportion of animals sold or slaughtered for home consumption in a year. Off-take of livestock was calculated by summing the values of each animal type (in US$) that was sold, slaughtered for home consumption or gifted out in a year. To estimate the values of these products and services, information on the livestock herd structure, productivity and services given in a year were calculated as suggested by Haileslassie et al. (Reference Haileslassie, Peden, Gebreselassie, Amede and Descheemaeker2009) and Descheemaeker et al. (Reference Descheemaeker, Amede and Haileslassie2010). Haileslassie et al. (Reference Haileslassie, Peden, Gebreselassie, Amede and Descheemaeker2009) developed a simple spread-sheet model to estimate LWP values. The model can be specified mathematically as follows:
 $${\rm LWP}_{i} ={{\sum_{i=1}^n (O_{i} {\times}P_{i} {\plus}S_{i} {\times}P_{i} )} \over {\sum_{k=1}^n {\rm WD}_{k} }}$$
where i is the unit of observation, LWP the livestock water productivity, O i the quantity of ith livestock output (e.g. milk, meat, manure), S i the service type (e.g. traction) obtained per year, P i the local market price (US$) of the ith output and ith service type; WD k the amount of water depleted in evapo-transpiration for production of kth animal feed resources (e.g. on crop residues).
Statistical analysis
The difference in means of farm resources, beneficial outputs and LWP among farming systems and wealth categories was tested using one-way ANOVA. Tukey’s HSD test was used for the multiple mean comparisons (Gauch, Reference Gauch1988). Similarly, one-way ANOVA was used to test the differences in farm resources, sub-components of beneficial livestock outputs and LWP among wealth categories. The root mean square error is given in an addition column for ANOVA results as an indicator for model precision.
Furthermore, we used multilevel mixed-effect linear regression model to test the hypothesized relationships between LWP and the range of explanatory variables defined below. Multilevel mixed-effect linear regression model allows the analysis of both fixed effects, due to the explanatory variables, and random effects, due to clustering by the farming system (Goldstein, Reference Goldstein1986; Horton, Reference Horton2006). The multilevel mixed-effect linear regression model for LWP is specified as follows:
 $$\eqalignno{Y_{i} =\,\,&\beta _{0} {\plus}\beta _{1} x_{{i1}} {\plus}\beta _{2} x_{{i2}} {\plus}\beta _{3} x_{{i3}} {\plus}\beta _{{41}} x_{{i4}} \cr &{\plus}\beta _{5} x_{{i5}} {\plus}\beta _{6} x_{{i6}} {\plus}\beta _{7} x_{{i7}} {\plus}\beta _{8} x_{{i8}} {\plus}Zu_{i} $$
where Y i is the LWP, β 0 the intercept, β 1 to β 8 are regression coefficients of the explanatory variables, which represent fixed effect, X i1 the age of the household head, X i2 the gender of the household head (1=male, 0=female), X i3 the education level of the household head, X i4 family labor, X i5 the land holding size, X i6 the total livestock holding, X i7 the farmers wealth status, X i8 the value of crop production, Z the random effect due to clustering by farming system and u i the error term. The model was fitted for households across all the three districts. All statistical analyses were carried out with Stata 12 (StataCorp, 2011).
Description of factors explaining the variation in LWP
We included the key factors that influence LWP based on theoretical grounds and on previous empirical research on LWP (Knowler and Bradshaw, Reference Knowler and Bradshaw2007; Peden et al., Reference Peden, Tadesse and Misra2007 and Reference Peden, Taddesse and Haileslassie2009). We included factors that affect livestock output and services (numerator of the water productivity equation) and water consumption in feed production (denominator of the same equation). Poor water management is common in sub-Saharan Africa, which implies that socio-economic factors influence the optimum level of LWP (Rockström et al., Reference Rockström, Karlberg, Wani, Barron, Hatibu, Oweis, Bruggeman, Farahani and Qiang2010). Farmers make decisions about the cropping pattern depending on their resource endowment and food security objectives. Many non-water related factors such as shortages of draught oxen and family labor, inadequate access to capital for investments and limited skills of farmers influence agricultural production in rain-fed agriculture (Rockström et al., Reference Rockström, Karlberg, Wani, Barron, Hatibu, Oweis, Bruggeman, Farahani and Qiang2010). The explanatory variables included in the analysis and their postulated effects on LWP are discussed below.
Age of household head (years)
Age of the household head can be considered as an indicator of experience in farming. On the other hand, older farmers may not have the physical strength to implement labor- intensive rainwater management practices. Therefore, the effect of age on use of new rainwater management practices is ambiguous.
Gender (male=1 and female=0)
Women in Ethiopia play important roles in livestock production such as cattle feeding, barn cleaning, calf rearing, milk handling and marketing; however, they are often locked out of land ownership, access to productive farm inputs and support from extension services. These challenges mean that, on average, female farmers produce less per hectare than men, which adversely affects LWP (Marenya and Barrett, Reference Marenya and Barrett2007). Therefore, the gender of the household head being female could be negatively associated with LWP.
Education level of the household head (years)
Education level is expected to have a positive influence on the use of improved crop and livestock husbandry practices, because of the assumed link between education and knowledge (Rahm and Huffman, Reference Rahm and Huffman1984; Knowler and Bradshaw, Reference Knowler and Bradshaw2007).
Family labor (in adult equivalents)
The use of better land and water management practices requires sufficient family labor. Shortage of family labor can prevent the implementation of better agronomic practices (e.g. timely planting and weeding) that have the potential to increase crop productivity (Giller et al., Reference Giller, Tittonell, Rufino, Van Wijk, Zingore, Mapfumo, Adjei-Nsiah, Herrero, Chikowo and Corbeels2011a). We hypothesize that households’ productive labor force is positively associated with LWP.
Total land holding (ha)
Larger land holdings are associated with greater wealth and increased availability of capital. Farmers with larger land holdings are more likely to invest in land and water management practices that increase LWP (Hanjra et al., Reference Hanjra, Ferede and Gutta2009; Jayne et al., Reference Jayne, Mather and Mghenyi2010). Therefore, the size of land holding is expected to have a positive influence on LWP.
Livestock holdings (in TLU)
Livestock provide replacement oxen, which are the main source of draught power for land preparation and manure for soil fertility replenishment (Sasson, Reference Sasson2012). Particularly, availability of oxen for land cultivation is an important factor in determining the level of above-ground biomass production in mixed-crop livestock production systems in Ethiopia (Haileslassie et al., Reference Haileslassie, Priess, Veldkamp and Lesschen2006). Shortage of traction oxen for timely agronomic practices can limit the size of the cropped area and also yields. Ownership of large numbers of livestock provides the opportunity to generate beneficial output from feeds and improve overall LWP. The effect of livestock holding on LWP is, therefore, expected to be positive.
Grain yield (kg)
There is a well-established positive linear relationship between plant biomass and transpiration (Rockström, Reference Rockström2003). Crop residues are the major livestock feed component in mixed-crop livestock systems. Therefore, interventions that improve crop water productivity in plant biomass production also improve LWP. Hence, better crop yield is expected to have a positive influence on LWP. The value of grains was used to facilitate comparison of total crop production between farming systems and wealth categories with different crop compositions.
Wealth category was included as one of the explanatory variables in the regression to control for the effects that may not be accounted by major farm resources, such as land and livestock holdings. The effects of farming system were considered as a clustering variable in the model to control the random effect.
Results
In this section, we present the results of ANOVA and the regression analysis. First, we present the ANOVA results of farm resources, livestock beneficial outputs and LWP for farming systems and wealth categories.
Farm characteristics, water used in livestock feed production, livestock beneficial outputs and LWP by farming systems
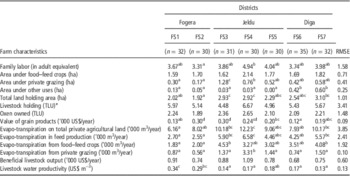
Means of farm characteristics and LWP for the farming systems are presented in Table 1. Differences were found between farming systems with regard to labor and land holdings. Farmers in wheat–teff farming systems at Jeldu (FS4) had more family labor compared with farmers in other farming systems. Farmers in wheat–teff farming systems at Jeldu (FS4) and in teff–millet (FS6) and maize–sorghum farming system at Diga (FS7) had relatively more land than farmers in other farming systems. The total value of grain products, the amount of rainwater evapo-transpired in livestock feed production and LWP were different among farming systems. LWP was relatively higher in teff–millet (FS1) and rice–pulse (FS2) farming systems at Fogera. However, there was no clear difference in total beneficial livestock output between any of the farming systems. The difference in LWP mirrored the difference in the amount of rainwater evapo-transpired in livestock feed production.
Means of farm resources and livestock water productivity of households in different farming systems in each district

FS1=teff–millet–Fogera; FS2=rice–pulse–Fogera; FS3=barley–potato–Jeldu; FS4=wheat–teff–Jeldu; FS5=sorghum–teff–Jeldu; FS6=teff–millet–Diga; FS7=maize–sorghum–Diga; RMSE=root mean square error; TLU=tropical livestock unit.
a,b,c,dValues within a row with different superscripts differ significantly at P<0.05.
* TLU using a conversion factor of a mature animal weighing 250 kg (ILCA, 1990).
Farm characteristics, water used in crop residue production, livestock beneficial outputs and LWP by wealth category
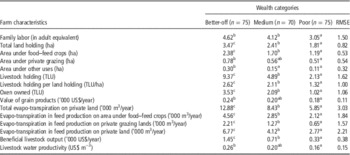
Farm characteristics and LWP for different wealth categories are presented in Table 2. The average family labor per household was higher in better-off and medium wealth categories as compared with poor household categories. The average land holding was higher for households in better-off followed by medium wealth categories. The area under food–feed crop production and area under grazing among wealth categories followed the same pattern as the total land holding. The average livestock and oxen holdings were higher in better-off and medium wealth categories than in the poor household categories. Average livestock holding per unit of land was also higher in better-off than in poor households. The amount of water depleted for feed production, the value of livestock outputs/services and LWP were higher for better-off and medium household categories than for poor household categories (Table 2).
Means of farm resources and livestock water productivity of households in different wealth categories

RMSE=root mean square error; TLU=tropical livestock unit.
a,b,cValues within a row with different superscripts differ significantly at P<0.05.
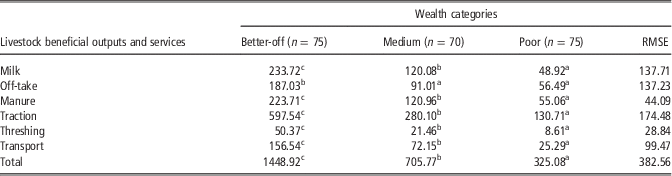
The mean values of major livestock beneficial outputs and services across different wealth categories show that better-off households followed by medium households derived the highest benefits from livestock outputs and services, whereas poor households derived the lowest benefits from livestock outputs and services (Table 3). Among the types of livestock beneficial outputs and services, traction accounted for the largest share of beneficial outputs, regardless of wealth categories.
Means of livestock beneficial outputs and services of households in different wealth categories (US$/year)
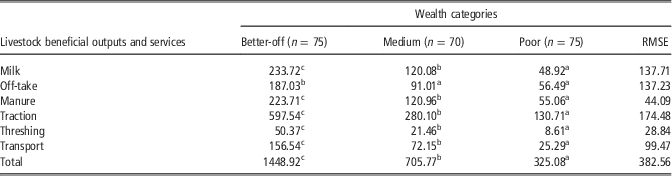
RMSE=root mean square error.
a,b,cValues within a row with different superscripts differ significantly at P<0.05.
Factors explaining LWP
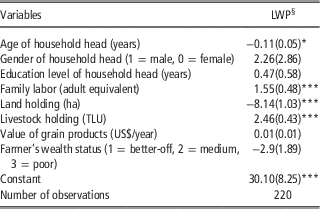
The age of the household head was negatively associated with LWP. The effects of livestock ownership and the size of family labor on LWP were positive, whereas the size of land holding had a negative effect on LWP (Table 4).
Multilevel mixed-effect model estimates of factors explaining variation in livestock water productivity (LWP in US$ m−3)
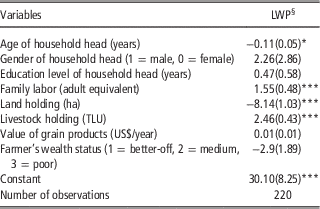
Standard errors in parentheses, *P<0.05, ***P<0.001.
§ LWP was multiplied by a constant number (100) to improve presentation of coefficients.
Discussion and conclusions
Although rainwater plays an important role in crop and livestock production in mixed-crop livestock farming systems, the increasing scarcity of fresh water resources has raised concerns about the conversion efficiency of rainwater into beneficial outputs. Building on previous research on LWP, this study assessed differences in LWP among farming systems and wealth categories and explained variations among individual households based on household characteristics.
The results show significant differences among farming systems in family labor, land holding, total value of grain products, amount of rainwater evapo-transpired in livestock feed production and LWP. Nevertheless, the differences were small. The allocation of area under food–feed crop production and area under grazing in the farming systems followed the same pattern as the total land holding. The difference in LWP among farming systems could be attributed to the difference in the amount of rainwater evapo-transpired in feed production across farming systems. The LWP values found in our analysis were generally low and comparable with the values reported by other researchers (Amede et al., Reference Amede, Geheb and Douthwaite2009a; Peden et al., Reference Peden, Taddesse and Haileslassie2009; van Breugel et al., Reference van Breugel, Herrero, van de Steeg and Peden2010). The LWP values were particularly low in farming systems dominated by barley–potato and maize–sorghum crop mixtures. The observed low LWP values in most farming systems can partly be attributed to the low level of meat and milk production per animal. As a consequence, the water requirements for maintenance, growth and milk production are very high in these systems (van Breugel et al., Reference van Breugel, Herrero, van de Steeg and Peden2010). The low level of LWP reported in the farming systems could also be associated with the widespread land degradation in the Ethiopian highlands (Kato et al., Reference Kato, Ringler, Yesuf and Bryan2011; Alemu and Kidane, Reference Alemu and Kidane2014). Land degradation leads to low grain and crop residue yields and consequently to low livestock beneficial outputs and services and LWP.
The higher LWP under teff–millet- and rice–pulse-based farming systems at Fogera can be attributed to the double cropping practice that exploits the residual moisture after the end of the main rainy season. This practice favors the availability of more crop residues as supplemental feed resources during the dry season, at times when feed supply becomes critical (Alemayehu et al., Reference Alemayehu, Peden, Taddese, Haileselassie and Ayalneh2009).
The variation in LWP among wealth categories can be partly explained by the differences in the ownership of livestock, access to labor and other household assets. As households in better-off and medium wealth categories own more livestock per unit area, they can take advantage of their larger herds to convert available feed from crop residues and grazing lands into higher beneficial outputs such as milk, meat and traction services. The higher beneficial livestock outputs ultimately contribute to higher LWP. This implies that farmers with low livestock numbers cannot efficiently utilize crop residues and feeds from grazing lands. This result corroborates the findings of Haileslassie et al. (Reference Haileslassie, Peden, Gebreselassie, Amede and Descheemaeker2009), who found that most of the beneficial outputs in Ethiopian highlands come from the ownership of higher numbers of livestock. The variation observed in the total beneficial livestock output among wealth categories mirrors the difference in the number of oxen kept by farmers in different wealth categories. The higher livestock beneficial outputs and services among better-off farmers could also be due to the fact that wealthy farmers can afford to keep healthy animals through provisions of better animal healthcare and nutritious feeds for their animals (Peden et al., Reference Peden, Taddesse and Haileslassie2009). The difference in LWP between wealth categories indicates the possibilities to increase LWP with the existing level of knowledge, provided that farmers have better access to important farm resources (e.g. land and traction oxen) and allocate land to crops that use rainwater efficiently. Our findings on LWP are consistent with previous findings that households in better-off and medium wealth categories recorded higher values of total beneficial output and LWP (Haileslassie et al., Reference Haileslassie, Peden, Gebreselassie, Amede and Descheemaeker2009).
Although water use in communal grazing land was not included in our analysis, because of difficulties in accurately estimating the areas under communal grazing and their corresponding water use, we suspect that the variation in LWP among farming systems and wealth categories could partly be explained by feed from communal grazing lands. For example, Fogera district has relatively more communal grazing lands, which gives farmers more feed from communal grazing, and thus higher LWP. Similarly, richer farmers with higher number of livestock may have better grazing opportunities on communal grazing lands than farmers with lower number of livestock. Higher values of total grain products for poor households could be a reflection of the fact that better-off farmers allocate relatively more land to private grazing for livestock grazing compared with poor households. It could also be a reflection of price differences in the type of crops grown by farmers in different wealth categories.
Increasing LWP involves increasing the efficiency of feed utilization by the animals and increasing the efficiency of water use in feed production through improved rainwater management practices. Among the determinants of LWP, the positive relationship between family labor and LWP is plausible, given that the bulk of labor for most farm operations in this region is provided by the family rather than by hired labor. Family labor takes great importance, given that low income constrains hiring of wage laborers (Asfaw et al., Reference Asfaw, Shiferaw, Simtowe and Haile2011). The positive association of livestock holdings with LWP is a reflection of the high volume of beneficial outputs and services derived from ownership of large numbers of animals. The positive association of livestock holdings with LWP particularly relates to the fact that livestock provide replacement oxen, which allow timely preparation of land for crop production. Livestock also provide manure for soil fertility replenishment (Herrero et al., Reference Herrero, Grace, Njuki, Johnson, Enahoro, Silvestri and Rufino2013). The positive association of individual households’ livestock ownership with LWP suggests that farmers with fewer animals are at a disadvantage and that increased numbers of livestock will, thus, most likely lead to greater LWP in the short term. However, there is a limit: keeping large numbers of animals on limited natural resource base will result in overexploitation of natural resources through excessive removal of vegetation through grazing. Likewise, allocation of higher amounts of crop residue to livestock feed exerts a competitive pressure on alternative uses of crop residues such as for soil mulching, roofing and fuel (Williams et al., Reference Williams, Hiernaux and Fernandez-Rivera2000; Giller et al., Reference Giller, Corbeels, Nyamangara, Triomphe, Affholder, Scopel and Tittonell2011b). Alternatively, high volumes of beneficial outputs and services can be achieved by keeping few productive animals, improved feeding and better healthcare. Therefore, it is important that strategies to improve LWP focus on sustainable intensification of crop livestock production systems. Sustainable intensification implies that greater production must be achieved by increasing yields of a few animals while using fewer resources.
An increase in the age of the household head was negatively associated with LWP. The negative association of increasing age with LWP supports our research hypothesis that older farmers may not have the physical strength to implement labor-intensive farm operations that would increase productivity. Contrary to expectations, the size of land holding was negatively associated with LWP. A possible explanation for negative association of land holding size with LWP might be that large farms had to spread limited resources sparsely to a large area of land, which led to less efficient use of water management practices. The insignificant coefficients for wealth category suggest that controlling for land and livestock holdings are strongly correlated with the wealth status of the household head, wealth category alone has no independent effects on LWP.
The positive relationship between LWP and livestock holding suggests that water use efficiency in livestock production can be achieved by increasing livestock beneficial outputs. The positive association of farm labor with LWP and the negative association of land holding size with LWP suggest that strategies for improving water use efficiency in production of livestock need to pay attention to the use of land saving and labor-intensive agricultural technologies. The results suggest that water use efficiency can be improved by alleviating resource constraints such as access to farm labor and livestock assets, oxen in particular. The findings of this research help in making decisions about where to invest scarce resources in order to improve water use efficiency in livestock production under rain-fed conditions.
Acknowledgments
This study was financed by Nile Basin Development Challenge Project of the CGIAR Challenge Program on Water and Food (CPWF) through the International Livestock Research Institute (ILRI) and Dutch Ministry of Economic Affairs. The authors are grateful to participants of the questionnaire interview for providing valuable information and data collectors for skillfully administering the questionnaire. Authors gratefully acknowledge Bedassa Eba and Ayele Abebe for designing and administering the questionnaire survey in the field. The authors thank Gerba Leta and Abera Adie for their excellent research assistance. The authors are grateful for constructive comments given by Douglas J. Merry on early version of the paper. The authors gratefully acknowledge Bas Engel for the help and guidance on the statistical analysis.
Supplementary material
To view supplementary material for this article, please visit http://dx.doi.org/10.1017/S1751731114003115