I. INTRODUCTION
In recent years, light-emitting diodes (LEDs) have attracted considerable interest owing to their superior properties such as high efficiency, low-voltage driving, long lifetime, great reliability, and environmental friendliness. Reference Schubert and Kim1–Reference Pimputkar, Speck, DenBaars, Nakamura and Nakamura3 Most commercially available white LEDs are fabricated by combining blue-emitting LED chips (440–470 nm) with YAG:Ce3+ yellow-emitting phosphor materials, but they show drawbacks of low color rendering index (CRI < 75) and high correlated color temperature (CCT > 4500 K) due to lack of red component in the spectral region. Reference Xie and Hirosaki4–Reference Xie and Hintzen6 However, this issue can be improved by a slight addition of red-emitting phosphors with high luminescent efficiency to YAG:Ce3+. Reference Xie, Hirosaki, Kimura, Sakuma and Mitomo7 To this end, great efforts have been made to exploit novel red phosphors, and the most successful materials are rare-earth-doped (oxy)nitride compounds. Most currently, red-emitting nitride phosphors include M2Si5N8:Eu2+ (M = Ca, Sr, Ba), Reference Piao, Horikawa, Hanzawa and Machida8–Reference Wang, Zheng, Liu, Chen, Bian and Liu14 CaAlSiN3:Eu2+, Reference Uheda, Hirosaki and Yamamoto15–Reference Suehiro, Xie and Hirosaki21 and Sr[LiAl3N4]:Eu2+. Reference Pust, Weiler, Hecht, Tücks, Wochnik, Henß, Wiechert, Scheu, Schmidt and Schnick22 Among them, CaAlSiN3:Eu2+ red-emitting phosphor materials have received great attention for excellent color rendition (CRI > 90) white LED because of many favorable luminescent properties, such as high quantum efficiency, excellent thermal property, and chemical stability.
Despite these significant advantages, it is also found that the emission peaks of CaAlSiN3:Eu2+ are mostly beyond 650 nm and can hardly meet the required wavelengths (about 620 nm) of high luminous efficiency white LEDs due to effects of relatively sensitive function of human visual system. An effective choice is to develop cationic/anionic substitution method to modify the photoluminescence properties of the phosphors. A notable example is YAG:Ce3+ phosphors that the emission band can be blue or red shifted by partial replacement of Al with Ga or of Y with Gd. Systematic substitutional effects on the photoluminescence by substituting AlO+ for SiN+ in the M2Si5N8 family to create M2Si5−x Al x N8−x O x have also been reported. Reference Wang, Zheng, Liu, Chen, Bian and Liu14 As for CaAlSiN3 family, Watanabe and Kijima Reference Watanabe and Kijima23 have introduced Sr2+ to replace Ca2+ under an unapproachable pressure of 190 MPa to expand the crystal lattice and weaken the crystal field strength around Eu2+, leading to the blueshift of emission maxima from 650 to 610 nm. Wang et al. Reference Wang, Yang, Mo, Bian, Song and Liu24 have demonstrated that emission peaks of CaAlSiN3-type phosphors can be tuned from 650 to 610 nm by oxygen substitutions for nitrogen at the sacrifice of quantum efficiency. Consequently, new methods should be developed to realize the blue-shift emission.
On the other hand, common preparation for CaAlSiN3:Eu2+ phosphors was limited due to expensive and air-sensitive raw materials, e.g., Ca3N2 and EuN. Traditional solid-state reaction with a powder mixture of Ca3N2, EuN, AlN, and Si3N4 as raw materials required critical conditions of high temperature up to 1800 °C and high pressure more than 0.9 MPa to produce high quality powders with good crystallinity. Reference Uheda, Hirosaki and Yamamoto15 As an alternative, CaAlSiN3:Eu2+ was synthesized via self-propagating high-temperature synthesis with (Ca, Eu)AlSi alloy in a radio-frequency furnace. Reference Piao, Machida, Horikawa, Hanzawa, Shimomura and Kijima17 However, the evaporation of Ca and Al metals during the arc-melting led to difficulty in exact control of the product performance. Li et al. Reference Li, Watanabe, Wada, Setoyama and Yoshimura16 reported the synthesis of CaAlSiN3:Eu2+ by nitridation of (Ca, Eu) AlSi alloy in supercritical ammonia (100 MPa) with low yield. Recently, Suehiro et al. Reference Suehiro, Xie and Hirosaki21 reported the synthesis of CaAlSiN3:Eu2+ by gas reduction nitridation method with CaO–Al2O3–SiO2 at the narrow temperature range of 1365–1375 °C, leading to insufficient nitridation reaction due to low eutectic melting of the reaction system. To overcome the challenges of the aforementioned preparation processes, carbothermal reduction and nitridation (CTRN) method with stable and common CaCO3 as Ca source has been successfully applied for the facile synthesis of CaAlSiN3:Eu2+ in our previous research. Reference Li, Peng, Liu and Huang25 Besides, AlN-like secondary phase was always formed according to the stoichiometric composition with a Ca/Al/Si molar ratio of 1:1:1 to prepare CaAlSiN3-based red-emitting phosphors even at high temperature and pressure because of the low solubility of Al in CaAlSiN3. Li et al. Reference Li, Hirosaki, Xie, Takeda and Mitomo18 proposed a formula of CaAl1−4δ/3Si1+δN3 (δ ≈ 0.3–0.4) with an Al/Si molar ratio of about 1:2 instead of the ideal 1:1 according to bond valence sum calculations of CaAlSiN3. However, the optimal δ value remains unclear till now.
In this present research, the CTRN method is applied to synthesize CaAl1−4δ/3Si1+δN3:Eu2+ (δ = 0–0.36) series red-emitting phosphors. The influences of Si/Al molar ratio on phase compositions and the emission spectra are reported in detail. The emission spectra have been blue shifted by increasing the Si/Al molar ratio. The origin of the two Gaussian components that constitute the emission spectra has been identified. Active site-to-site energy transfer mechanism from the Eu2+ activator sites in the Si-rich environments to those in the Si/Al-equivalent environments has been clarified by examining the time-resolved photoluminescence (TRPL) and decay curves. At the same time, warm white LEDs with high color rendition have been fabricated by the addition of as-prepared red-emitting phosphors.
II. EXPERIMENTAL
Nominal compositions of Ca0.98Eu0.02Al1−4δ/3Si1+δN3 (δ = 0–0.36) red-emitting phosphors were successfully prepared from CaCO3 (99.99%), AlN (Tokuyama, H-Grade), α-Si3N4 (UBE, E-10), Eu2O3 (99.99%), and C powder (99.95%). Excess carbon as a reducing agent in a C/O ratio of 1.5:1 was added to ensure the reduction of CaO (CaCO3 was decomposed completely into CaO at high temperature) and Eu2O3 to achieve a low oxygen content in the final products. Approximately 6.2 g of raw powders were thoroughly mixed and loaded into a molybdenum boat (length = 55 mm, width = 35 mm, depth of the powder bed ≈ 7 mm) in a horizontal tube furnace (inner diameter of 60 mm) for two-step heating after the vacuuming process, which was first carried out to the degree of −0.1 MPa, then repeated the process for another two times after filling the tube cavity with pure nitrogen. First, the mixture was heated in N2 with a constant flow rate of 200 mL min−1 at 850 °C for 1 h to decompose CaCO3 completely. Then, the temperature was increased to 1600 °C and maintained for 4 h in 200 mL min−1 N2–20 mL min−1 H2 gas mixture to form the nitrides and complete the reduction of Eu3+ to Eu2+. After that, the fired samples were ground finely for measurements. It is unnecessary to remove residual unreacted carbon by post heat-treatment because the carbon content keeps below 0.5 wt% for the as-prepared products.
The phase compositions were determined by x-ray diffraction (XRD, Bruker D8 Advanced, Bruker AXS GMBH, Beijing, China) with Cu Kα1 radiation (λ = 0.15406 nm) at 40 kV and 40 mA. A step size of 0.02° was used with a scan speed of 5°/min. The lattice parameters were obtained by refining XRD patterns using software package of Fullprof Suite. The cationic compositions of the samples were analyzed by inductively coupled plasma atomic emission spectrometry (ICP-AES, Vista AX, Varian). The nitrogen and oxygen contents of the synthesized powders were determined by O and N analyzers (TC600C, LECO Instrument LD), and the impurity carbon contents were performed using a C measurement device (SICMMC-222), respectively. The photoluminescence spectra and quantum yield were measured by a fluorescence spectrophotometer (Jobin Yvon, Fluoromax-4, Horiba Jobin Yvon, Paris, France) with a 150 W Xe lamp. The quantum efficiency was estimated using an integrating sphere unit (Jobin Yvon, F-3029) with a monochromatic source of 460 nm. The TRPL spectra and decay curves at room temperature were measured using an Edinburgh FLS980 Fluorescence Spectrophotometer with an excitation wave length of 460 nm. The optical properties of the as-fabricated white LEDs were investigated by a UV–VIS-near IR Spectrophotocolorimeter (PMS-80) with an output power of 1 W at room temperature.
III. RESULTS AND DISCUSSION
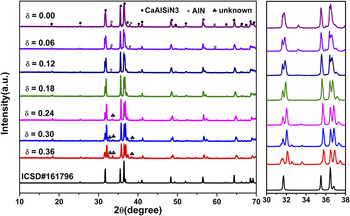
Figure 1 shows the typical XRD patterns of as-prepared Ca0.98Eu0.02Al1−4δ/3Si1+δN3 (δ = 0–0.36) powders. Samples exhibit various phase compositions for different δ values. In the range of 0 ≤ δ ≤ 0.12, besides CaAlSiN3 main phase (ICSD#161796 for CaAl0.54Si1.38N3), Reference Li, Watanabe, Wada, Setoyama and Yoshimura16 there exists minor unreacted AlN phase. The content of AlN decreases with increasing δ value. However, an unknown phase appears for 0.24 ≤ δ ≤ 0.36. The study in progress suggests that the unknown phase is a Si-rich compound, and the result will be the subject of another publication. By contrast, no clear secondary phase is detected for the sample at δ = 0.18. Nevertheless, the XRD peaks splitting around 32° and 37.5° with increasing δ value indicate that the structure is substantially distorted from the structure of CaAlSiN3. According to the JCPDS card 39-0747, the samples are considered to be a solid solution of CaAlSiN3 and Si2N2O. Reference Uheda, Yamamoto, Yamane, Inami, Tsuda, Yamamoto and Hirosaki26–Reference Shen, Zhuang, Liu, He and He28 Additionally, the severer peaks splitting with increasing δ value probably imply a tiny higher concentration of Si2N2O content in CaAlSiN3–Si2N2O solid solution.
XRD patterns of Ca0.98Eu0.02Al1−4δ/3Si1+δN3 (δ = 0–0.36) phosphors with various δ values.

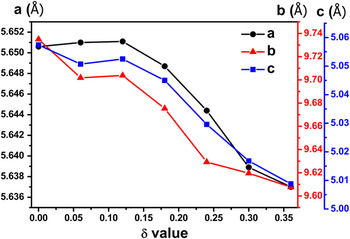
Figure 2 displays lattice parameters of a, b, and c with different δ values. The lattice parameters become significantly small with increasing δ value because of the shrinkage of host lattice caused by the short Si–N (1.65–1.75 Å) instead of long Al–N (1.75–1.85 Å). Reference Li, Hirosaki, Xie, Takeda and Mitomo18 On the other hand, the linear relationship between lattice parameters and δ values is observed with 0.12 ≤ δ ≤ 0.24, implying that it is more favorable to obtain CaAlSiN3-based phase without impurities in the region of 0.12 ≤ δ ≤ 0.24.
Lattice parameters of Ca0.98Eu0.02Al1−4δ/3Si1+δN3 (δ = 0–0.36) phosphors with various δ values.

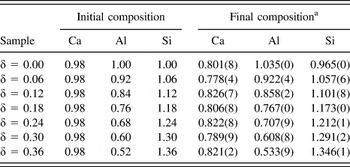
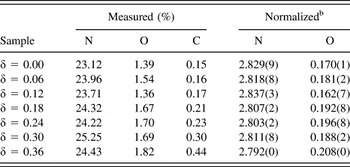
Table I shows the analyzed cationic ratios of synthesized samples by ICP-AES for different nominal compositions. A Ca deficiency of about 20% is observed. It means that some amount of Ca component is evaporated at high temperature. Obviously, the charge imbalance caused by Ca2+ ion vacancy V Ca is compensated by introduction of the substitutional oxygen ON. The quantity ratios of Al and Si in the product largely coincide with the initial values. As presented in Table II, the mass fractions of N, O, and C in the as-prepared products rise a little because the formula weight of Ca0.98Eu0.02Al1−4δ/3Si1+δN3 decreases with increasing δ value. In addition, the very tiny increase of Si2N2O content in CaAlSiN3–Si2N2O solid solution for rising δ value may also partially account for the small increment of O and C contents.
Analyzed cationic ratios of synthesized samples with different nominal compositions.

a Normalized against the total Al + Si = 2−δ/3.
Measured mass fractions of N, O, and C and normalized N/O ratios of synthesized samples with different nominal compositions.
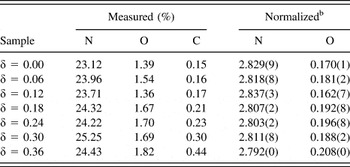
b Normalized against the total N + O = 3.
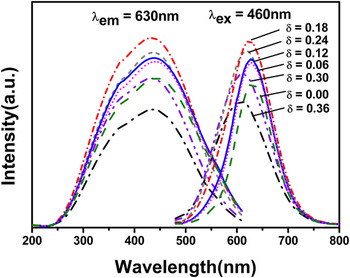
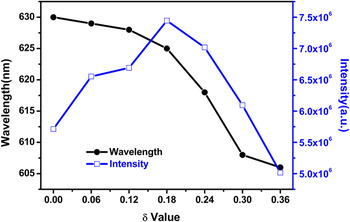
Figure 3 presents the photoluminescence spectra of Ca0.98Eu0.02Al1−4δ/3Si1+δN3 (δ = 0–0.36) phosphors. Obviously, all the samples display a broad absorption band from near-UV to yellow region (250–600 nm). Under the excitation of 460 nm, an intense red emission can be observed, which is attributed to the allowed 4f 65d 1 → 4f 7 transition of Eu2+ ions. The peaks of emission spectra gradually shift from 630 to 606 nm with δ value increasing from 0 to 0.36 despite the lattice contraction as shown in Fig. 4. It might suggest that the photoluminescence property is significantly correlated with the local environment of activators, which will be discussed in the following part. The luminescence intensity reaches the maximum at a δ value of 0.18 with external quantum efficiency up to 71% as a result of the higher phase purity, and the full width at half maximum (FWHM) is around 100 nm, which is close to the values (∼88–105 nm) synthesized by other methods. Additionally, the emission intensity of Ca0.98Eu0.02Al0.76Si1.18N3 phosphor at 250 °C remains 91% in comparison with the intensity at room temperature, suggesting low quenching property.
Photoluminescence spectra of Ca0.98Eu0.02Al1−4δ/3Si1+δN3 (δ = 0–0.36) phosphors with various δ values.

Dependence of peak emission intensity and wave length on the δ value.

Although the existence of Si2N2O will contribute to the blueshift in emission, Reference Shen, Zhuang, Liu, He and He28 the O contents suggest that there is extremely small concentration difference of Si2N2O for δ values from 0 to 0.36. Actually, the big changes of Al/Si contents for different δ values are mainly responsible for the blueshift from 630 to 606 nm. The observed blueshift in emission with higher Si/Al molar ratio can be elucidated from the variable covalence of the Eu2+ activator accommodation controlled by neighboring cations. Reference Wang, Chen, Li, Wang, Sheu and Liu29 The Ca2+ cation is surrounded by coordinated nitrides that also have other branches connecting with neighboring cations, e.g., Si4+, Al3+, and outer Ca2+ cations. The neighboring Al3+ cation at the second shell is substituted by Si4+ with increasing δ, creating Si-rich instead of Si/Al-equivalent environment. In the case of δ = 0, Si-rich environments still exist because of the low solution of Al in CaAlSiN3. The nitride anion connecting with a Si4+ cation would introduce more covalence than with an Al3+ cation, reflecting that the binding strength of Si–N is stronger than that of Al–N, therefore, gaining a longer and looser Ca–N. As the Eu2+ activator is introduced, it would preferably be accommodated at the looser Ca2+ site to minimize the lattice strain because the Eu2+ cation is larger than the Ca2+ cation. Thus, the covalent character and crystal field strength of the Eu2+ accommodations in Si-rich environment are weaker compared with Si/Al-equivalent environments. At the same time, Si-rich environments progressively increase with δ value, leading to the corresponding blue-shift emission.
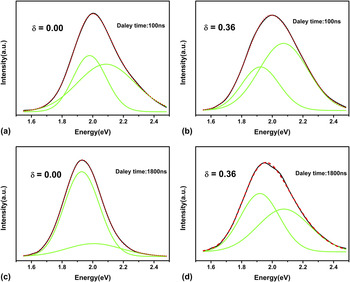
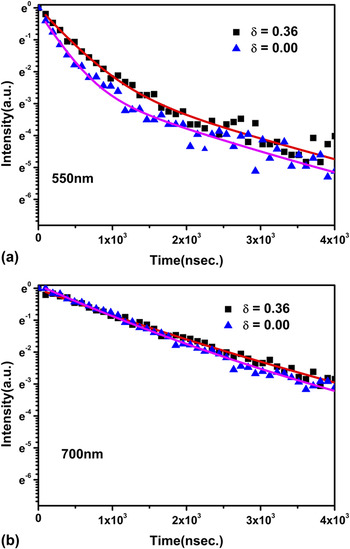
TRPL spectra with fitted Gaussian deconvolution of Ca0.98Eu0.02Al1−4δ/3Si1+δN3 for δ = 0 and 0.36 at two different delay times (100 and 1800 ns) are shown in Fig. 5. The emission spectra comprise two distinct emission peaks originating from Si-rich and Si/Al-equivalent environments, Reference Jung, Lee, Singh and Sohn30 respectively. The Eu2+ ions in Si-rich environments generate high-energy emission while those in Si/Al-equivalent environments lead to low-energy component. The high-energy component decreases gradually with an extension of delay time from 100 to 1800 ns. This is ascribed to the brisk energy transfer from Eu2+ ions in Si-rich environments to those in Si/Al-equivalent environments. In particular, for δ = 0, the high-energy component almost disappears at the delay time of 1800 ns. By contrast, the high-energy component decreases only a little for δ = 0.36. In the host of δ = 0.36 with more Si4+ ions, more Eu2+ ions locate at the sites with Si-rich modes and less Eu2+ ions in Si/Al-equivalent environments. The formation of more Si-rich and less Si/Al-equivalent coordinated modes leads to a lowered chance for the energy transfer and results in a small decrease of high energy component eventually. This can be verified from the decay curves for δ = 0 and 0.36 detected at 550 and 700 nm, as depicted in Fig. 6. The decay curves monitored at 550 and 700 nm stand for the decay behavior of high energy (Si-rich environment) and low energy (Si/Al-equivalent environment) components, respectively. Both of the decay curves monitored at 550 nm show nonexponential form in Fig. 6(a), which is a typical sign of energy transfer. Reference Kulshreshtha, Kwak, Park and Sohn31,Reference Wang, Zheng, Liu, Chen, Yang and Liu32 The decay curves suggest that the lifetime of Eu2+ activators for δ = 0 is a little shorter than that for δ = 0.36. It is confirmed that the site-to-site energy transfer occurs more strongly for δ = 0 than for δ = 0.36. By contrast, the decay curves monitored at 700 nm exhibit almost coincident single-exponential decay lines, which means that the low energy components (Si/Al-equivalent environment) for δ = 0 and 0.36 have the same decay rate. Both curves originate from the radiative decay of Eu2+ activators in Si/Al-equivalent environments. For the reason that the energy transfer never occurs between Eu2+ ions both in Si/Al-equivalent environments, the decay curve can be regarded as the typical radiative decay for Eu2+ ions accommodated in Si/Al-equivalent environments.
TRPL spectra with fitted Gaussian deconvolution of Ca0.98Eu0.02Al1−4δ/3Si1+δN3 for δ = 0 (a and c) and 0.36 (b and d).

Decay curves monitored at (a) 550 nm and (b) 700 nm for Ca0.98Eu0.02Al1−4δ/3Si1+δN3 with δ = 0 and 0.36.

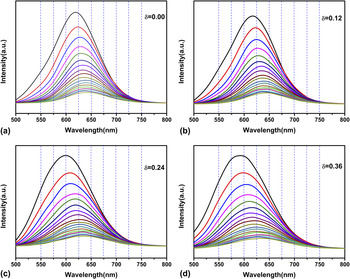
Figure 7 shows the TRPL spectra of Ca0.98Eu0.02Al1−4δ/3Si1+δN3 with δ = 0–0.36. For all δ values, the energy transfer occurs sequentially from the high energy Eu2+ ions in the Si-rich environments to the low-energy Eu2+ ions in the Si/Al-equivalent environments and leads to the decline of high-energy emission and the simultaneous increasing of low-energy emission. The active energy transfer eventually controls the final spectral distribution.
TRPL spectra of Ca0.98Eu0.02Al1−4δ/3Si1+δN3 with δ = 0–0.36. The different colors represent different delay times for the TRPL curves, i.e., the black curve was acquired at a delay time of 100 ns, red at 200 ns, blue at 300 ns, and so on.

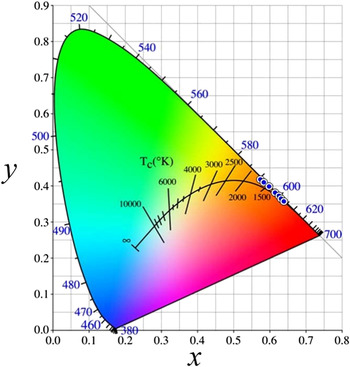
Commission Internationale de l’Eclairage (CIE) chromaticity coordinates for Ca0.98Eu0.02Al1−4δ/3Si1+δN3 (δ = 0–0.36) are presented in Fig. 8. With increasing δ value, the chromaticity coordinates (x, y) of the phosphors vary systematically from (0.64, 0.36) to (0.58, 0.42), and the corresponding color tone changes gradually from orange-red to orange-yellow, which can meet the requirements for varying applications of white LEDs, such as desired color temperature and color point, as well as high luminous efficiency.
CIE chromaticity diagram for Ca0.98Eu0.02Al1−4δ/3Si1+δN3 (δ = 0–0.36) phosphors excited at 460 nm.

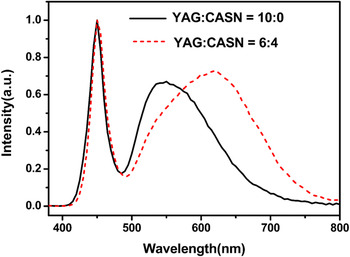
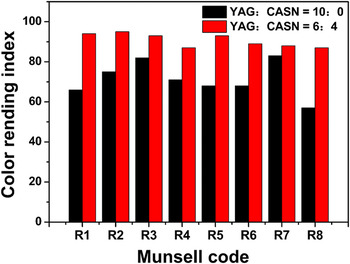
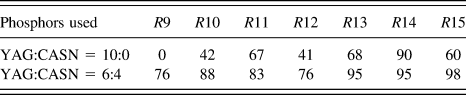
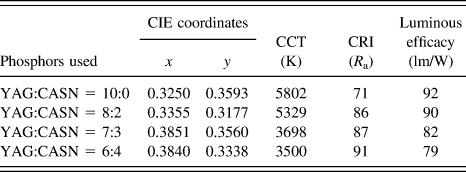
White LED lamps were fabricated by combining blue LED chips (450 nm) with YAG:Ce3+ yellow-emitting phosphors or a blend of YAG:Ce3+ and as-prepared Ca0.98Eu0.02Al0.76Si1.18N3 phosphors. Figure 9 illustrates the electroluminescence spectra of the fabricated white LED lamps. By addition of the Ca0.98Eu0.02Al0.76Si1.18N3 red-emitting phosphors, the red emission intensity around 650 nm is greatly improved and the FWHM of the emission spectrum expands obviously from ∼120 to ∼170 nm. Figure 10 displays the CRI values from R1 to R8 for white LED lamps fabricated by using only YAG:Ce3+ or a blend of YAG:Ce3+ and as-prepared Ca0.98Eu0.02Al0.76Si1.18N3 phosphors. The general CRI value is designated by the symbol R a, which is the average value of R1–R8. In comparison with the YAG:Ce3+-based white LED, the white LED with addition of as-prepared red-emitting phosphor has higher values of R1–R8. The special CRI values from R9 to R15 are shown in Table III, which are not evaluated in calculating the general CRI value. We can see that all these CRI values increase a lot by adding as-prepared red-emitting phosphors to YAG:Ce3+ yellow-emitting phosphors, which mean that the color of the objects can be precisely reproduced. Table IV summarizes the chromaticity coordinates, the CCTs, the general CRI values, and the luminous efficacies of the fabricated lamps with different mass ratios of YAG:Ce3+ yellow-emitting and Ca0.98Eu0.02Al0.76Si1.18N3 red-emitting phosphors. With the proportion of the red-emitting phosphor rising, the general CRI of the fabricated white LEDs increases from 71 to 91. At the same time, the CCT decreases from 5802 to 3500 K. The corresponding luminous efficacies drop slightly due to the self-absorption of yellow light by Ca0.98Eu0.02Al0.76Si1.18N3 red-emitting phosphor and the reduction of lumen equivalent caused by peak wave length position shifting from about 550 to 630 nm. Reference Wang, Zhou, Zhang, Li, Zhang and Sun33
Normalized electroluminescence spectra of the white LEDs fabricated by using YAG:Ce3+ or YAG:Ce3+ and as-prepared Ca0.98Eu0.02Al0.76Si1.18N3 red-emitting phosphors combined with blue LED chips (450 nm).

CRI values from R1–R8 for white LED lamps fabricated by using YAG:Ce3+ or blend of YAG:Ce3+ and as-prepared Ca0.98Eu0.02Al0.76Si1.18N3 red-emitting phosphors combined with blue LED chips (450 nm).

Special CRI values from R9 to R15 of the as-fabricated white LED lamps.

Optical characteristics of white LEDs with different YAG/CASN ratios.

YAG refers to YAG:Ce3+ and CASN refers to Ca0.98Eu0.02Al0.76Si1.18N3.
IV. CONCLUSIONS
In summary, the nominal compositions of Ca0.98Eu0.02Al1−4δ/3Si1+δN3(δ = 0–0.36)phosphors were synthesized by facile CTRN using stable and low-cost CaCO3 as Ca source. The CaAlSiN3-based phase without clear impurities was formed at a δ value of 0.18 with an external quantum efficiency of 71%. Blueshift emission was realized with increasing Si/Al molar ratio. There exist Si-rich and Si/Al-equivalent coordinated environments for Eu2+ ions in Ca0.98Eu0.02Al1−4δ/3Si1+δN3 phosphors. Energy transfer from high-energy component (Si-rich environment) to low-energy component (Si/Al-equivalent environment) has been confirmed by examining TRPL. The decay behaviors suggested that the energy transfer effect slowed with higher δ value. When combining a blend of YAG:Ce3+and as-prepared Ca0.98Eu0.02Al0.76Si1.18N3 phosphors with a blue-emitting LED chip, warm white light LED can be generated with the general CRI of 91 at a low CCT of 3500 K.
ACKNOWLEDGMENTS
The authors are very grateful to the financial support from the National Natural Science Fund of China (No. 51172263, No. 51472087, and No. 11275249) and Shanghai Municipal Natural Science Foundation (No. 13ZR1412500).