1 Introduction
Mixed convection is the process whereby heat and momentum are transferred under the concurrent effect of friction and buoyancy, and it is at the heart of several physical phenomena of great practical importance; for instance, in the engineering design of heat exchangers and in the dynamics of atmospheric flows. Flow stratification may be either of stable type (i.e. the higher layers are hotter than the lower), or unstable type (i.e. lower layers are heated). In the former case, stratification suppresses the vertical motions, thus mitigating friction and heat transfer. In contrast, unstable stratification promotes turbulent exchanges with obvious opposite effects. Although the two extreme cases of pure forced convection (classical boundary layers and channel flows) and of free convection (Rayleigh–Bénard flow) have been extensively studied analytically, experimentally and numerically, their combination appears to be much less understood. The current engineering practice (Kays, Crawford & Weigand Reference Kays, Crawford and Weigand1980; Bergman et al. Reference Bergman, Lavine, Incropera and DeWitt2011) for heat transfer prediction in the presence of mixed convection mainly relies on correlations developed for either free or forced convection, and applied according to the value of a global Richardson number, which grossly weights the effect of bulk buoyancy with respect to friction. However, combination of the two effects can give rise to flow patterns which are not observed in any of the two extreme cases. In the context of atmospheric flows it is well known that in the presence of unstable stratification large streamwise-oriented rollers may form (Avsec Reference Avsec1937; Hill Reference Hill1968; Brown Reference Brown1980; Young et al. Reference Young, Kristovich, Hjelmfelt and Foster2002; Stull Reference Stull2012), whose typical signature are aligned streets of cumulus clouds (Mal Reference Mal1930; Kuettner Reference Kuettner1959, Reference Kuettner1971), and which have been occasionally claimed to be responsible for striped patterns in desert sand dunes (Hanna Reference Hanna1969), and for the occurrence of long rows of unburned tree crowns in forest fires (Haines Reference Haines1982). Wavy perturbations of the ordered pattern of convective rolls have also been frequently observed (Avsec & Luntz Reference Avsec and Luntz1937), and interpreted as the result of secondary instabilities (Clever & Busse Reference Clever and Busse1991, Reference Clever and Busse1992). Laboratory confirmation for the presence of rollers in unstable mixed convection came from the experiments of Mizushina, Ogino & Katada (Reference Mizushina, Ogino and Katada1982), Fukui & Nakajima (Reference Fukui and Nakajima1985), Fukui, Nakajima & Ueda (Reference Fukui, Nakajima and Ueda1991), which also showed that they play a major role in momentum and heat transfer.
It is no surprise that most numerical studies of mixed convection to date stem from the atmospheric science community, hence they necessarily rely on turbulence modelling through large-eddy simulation (LES) to cope with the involved huge Reynolds numbers (
 $Re$
), and incorporate the important effects of rotation, and/or surface roughness (see, e.g. Deardorff Reference Deardorff1972; Khanna & Brasseur Reference Khanna and Brasseur1997; Esau et al.
Reference Esau, Davy, Outten, Tyuryakov and Zilitinkevich2013; Park & Baik Reference Park and Baik2014).
In order to isolate the effects of the interaction between friction and buoyancy, in this paper we operate in a simplified setting, whereby: (i) the effects of rotation and surface roughness are simultaneously removed; (ii) the internal flow in a planar channel is considered, with significant simplification with respect to considering the atmospheric boundary layer; (iii) we limit ourselves to the modest Reynolds numbers which can be currently achieved through direct numerical simulation (DNS). Hence, is all respects the present exercise may be regarded as a hybrid between canonical pressure-driven channel flow and Rayleigh–Bénard flow. All these approximations are certainly reasonable in the context of flows of engineering importance, whereas direct extrapolation of the results hereafter presented to the domain of atmospheric flows is not granted. Despite being limited in the range of attainable flow parameters, DNS does rule out some of the uncertainties incurred in higher-level techniques, especially as far as universality assumptions for the treatment of the near-wall region go.
Flow in a planar channel is probably the most prototypical wall-bounded shear flow, and it has been extensively studied through DNS to shed light on several important facets of wall turbulence structure. In particular, recent numerical studies have highlighted deviations from the alleged universal behaviour of wall turbulence associated with high-
 $Re$
effects (Bernardini, Pirozzoli & Orlandi Reference Bernardini, Pirozzoli and Orlandi2014; Lee & Moser Reference Lee and Moser2015). DNS studies have also addressed the behaviour of passive scalars transported by the fluid phase, which serve to model dispersion of dilute contaminants as well as turbulent thermal transport under the assumption of small temperature differences. The latest studies (Pirozzoli, Bernardini & Orlandi Reference Pirozzoli, Bernardini and Orlandi2016) have achieved friction Reynolds number
 $Re_{\unicode[STIX]{x1D70F}}\approx 4000$
(here
 $Re_{\unicode[STIX]{x1D70F}}=u_{\unicode[STIX]{x1D70F}}h/\unicode[STIX]{x1D708}$
, where
 $h$
is the channel half-height,
 $u_{\unicode[STIX]{x1D70F}}$
is the friction velocity, and
 $\unicode[STIX]{x1D708}$
is the fluid kinematic viscosity), hence making it possible to establish the presence of a generalized logarithmic layer for the mean scalar profiles, although with a slightly different set of constants than those of the streamwise velocity. Classical predictive formulae for heat transfer based on the log law (Kader Reference Kader1981) are found to work quite well, with suitable choice of the constants, a possible explanation being the expected shape of the heat-flux co-spectrum (Katul et al.
Reference Katul, Li, Chamecki and Bou-Zeid2013).
At the opposite end of the family of flows under scrutiny is the Rayleigh–Bénard flow, corresponding to free convection between isothermal walls, which has also been extensively studied, both experimentally and numerically, mainly in cylindrical confined configurations (Ahlers, Grossmann & Lohse Reference Ahlers, Grossmann and Lohse2009). Rayleigh numbers (
 $Ra$
) up to
 $10^{15}$
have been reached experimentally (Niemela et al.
Reference Niemela, Skrbek, Sreenivasan and Donnelly2000; Ahlers et al.
Reference Ahlers, He, Funfschilling and Bodenschatz2012) while fully resolved numerical simulations are behind at
 $Ra=2\times 10^{12}$
(Stevens, Lohse & Verzicco Reference Stevens, Lohse and Verzicco2011); around
 $Ra=10^{14}$
the boundary layers adjacent to the heated plates become turbulent, and a transition to a state of ultimate convection is expected, marking a change from the classical behaviour of the Nusselt number,
 $Nu\sim Ra^{1/3}$
, to a steeper
 ${\sim}Ra^{(1/2)}/\ln (Ra^{3/2})$
(
 $\simeq Ra^{0.38}$
at
 $Ra=10^{14}$
). Attempts are ongoing to push the Rayleigh number of the simulations beyond
 $Ra=2\times 10^{12}$
since the experimental evidence in the ultimate regime is not unanimous and reliable numerical simulations would help solving the controversy. Pure Rayleigh–Bénard flow in planar geometry has to date received less attention, probably because of the lack of matching experimental data, and uncertainties related to potential dependence on the wall-parallel computational box size (Hamman & Moin Reference Hamman and Moin2015), the most notable example dating back to Kerr (Reference Kerr1996). Recent numerical simulations of Rayleigh–Bénard flow in planar geometry in the presence of wall roughness and including the effect of finite thermal conduction at the walls have been carried out by Orlandi, Pirozzoli & Bernardini (Reference Orlandi, Pirozzoli and Bernardini2015b
).
Numerical simulations and experiments of mixed convection in internal flows have been relatively infrequent so far. Channel flows with stable temperature stratification have received some attention in recent years, with important contributions from DNS delivered by Armenio & Sarkar (Reference Armenio and Sarkar2002), Garcia-Villalba & del Álamo (Reference Garcia-Villalba and del Álamo2011), leading to the conclusion that flow relaminarization in the channel core may be achieved depending on the value of the bulk Richardson number. However, as pointed out by Garcia-Villalba & del Álamo (Reference Garcia-Villalba and del Álamo2011), this effect sensitively depends on the size of the computational box, and extremely large domains are required to achieve box-independent results, even for the lowest-order statistics. Flows with unstable stratification were first studied through DNS by Domaradzki & Metcalfe (Reference Domaradzki and Metcalfe1988), who observed the formation of longitudinal rollers in stratified Couette flow between sliding plates. Iida & Kasagi (Reference Iida and Kasagi1997) carried out numerical simulations of plane channel flows with unstable stratification at low bulk Richardson numbers (
 $Ri_{b}\leqslant 0.3$
) and low Reynolds number (
 $Re_{\unicode[STIX]{x1D70F}}=150$
), finding a steady increase of the heat transfer coefficient with
 $Ri_{b}$
, whereas (quite interestingly) the friction coefficient was found to slightly decrease up to
 $Ri_{b}\approx 0.05$
. Sid, Dubief & Terrapon (Reference Sid, Dubief and Terrapon2015) extended the envelope of the flow parameters to
 $Re_{\unicode[STIX]{x1D70F}}\lesssim 400$
,
 $Ri_{b}\lesssim 1$
, confirming the non-monotonic trend of friction, and observing a typical blunting of the velocity and temperature profiles as the effect of buoyancy becomes significant. Using a DNS database at
 $Re_{\unicode[STIX]{x1D70F}}\lesssim 200$
,
 $Ra\lesssim 10^{7}$
, Scagliarini et al. (Reference Scagliarini, Einarsson, Gylfason and Toschi2015) developed a phenomenological model resulting in a modified logarithmic law for the mean velocity which incorporates the effects of friction and buoyancy. Garai, Kleissl & Sarkar (Reference Garai, Kleissl and Sarkar2014) carried out a DNS study whereby the effect of increasing instability and heat conduction within the solid wall are considered, finding that convective instability does affect the coherent structures. Specifically, they found that in the mixed regime the plumes (downdrafts) tend to align one after another along the streamwise direction, and induce streamwise roll vortices in the bulk region of the channel flow. Notably, all the above numerical studies were carried out at rather low Reynolds and/or Rayleigh number, hence they are not necessarily representative of fully turbulent flow conditions of practical relevance, and they span a limited range of Richardson numbers, typically close to the case of pure forced convection. Further, with the exception of the work of Zonta & Soldati (Reference Zonta and Soldati2014), simulations have been mainly carried out in narrow channels, which may prevent natural self-organization of large-scale coherent structures.
The theoretical understanding of mixed convective flows mainly relies on the framework laid by Obukhov (Reference Obukhov1946), Monin & Obukhov (Reference Monin and Obukhov1954). Being based on dimensional arguments, the Monin–Obukhov (hereafter MO) similarity theory rests on the existence of a single length scale which incorporates the effects of friction and buoyancy, defined as
 $$\begin{eqnarray}L=\frac{u_{\unicode[STIX]{x1D70F}}^{3}}{\unicode[STIX]{x1D6FD}gQ},\end{eqnarray}$$
where
 $u_{\unicode[STIX]{x1D70F}}=(\unicode[STIX]{x1D70F}_{w}/\unicode[STIX]{x1D70C})^{1/2}$
is the friction velocity (with
 $\unicode[STIX]{x1D70F}_{w}$
and
 $\unicode[STIX]{x1D70C}$
the time- and surface-averages wall viscous stress and the fluid density, respectively),
 $Q$
is the total vertical heat flux,
 $\unicode[STIX]{x1D6FD}$
is the thermal expansion coefficient of the fluid, and
 $g$
is the gravity acceleration. It should be noted that the definition of
 $L$
given in (1.1) is consistent with that given by Kader & Yaglom (Reference Kader and Yaglom1990), and it differs from the most commonly used definition which also includes a minus sign in front of the expression, and which incorporates the Karman constant at the denominator. Given the definition of the MO length scale, and based on the turbulence kinetic energy equation, it is expected that for wall distances below
 $L$
mechanical production of turbulence dominates, whereas buoyant production should prevail further away (Wyngaard, Coté & Izumi Reference Wyngaard, Coté and Izumi1971). MO similarity is frequently used in the meteorological context to estimate stress and heat flux from mean velocity and temperature gradients (Stull Reference Stull2012), and in LES as a wall function for enforcement of numerical boundary conditions at off-wall locations (Deardorff Reference Deardorff1972). The MO similarity theory has received general confirmation from atmospheric field measurements, although with a large degree of scatter owing to inherent measurement uncertainties, and even certain basic features as the asymptotic mean velocity and temperature scalings under light-wind conditions are the subject of current controversy (Rao Reference Rao2004; Rao & Narasimha Reference Rao and Narasimha2006). Numerical simulations based on LES models do support MO similarity in general terms (Khanna & Brasseur Reference Khanna and Brasseur1997, Reference Khanna and Brasseur1998; Johansson et al.
Reference Johansson, Smedman, Högström, Brasseur and Khanna2001; Zilitinkevich et al.
Reference Zilitinkevich, Hunt, Esau, Grachev, Lalas, Akylas, Tombrou, Fairall, Fernando and Baklanov2006), although serious issues arise regarding the proper scaling of horizontal velocity fluctuations. It is worthwhile noting that those LES studies were carried out at realistic atmospheric conditions, hence possibly affected by approximate subgrid-scale parametrization as well as by uncertainties incurred with the use of MO theory to model the near-ground flow. DNS has also been occasionally used to scrutinize predictions of the MO similarity; however, mainly for the case of stable stratification (Chung & Matheou Reference Chung and Matheou2012; Shah & Bou-Zeid Reference Shah and Bou-Zeid2014).
It is the main purpose of this study to establish a high-fidelity database for unstably buoyant channel flows which encompasses a wide range of Richardson numbers, at high enough values of Reynolds and Rayleigh number to be representative of fully developed turbulence. The accompanying expectation is that the data herein collected may be used for the development of improved near-wall models for LES. The numerical database is presented in § 2, the flow organization is discussed in § 3, and the main flow statistics in § 4. The results are discussed in the light of MO similarity theory in § 5, and considerations on predictive formulae for heat transfer and skin friction are given in § 6.
2 The numerical database
The Navier–Stokes equations for an incompressible buoyant fluid under the Boussinesq approximation are numerically solved
 $$\begin{eqnarray}\displaystyle \frac{\unicode[STIX]{x2202}u_{j}}{\unicode[STIX]{x2202}x_{j}}=0,\quad \frac{\unicode[STIX]{x2202}u_{i}}{\unicode[STIX]{x2202}t}+\frac{\unicode[STIX]{x2202}u_{i}u_{j}}{\unicode[STIX]{x2202}x_{j}}=-\frac{\unicode[STIX]{x2202}p}{\unicode[STIX]{x2202}x_{i}}+\unicode[STIX]{x1D6FD}g\unicode[STIX]{x1D703}\unicode[STIX]{x1D6FF}_{i2}+\unicode[STIX]{x1D6F1}\unicode[STIX]{x1D6FF}_{i1}+\unicode[STIX]{x1D708}\frac{\unicode[STIX]{x2202}^{2}u_{i}}{\unicode[STIX]{x2202}x_{j}\unicode[STIX]{x2202}x_{j}}, & & \displaystyle\end{eqnarray}$$
 $$\begin{eqnarray}\displaystyle \frac{\unicode[STIX]{x2202}\unicode[STIX]{x1D703}}{\unicode[STIX]{x2202}t}+\frac{\unicode[STIX]{x2202}\unicode[STIX]{x1D703}u_{j}}{\unicode[STIX]{x2202}x_{j}}=\unicode[STIX]{x1D6FC}\frac{\unicode[STIX]{x2202}^{2}\unicode[STIX]{x1D703}}{\unicode[STIX]{x2202}x_{j}\unicode[STIX]{x2202}x_{j}}, & & \displaystyle\end{eqnarray}$$
where
 $u_{i}$
are the Cartesian velocity components (
 $i=1,2,3$
corresponding, respectively to the streamwise, wall-normal, and spanwise directions),
 $p$
is the pressure,
 $\unicode[STIX]{x1D703}$
is the temperature perturbation with respect to a reference state of hydrostatic equilibrium,
 $\unicode[STIX]{x1D6FD}$
is the thermal expansion coefficient,
 $g$
is the gravity acceleration,
 $\unicode[STIX]{x1D6F1}=u_{\unicode[STIX]{x1D70F}}^{2}/h$
is the forcing acceleration used to maintain a constant mass flow rate, and
 $\unicode[STIX]{x1D708}$
and
 $\unicode[STIX]{x1D6FC}$
are the kinematic viscosity and temperature diffusivity, respectively. The Navier–Stokes–Boussinesq system is typically deemed to be a very good approximation for atmospheric flows. Deviations from the assumed model (referred to as Non-Oberbeck–Boussinesq effects), and mainly caused by dependence of the dynamic viscosity and thermal expansion coefficients on temperature, were studied by Zonta & Soldati (Reference Zonta and Soldati2014). For the purpose the above system of equations, an existing channel flow solver with passive scalar transport (Pirozzoli et al.
Reference Pirozzoli, Bernardini and Orlandi2016) has been modified; the code is capable of discretely preserving the total kinetic energy and the scalar variance in the limit of vanishing diffusivities and time integration error. The temperature is assigned at the bottom and top no-slip walls, and periodic boundary conditions are enforced in the streamwise and spanwise directions to exploit statistical homogeneity.
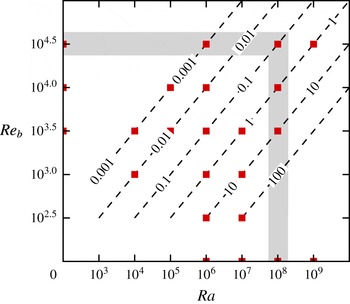
Overview of computed flow cases in the
 $Ra$
–
 $Re_{b}$
plane. Each solid square corresponds to a DNS. The dashed diagonal lines have constant
 $Ri_{b}$
. The shaded area highlights the subset of DNS which have been mainly used for the statistical analysis. Note that the bi-logarithmic diagram is intentionally inconsistent for the purpose of including the extreme cases of free convection (
 $Re_{b}=0$
) and forced convection (
 $Ra=0$
).

The flow under study is controlled by three global parameters, namely the bulk Reynolds number
 $Re_{b}=2hu_{b}/\unicode[STIX]{x1D708}$
, where
 $u_{b}$
is the channel bulk velocity, the Rayleigh number,
 $Ra=(8h^{3}\unicode[STIX]{x1D6FD}g\unicode[STIX]{x0394}\unicode[STIX]{x1D703})/(\unicode[STIX]{x1D6FC}\unicode[STIX]{x1D708})$
, where
 $\unicode[STIX]{x0394}\unicode[STIX]{x1D703}$
is the temperature difference across the two walls, and the Prandtl number,
 $Pr=\unicode[STIX]{x1D708}/\unicode[STIX]{x1D6FC}$
. The relative importance of gravity as compared to convection is quantified by the bulk Richardson number,
 $Ri_{b}=2h\unicode[STIX]{x1D6FD}g\unicode[STIX]{x0394}\unicode[STIX]{x1D703}/u_{b}^{2}=Ra/(Re_{b}^{2}Pr)$
. All the simulations have been carried out at unit Prandtl number, covering the range of Reynolds and Rayleigh numbers
 $0\leqslant Re_{b}\leqslant 10^{4.5}=31\,623$
,
 $0\leqslant Ra\leqslant 10^{9}$
. The various DNS are labelled according to the following convention: Rax_Rey denotes a run carried out at
 $Ra=10^{x}$
,
 $Re_{b}=10^{y}$
,
 $Ra=0$
corresponding to pure Poiseuille flow, and
 $Re_{b}=0$
corresponding to pure Rayleigh–Bénard flow. Accordingly, the Richardson number may attain the extreme values
 $0$
and
 $\infty$
, and finite values in the range
 $10^{-3}$
–
 $10^{2}$
, in multiples of 10. An overview of the computed flow cases is presented in figure 1 in the
 $Ra$
–
 $Re_{b}$
plane. The extreme cases of Rayleigh–Bénard and Poiseuille flow are shown on the horizontal and vertical axes, respectively. It is important to note that in the chosen doubly logarithmic representation the iso-lines of the bulk Richardson number are diagonal lines, and the flow conditions are selected in such a way that several flow cases are encountered along the iso-
 $Ri_{b}$
lines to help isolate the effects of the parameters in play. Table 1 provides a list of the bulk flow parameters obtained for all the simulations herein carried out. The grid spacings have been carefully selected in such a way that the resolution requirements put forth by Shishkina et al. (Reference Shishkina, Stevens, Grossmann and Lohse2010) are satisfied in the limit case of pure buoyant flow, and the spacings in wall units are
 $\unicode[STIX]{x0394}x^{+}=\unicode[STIX]{x0394}z^{+}\lesssim 4.5$
in pure Poiseuille flow (Bernardini et al.
Reference Bernardini, Pirozzoli and Orlandi2014). The adequacy of the mesh resolution has been checked a-posteriori for all the simulations, and the grid size in each coordinate direction is nowhere larger that three local Kolmogorov units.
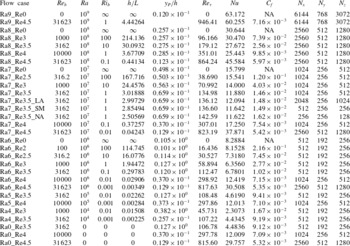
List of parameters for buoyant turbulent channel DNS.
 $Re_{b}=2hu_{b}/\unicode[STIX]{x1D708}$
is the bulk Reynolds number,
 $Re_{\unicode[STIX]{x1D70F}}=hu_{\unicode[STIX]{x1D70F}}/\unicode[STIX]{x1D708}$
is the friction Reynolds number,
 $Ri_{b}=2\unicode[STIX]{x1D6FD}g\unicode[STIX]{x0394}\unicode[STIX]{x1D703}h/u_{b}^{2}$
is the bulk Richardson number,
 $Ra=\unicode[STIX]{x1D6FD}g\unicode[STIX]{x0394}\unicode[STIX]{x1D703}(2h)^{3}/(\unicode[STIX]{x1D6FC}\unicode[STIX]{x1D708})$
is the Rayleigh number,
 $Nu=2hQ/(\unicode[STIX]{x1D6FC}\unicode[STIX]{x0394}\unicode[STIX]{x1D703})$
is the Nusselt number,
 $C_{f}=2\unicode[STIX]{x1D70F}_{w}/(\unicode[STIX]{x1D70C}u_{b}^{2})$
is the skin friction coefficient.
 $N_{x}$
,
 $N_{y}$
,
 $N_{z}$
are the number of grid points in the streamwise, wall-normal, and spanwise directions. An error stretching function
 $y(\unicode[STIX]{x1D702})=\text{erf}[a(\unicode[STIX]{x1D702}-0.5)]/\text{erf}(0.5a)$
,
 $a=3.2$
,
 $\unicode[STIX]{x1D702}=[-1,1]$
has been used to cluster grid points in the wall-normal direction. All simulations are carried out in a
 $L_{x}\times L_{z}=16h\times 8h$
box, except for those labelled as LA (
 $32h\times 16h$
), SM (
 $8h\times 4h$
), NA (
 $4h\times 2h$
).

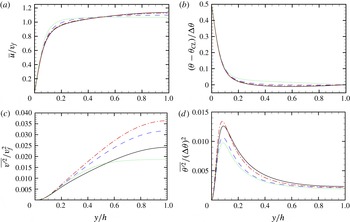
Box size sensitivity study for flow case Ra7_Re3.5 (
 $Ri_{b}=1$
): (a) mean velocity; (b) mean temperature; (c) variance of wall-normal velocity; (d) variance of temperature.
 $v_{f}=(2\unicode[STIX]{x1D6FD}gh\unicode[STIX]{x0394}\unicode[STIX]{x1D703})^{1/2}$
is the reference free-fall velocity. Statistics are obtained in boxes with
 $L_{x}\times L_{z}=4h\times 2h$
(dotted lines);
 $8h\times 4h$
(dashed lines);
 $16h\times 8h$
(solid lines);
 $32h\times 16h$
(dot-dashed lines).

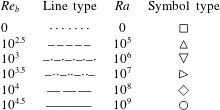
Nomenclature of lines (indicating the value of
 $Ra$
) and symbols (indicating the value of
 $Re_{b}$
).

Preliminary simulations have been carried out for flow case Ra7_Re3.5 (having
 $Ri_{b}=1$
) to establish the effect of computational box size on the turbulence statistics. The bulk flow parameters for these DNS, listed in table 1, suggest little effect of the box size, except for the smallest domain (having
 $L_{x}=4h$
,
 $L_{z}=2h$
), which shows symptoms of severe numerical confinement. Differences are clearer in the statistics of velocity and temperature, as shown in figure 2. The figure suggests that the computational domain has effects even on the mean flow properties, and especially the velocity variable, which tends to have a flatter spatial distribution in narrow domains. Near insensitivity of mean velocity and temperature is observed starting at
 $L_{x}\times L_{z}=16h\times 8h$
, although velocity and temperature variances are still varying, even in a non-monotonic fashion. Hence, given the need to keep the computational expense within reasonable bounds, and given the restrictions on the computational box size in Poiseuille flow (Bernardini et al.
Reference Bernardini, Pirozzoli and Orlandi2014), all simulations have been performed in a
 $16h\times 8h$
box. In this respect we note that linear stability analysis (Gage & Reid Reference Gage and Reid1968) predicts the onset of exponentially growing disturbances in the form of longitudinal rolls in the presence of unstable stratification, even at very low Rayleigh number. The most unstable disturbances predicted by linear stability analysis have a typical spanwise wavelength of approximately
 $4h$
, which is comparable with the typical wavelength of the rollers recovered in fully turbulent simulations (see below). Hence,
 $L_{z}=4h$
may be regarded as a minimal spanwise box size to achieve developed turbulence in channel flow simulations of mixed convection phenomena.
For ease of later reference, the style of lines and symbols used to denote the various flow cases is explained in table 2. To avoid possible confusion it is important to note that, consistent with (most of) the wall turbulence community, the streamwise, wall-normal and spanwise coordinates are here labelled as
 $x$
,
 $y$
,
 $z$
, respectively, and the corresponding velocity components as
 $u$
,
 $v$
,
 $w$
. In contrast, in the geophysical community
 $z$
and
 $w$
are typically reserved for the vertical, wall-normal, direction.
3 Flow organization
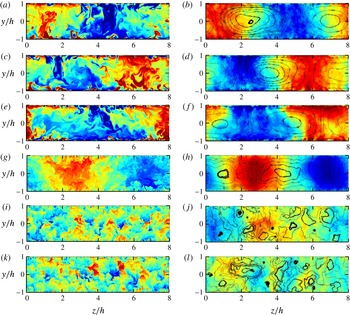
The flow structure is scrutinized in this section by analysing instantaneous snapshots of the flow variables and their corresponding spectral densities. To get insight into the combined effects of Reynolds and Rayleigh numbers, we show instantaneous velocity and temperature fluctuations (figures 3–5) in wall-parallel and cross-stream planes for several cases along the outer edge of the parameter-space matrix, marked with a shaded area in figure 1, for decreasing
 $Ri_{b}$
. Specifically, DNS results are presented at constant
 $Ra=10^{8}$
for increasing
 $Re_{b}$
, up to
 $Ri_{b}=1$
, and then at constant
 $Re_{b}=10^{4.5}$
for decreasing
 $Ra$
, down to the limit case of Poiseuille flow. Two representative wall distances have been selected for the analysis; the channel centreline (
 $y=h$
), where
 $v^{\prime }$
and
 $\unicode[STIX]{x1D703}^{\prime }$
probe the large-scale flow organization, and the position of peak production of temperature fluctuations (
 $P_{\unicode[STIX]{x1D703}}=-\overline{v^{\prime }\unicode[STIX]{x1D703}^{\prime }}\,\text{d}\overline{\unicode[STIX]{x1D703}}/\text{d}y$
), hereafter indicated as
 $y=y_{P}$
(see table 1 for the numerical values), where we show
 $u^{\prime }$
and
 $\unicode[STIX]{x1D703}^{\prime }$
. For the purpose of clearly bringing to light large-scale organized motions, in figure 5(b,d,f,h,j,l) we also show the instantaneous temperature fields averaged in the streamwise direction (the streamwise averaging operator is hereafter denoted with the angular brackets
 $\langle \cdot \rangle$
), with associated streamtraces of the cross-stream flow. In the free-convection limit (panels a,b) persistent large-scale flow organization is observed at the channel centreline, consisting of a network of rollers which transport hot fluid from the bottom to the top (and vice versa) through upward- and downward-travelling plumes, as is evident from figure 5(a,b). The flow visualizations suggest that the rollers have axes preferably pointing in the
 $x$
and in the
 $z$
direction, which is a likely consequence of the rectangular geometry of the computational domain. Indeed, the footprint of rollers with axes aligned in the
 $z$
direction is apparent in the near-wall distribution of
 $u$
(see figure 4
a). As soon as the mean flow rate becomes non-zero (panels c,d, corresponding to
 $Ri_{b}=100$
), the flow attains a more definite spatial orientation, the rollers now mostly pointing in the streamwise direction. It is noteworthy that only one pair of counter-rotating rollers are captured within the selected computational box. At intermediate Richardson numbers a strong meandering behaviour of the rollers is observed, which is most evident at
 $Ri_{b}=1$
(panels e,f), and which is the likely result of wavy instability of the counter-rotating rollers. This kind of instability is frequently observed in the meteorological context (Avsec Reference Avsec1937; Bénard & Avsec Reference Bénard and Avsec1938), and in experiments (Pabiou, Mergui & Benard Reference Pabiou, Mergui and Benard2005), and it was theoretically explained in the context of laminar flow by Clever & Busse (Reference Clever and Busse1991). The association between vertical velocity and temperature fluctuations at the channel centreline, well reflects the importance of vertical motions in the redistribution of the temperature field. Waviness of the rollers seems to be suppressed at further low Richardson number (
 $Ri_{b}=0.01$
, see panels g,h), at which the rollers are very nearly straight, and strong organization is observed in cross-stream planes. Loss of coherence of the rollers and loss of correlation between
 $v^{\prime }$
and
 $\unicode[STIX]{x1D703}^{\prime }$
is observed starting from
 $Ri=0.001$
(panels i,j), which marks the passage to a spotty organization in the channel core typical of Poiseuille flow. In cross-stream planes (see figure 5), the change of regime from
 $Ri_{b}=0.01$
to
 $Ri_{b}=0.001$
is marked by the disappearance of rollers spanning the whole channel, although large eddies are still observed in the form of wall-attached ejections, mainly confined to each channel half (Bernardini et al.
Reference Bernardini, Pirozzoli and Orlandi2014).
Effect of Reynolds and Rayleigh number variation: instantaneous visualizations of
 $v^{\prime }$
(a,c,e,g,i,k) and
 $\unicode[STIX]{x1D703}^{\prime }$
(b,d,f,h,j,l) at channel centre plane (
 $y=h$
) for flow cases Ra8_Re0 (
 $Ri_{b}=\infty$
, a,b), Ra8_Re3 (
 $Ri_{b}=100$
, c,d), Ra8_Re4 (
 $Ri_{b}=1$
, e,f), Ra7_Re4.5 (
 $Ri_{b}=0.01$
, g,h), Ra6_Re4.5 (
 $Ri_{b}=0.001$
, i,j), Ra0_Re4.5 (
 $Ri_{b}=0$
, k,l). 24 contour levels are shown for each variable in the range
 $\pm 3$
standard deviations from the mean value (negative values in blue and positive in red).

Effect of Reynolds and Rayleigh number variation: instantaneous visualizations of
 $u^{\prime }$
(a,c,e,g,i,k) and
 $\unicode[STIX]{x1D703}^{\prime }$
(b,d,f,h,j,l) at near-wall station (
 $y=y_{P}$
) for flow cases Ra8_Re0 (
 $Ri_{b}=\infty$
, a,b), Ra8_Re3 (
 $Ri_{b}=100$
, c,d), Ra8_Re4 (
 $Ri_{b}=1$
, e,f), Ra7_Re4.5 (
 $Ri_{b}=0.01$
, g,h), Ra6_Re4.5 (
 $Ri_{b}=0.001$
, i,j), Ra0_Re4.5 (
 $Ri_{b}=0$
, k,l). 24 contour levels are shown for each variable in the range
 $\pm 3$
standard deviations from the mean value (negative values in blue and positive in red).

Effect of Reynolds and Rayleigh number variation: visualizations of
 $\unicode[STIX]{x1D703}^{\prime }$
(a,c,e,g,i,k) and
 $\langle \unicode[STIX]{x1D703}^{\prime }\rangle$
(b,d,f,h,j,l) in cross-stream plane for flow cases Ra8_Re0 (
 $Ri_{b}=\infty$
, a,b), Ra8_Re3 (
 $Ri_{b}=100$
, c,d), Ra8_Re4 (
 $Ri_{b}=1$
, e,f), Ra7_Re4.5 (
 $Ri_{b}=0.01$
, g,h), Ra6_Re4.5 (
 $Ri_{b}=0.001$
, i,j), Ra0_Re4.5 (
 $Ri_{b}=0$
, k,l). 24 contour levels are shown for each variable in the range
 $\pm 3$
standard deviations from the mean value (negative values in blue and positive in red). Panels (b,d,f,h,j,l) also report the streamtraces constructed with the streamwise-averaged cross-stream flow
 $(\langle v\rangle ,\langle w\rangle )$
.

As a result of the change in the bulk flow organization, the near-wall turbulence is also modified. In the case of free convection (figure 4
a,b) the typical temperature pattern observed in Rayleigh–Bénard flow is recovered, with a distinctive network of near-wall line plumes protruding from the boundary layer into the bulk flow (Kerr Reference Kerr1996). A similar organization is found up to
 $Ri_{b}=1$
(panels e,f), although a clear modulating influence from the overlaying rollers is found as the most intense near-wall plumes tend to be embedded within large-scale updraughts which are the ascending branch of core rollers (compare with figure 3
e,f). In this regime the streamwise velocity does not have a definite small-scale organization, nor it is clearly associated with the temperature field. The scenario changes at
 $Ri_{b}=0.01$
(figure 4
g,h), with momentum streaks first appearing near the wall, which have strongly negative correlation with temperature fluctuations. At this
 $Ri_{b}$
, the streaks appear to be strongly modulated by the action of the core rollers. However, as this action ceases (
 $Ri_{b}\leqslant 0.001$
), near-wall turbulence attains the typical organization of canonical wall-bounded flows.
Numerical simulations at
 $Ri_{b}=1$
: instantaneous visualizations of
 $u^{\prime }$
(a,d,g),
 $v^{\prime }$
(b,e,h),
 $\unicode[STIX]{x1D703}^{\prime }$
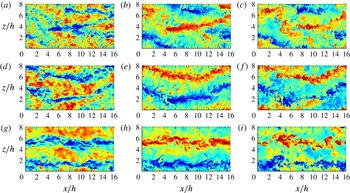
(c,f,i) at channel centreline for flow case Ra9_Re4.5 (a,b,c), Ra8_Re4 (d,e,f), Ra7_Re3.5 (g,h,i). 24 contour levels are shown for each variable in the range
 $\pm 3$
standard deviations from the mean value (negative values in blue and positive in red).

It is important to note that, to a first approximation, the type of flow pattern is controlled by the bulk Richardson number. As an illustrative example, in figure 6 we show flow visualizations for three flow cases with
 $Ri_{b}=1$
, in decreasing order of
 $Re_{b}$
(and
 $Ra$
). A similar type of large-scale organization is recovered in all three cases, perhaps with stronger meandering of the rollers at the higher
 $Re_{b}$
, at which finer scale organization of turbulence is obviously also observed.
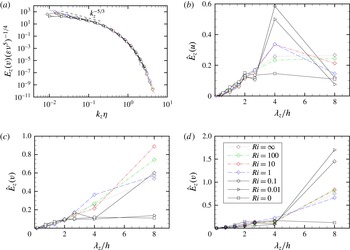
Spanwise spectral densities at channel centreline. In (a) the spectra of
 $v^{\prime }$
are shown in Kolmogorov representation (the thick grey line denotes the transverse velocity spectrum in isotropic turbulence at
 $Re_{\unicode[STIX]{x1D706}}=142$
(Jiménez et al.
Reference Jiménez, Wray, Saffman and Rogallo1993)). In (b–d) we show the normalized spectra of
 $u^{\prime }$
,
 $v^{\prime }$
,
 $\unicode[STIX]{x1D703}^{\prime }$
as a function of the wavelength. Refer to table 2 for nomenclature of lines and symbols.

More quantitative information regarding the flow structure can be obtained by inspecting the spectral densities of the flow variables, providing information on the repartition of energy across the various scales of turbulence. The spanwise spectra are here considered as they are not affected by bulk flow convection in the presence of shear (Bernardini et al.
Reference Bernardini, Pirozzoli and Orlandi2014). In figure 7(a) we show the spectra of wall-normal velocity fluctuations at the channel centreline in the classical Kolmogorov representation for all the flow cases shown in the previous flow visualizations, hence spanning the entire range of Richardson numbers. The figure shows near perfect universality of the distributions, and confirms adequate resolution of the small flow scales for all flow cases here reported. Excellent comparison is also obtained with transverse velocity spectra obtained from DNS data for isotropic turbulence (Jiménez et al.
Reference Jiménez, Wray, Saffman and Rogallo1993), hence supporting universality of the small scales far from walls. To better highlight the different spatial organization at the large scales of motion, spectral densities of velocity components and temperature are shown in linear scale and as a function of the spanwise wavelength in panels (b)–(d). To rule out effects of large turbulence intensity variation with
 $Re_{b}$
and
 $Ra$
, the spectral densities are reported in normalized form (denoted with the hat symbol), in such a way that they all integrate to unity. The figure confirms the dominance of energetic motions spanning the full channel width. In fact, the most energetic Fourier mode for
 $v$
and
 $\unicode[STIX]{x1D703}$
is found for all cases (with the exception of pure Poiseuille flow) at
 $\unicode[STIX]{x1D706}_{z}=L_{z}$
, which is consistent with the previously noticed occurrence of two rollers in all flow visualizations. It should be noted that the apparently non-monotonic Richardson number trend of the strength of the
 $L_{z}$
mode is due to the chosen normalization of the spectra. In fact, the unscaled spectra (not shown) have a monotonic increasing trend as
 $Ri_{b}$
decreases. The behaviour of the streamwise velocity spectra is quite different, and in that case the second Fourier mode (
 $\unicode[STIX]{x1D706}_{z}=L_{z}/2$
) is dominant, attaining a peak at
 $Ri_{b}=0.1$
. It is noteworthy that the doubled typical wavelength of
 $u$
with respect to
 $v$
is also different than observed in similar flows as plane Couette flow (Pirozzoli, Bernardini & Orlandi Reference Pirozzoli, Bernardini and Orlandi2014). The difference is due to the even symmetry properties of the mean velocity field with respect to the centreline, which implies that both upward and downward vertical motions locally convey positive streamwise velocity fluctuations. Hence, to each peak of
 $v^{\prime }$
at the channel centreline, two peaks of
 $u^{\prime }$
must be present.
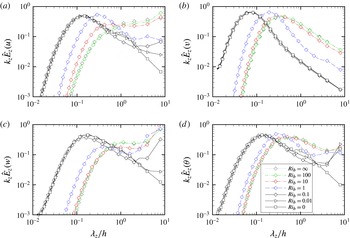
Pre-multiplied, normalized spanwise spectral densities of longitudinal velocity (a), vertical velocity (b), spanwise velocity (c) and temperature (d) at
 $y=y_{P}$
.

The spectral densities at the near-wall station (
 $y=y_{P}$
) are shown in figure 8. In this case, a semi-logarithmic representation is used for the pre-multiplied spectra, in such a way that equal areas correspond to equal energies. In flow cases near the free-convection limit, the spectra of
 $v$
and
 $\unicode[STIX]{x1D703}$
are bump-shaped, with a maximum at
 $\unicode[STIX]{x1D706}_{z}\approx 0.3h$
, which is connected with the typical spacing between adjacent near-wall plumes. On the other hand, the
 $u$
and
 $w$
spectra feature energy concentration at the largest scales, which is the footprint of the rollers sweeping the walls by horizontal ‘winds’ because of the impermeability condition. A change of behaviour is noticed around
 $Ri_{b}=1$
, which marks a substantial reduction of the typical length scale of the
 $v$
-bearing eddies towards
 $\unicode[STIX]{x1D706}_{z}\approx 0.07h$
, which corresponds to approximately 50 wall units (see table 1). This is the typical scale found in the near-wall streaks in Poiseuille flow (Kim, Moin & Moser Reference Kim, Moin and Moser1987); hence this change of flow scales is the symptom of passage from the regime of free to forced convection. A bump also forms in the spectra of
 $u$
,
 $w$
and
 $\unicode[STIX]{x1D703}$
at
 $Ri_{b}\lesssim 1$
, corresponding to approximately 100 wall units, again consistent with the behaviour in Poiseuille flow. Notably, at intermediate Richardson numbers, the spectra of
 $w^{\prime }$
seem to contain more energy at the largest resolved modes than the spectra of
 $u^{\prime }$
, which can be explained by recalling the dominant streamwise alignment of the rollers in the intermediate-
 $Ri_{b}$
regime.
4 Flow statistics
The main flow statistics are presented in this section, starting from the limiting cases of pure free and forced convection. The results obtained for Rayleigh–Bénard convection are shown at several Rayleigh numbers in figure 9, with temperatures scaled by the total difference
 $\unicode[STIX]{x0394}\unicode[STIX]{x1D703}$
, and velocities scaled with the reference free-fall velocity
 $v_{f}=(2\unicode[STIX]{x1D6FD}gh\unicode[STIX]{x0394}\unicode[STIX]{x1D703})^{1/2}$
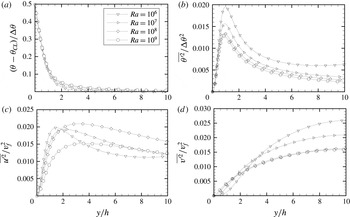
. For the sake of comparison of statistics at different Rayleigh numbers, wall distances (with the exception of panel d) are multiplied by the respective Nusselt number, since
 $h/Nu$
is proportional to the thermal boundary layer thickness (Ahlers et al.
Reference Ahlers, Grossmann and Lohse2009). In fact, the mean temperature profiles in panel (a) show near collapse in this representation, with an extended nearly linear profile, consistent with the established motion that at the (relatively low) Rayleigh numbers under scrutiny the boundary layer is in a (quasi-)laminar state (Ahlers et al.
Reference Ahlers, Grossmann and Lohse2009). The off-wall position
 $y=h/Nu$
also very well matches the location where temperature fluctuations attain a maximum (panel b), and the peak location of
 $\unicode[STIX]{x1D703}^{\prime }$
production (namely
 $y_{P}$
). It is noteworthy that the amplitude of this maximum depends on the Rayleigh number to some extent, with possible saturation at sufficiently high
 $Ra$
. This effect is likely caused by the decreased amplitude of vertical motions when measured in
 $v_{f}$
units (panel d), which also show evidence for saturation at high
 $Ra$
. Apparently, saturation of
 $\unicode[STIX]{x1D703}^{\prime }$
in confined geometries is not observed at Rayleigh numbers as high as
 $10^{11}$
(Stevens et al.
Reference Stevens, Lohse and Verzicco2011). Similar observations were made by Orlandi, Bernardini & Pirozzoli (Reference Orlandi, Bernardini and Pirozzoli2015a
), who noticed that in canonical shear flows turbulent fluctuations (as compared to the bulk channel velocity) are in fact higher at lower Reynolds number. No systematic trend with
 $Ra$
is observed for the horizontal velocity fluctuations (panel c), which are likely dominated by large-scale sweeping motions.
Profiles of mean temperature (a), temperature variance (b), horizontal velocity variance (c), and vertical velocity variance (d) in pure Rayleigh–Bénard flow (
 $Ri_{b}=\infty$
).
 $v_{f}=(2\unicode[STIX]{x1D6FD}gh\unicode[STIX]{x0394}\unicode[STIX]{x1D703})^{1/2}$
is the reference free-fall velocity, and the subscript CL is used to indicate the channel centreline state.

The structure of the velocity and temperature fields in natural convection has been the subject of extensive investigations, especially within the atmospheric science community (Wyngaard Reference Wyngaard1992). It is a common notion that a free-convection layer should exist in the atmosphere in which wind and temperature exhibit inverse power-law scalings with the wall distance
 $$\begin{eqnarray}\left.\begin{array}{@{}c@{}}\displaystyle \frac{\overline{\unicode[STIX]{x1D703}}(y)-\unicode[STIX]{x1D703}_{0}}{\unicode[STIX]{x1D703}_{\unicode[STIX]{x1D70F}}}=3B_{\unicode[STIX]{x1D703}}((y/L)^{-1/3}-(y_{0}/L)^{-1/3}),\\ \displaystyle \frac{\overline{u}(y)-u_{0}}{u_{\unicode[STIX]{x1D70F}}}=-3B_{u}((y/L)^{-1/3}-(y_{0}/L)^{-1/3}),\end{array}\right\}\end{eqnarray}$$
where
 $\unicode[STIX]{x1D703}_{\unicode[STIX]{x1D70F}}=Q/u_{\unicode[STIX]{x1D70F}}$
is the friction temperature,
 $L$
is the MO length scale defined in (1.1), the subscript
 $0$
denotes a suitable off-wall reference location, and
 $B_{\unicode[STIX]{x1D703}}$
and
 $B_{u}$
are two supposedly universal constants (for instance, Kader & Yaglom (Reference Kader and Yaglom1990) report
 $B_{\unicode[STIX]{x1D703}}\approx 1.3$
,
 $B_{u}\approx 1.9$
). Equation (4.1) was first derived by Prandtl (Reference Prandtl1932) from mixing length arguments, based on the assumption that the typical vertical velocity scale of wall-attached buoyant plumes is
 $v_{P}=(\unicode[STIX]{x1D6FD}gQy)^{1/3}$
, the associated temperature scale is
 $\unicode[STIX]{x1D703}_{P}=Q^{2/3}(\unicode[STIX]{x1D6FD}gy)^{-1/3}$
, and the turbulent Prandtl number is constant. Hence, the accompanying expectation is that the velocity variances should grow as
 $y^{2/3}$
, whereas the temperature variances should decay as
 $y^{-2/3}$
. Atmospheric measurements (Kader & Yaglom Reference Kader and Yaglom1990) generally indicate that the scaling laws (4.1) for the mean temperature field are grossly satisfied in the free-convection regime. However, field experiments in that regime are inevitably affected by the presence of (albeit small) mean winds, which implies large uncertainties and lack of reproducibility. On the other hand, laboratory experiments of pure convection have mostly focused on strongly confined conditions (Ahlers et al.
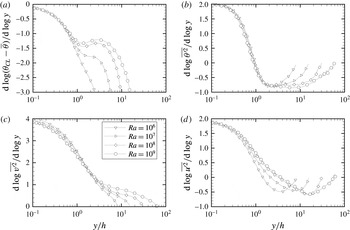
Reference Ahlers, Grossmann and Lohse2009), hence do not convey much useful information for the purpose. To directly verify the occurrence of the inverse power-law behaviour given by (4.1) in DNS we consider the distributions of the power-law indicator functions, defined as
 $\unicode[STIX]{x1D6EF}_{\unicode[STIX]{x1D711}}=(y/\unicode[STIX]{x1D711})\,\text{d}\unicode[STIX]{x1D711}/\text{d}y$
for several flow variables
 $\unicode[STIX]{x1D711}$
. The presence of a plateau in
 $\unicode[STIX]{x1D6EF}_{\unicode[STIX]{x1D711}}$
would obviously indicate a
 $\unicode[STIX]{x1D711}\sim y^{\unicode[STIX]{x1D6EF}_{\unicode[STIX]{x1D711}}}$
power-law range. The power-law indicators for mean temperature and for velocity and temperature variances are shown in figure 10 for free-convection flow cases. The mean temperature (panel a) does not show any evidence of a sensible layer with power-law behaviour. It may be argued that a dip is forming in a narrow range of wall distances at the highest Rayleigh number here considered (
 $Ra=10^{9}$
), although the resulting power-law exponent is far from the alleged
 $-1/3$
. This large discrepancy with respect to Prandtl’s theory seriously puts into question the validity of the predicted scaling, or perhaps suggests that extreme Rayleigh numbers are required to observe the
 $y^{-1/3}$
law.
Power-law diagnostic functions for mean temperature (a) temperature variance (b), vertical velocity variance (c), and horizontal velocity variance (d), in Rayleigh–Bénard flow (
 $Ri_{b}=\infty$
).

The validity of the classical free-convection scaling is also far from clear as regards the fluctuating flow properties. On the one hand (figure 10
b), it is found that an extended power-law region forms for the temperature variances, with exponent not far from the expected
 $-2/3$
value, and which widens with
 $Ra$
. On the other hand, while the variance of vertical fluctuations (panel c) may seem to form a small plateau with positive power-law exponent (optimistically, not far from the expected
 $2/3$
), the streamwise velocity fluctuations (panel d) are consistently decreasing towards the channel centreline, thus clearly contradicting the expected increasing trend. This odd behaviour of velocity fluctuations in free convection has been long recognized, and deviations from Prandtl’s scaling have been frequently attributed to the important effect of
 $h$
-scaled eddies on the horizontal velocity components (Panofsky et al.
Reference Panofsky, Tennekes, Lenschow and Wyngaard1977). A possible explanation for the observed ‘odd’ scaling of the horizontal velocity fluctuations was given by Kader & Yaglom (Reference Kader and Yaglom1990), based on the assumption that the relevant velocity scale for horizontal velocity fluctuations is
 $u_{\unicode[STIX]{x1D70F}}^{2}/v_{P}$
. Our impression is that figure 10(c) at least partially confirms their prediction, although no extended power-law range is observed here.
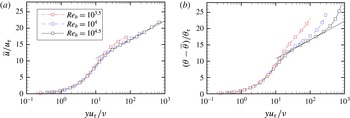
Profiles of mean streamwise velocity (a) and mean temperature (b) for pure Poiseuille flow (
 $Ri=0$
). The solid lines correspond to logarithmic laws for velocity and temperature.

For the sake of completeness the mean velocity and temperature profiles for the case of pure Poiseuille flow are also shown in figure 11. It is found that the mean velocity profiles (panel a) are accurately fitted using the conventional logarithmic approximation, namely
 $u/u_{\unicode[STIX]{x1D70F}}=C+\log (yu_{\unicode[STIX]{x1D70F}}/\unicode[STIX]{x1D708})/k$
, with the traditional choice
 $C=5$
,
 $k=0.4$
. The same approximation works well also for the temperature field (panel b), hence at unit Prandtl number and in the absence of coupling through buoyancy, very close similarity is found between the velocity and the temperature fields, except in the channel core, where temperature must have non-zero derivative.
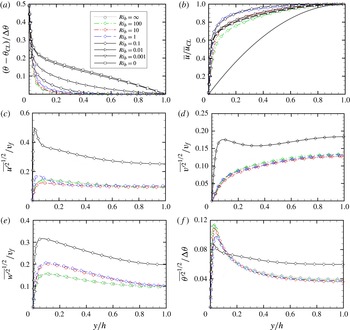
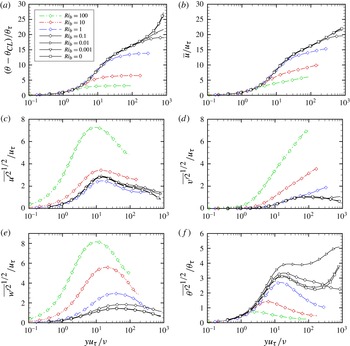
Profiles of mean temperature (a), mean streamwise velocity (b), streamwise velocity variance (c), vertical velocity variance (d), spanwise velocity variance (e) and temperature variance (f). The thick grey line in (b) corresponds to the laminar Poiseuille parabolic profile.

The effect of Richardson number variation starting from the free-convection regime is illustrated in figure 12. As
 $Ri_{b}$
decreases (i.e. the mass flow rate increases at given
 $Ra$
) the mean temperature profile (panel a) tends to become less flat, departing from the free-convection distribution, and eventually attaining a near logarithmic distribution. The mean velocity profile (panel b) has a more complex behaviour, initially becoming more blunted down to
 $Ri_{b}=0.1$
, and then less flat while approaching the Poiseuille limit. Although the bulk Reynolds number is very low in the light-wind (high-
 $Ra$
) simulations, the velocity profile seems to be much different from the laminar Poiseuille profile, which is also shown in (panel b) for reference. For instance, the flow case Ra8_Re3 (corresponding to
 $Ri_{b}=100$
) shows a blunted profile despite having a bulk Reynolds number well below the expected threshold for forced turbulence to sustain itself in pure shear flow. This intermediate state is not found in either of the limit cases of Rayleigh–Bénard and Poiseuille flow, while having some features of both. Regarding the statistics of turbulent fluctuations (only shown here for
 $Ri_{b}\geqslant 0.1$
for clarity), a very similar pattern as in free convection is observed down to
 $Ri_{b}=1$
. A different regime starts at
 $Ri_{b}=0.1$
, which is associated with increased importance of friction. Hence, near-wall peaks of
 $u^{\prime }$
and
 $v^{\prime }$
form, and the profile of
 $\unicode[STIX]{x1D703}^{\prime }$
tends to flatten in the channel core.
Shear-scaled profiles of mean temperature (a), mean streamwise velocity (b), streamwise velocity variance (c), vertical velocity variance (d), spanwise velocity variance (e) and temperature variance (f), in mixed convection regime.

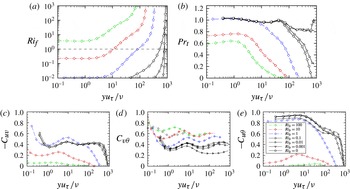
Profiles of flux Richardson number (a), turbulent Prandtl number (b), and
 $u$
–
 $v$
(c),
 $v$
–
 $\unicode[STIX]{x1D703}$
(d) and
 $u$
–
 $\unicode[STIX]{x1D703}$
(e) correlation coefficients in the mixed convection regime. The dashed horizontal line in (a) marks the unit value of
 $Ri_{f}$
.

The same properties are reported upon wall scaling in figure 13, to highlight deviations from the forced convection limit at increasing
 $Ri_{b}$
. In wall units, both the temperature and the velocity profiles approach the zero–
 $Ri_{b}$
log-law limit from below, and logarithmic layers for both variables are observed starting at
 $Ri_{b}=0.1$
. A universal wall scaling for the velocity and temperature fluctuations is also established at
 $Ri_{b}=0.1$
, with near-wall peaks of
 $u^{\prime }$
and
 $\unicode[STIX]{x1D703}^{\prime }$
at
 $y^{+}\approx 15$
, and peaks of
 $v^{\prime }$
and
 $w^{\prime }$
further away. At higher
 $Ri_{b}$
, increasing values are found for the wall-scaled velocity fluctuations, and lower values are found for the temperature fluctuations. This is the result of a change from wall scaling to free-fall scaling, since here
 $Re_{b}$
is decreasing at constant
 $Ra$
, and as a result
 $v_{f}/u_{\unicode[STIX]{x1D70F}}=\sqrt{Ra/Pr}/(2Re_{\unicode[STIX]{x1D70F}})$
is increasing, and
 $\unicode[STIX]{x1D703}_{\unicode[STIX]{x1D70F}}/\unicode[STIX]{x0394}\unicode[STIX]{x1D703}$
is decreasing at increasing
 $Ri_{b}$
. Furthermore, the peaks of
 $u^{\prime }$
and
 $w^{\prime }$
tend to come close to each other because of flow isotropization in wall-parallel planes.
Further insights into changes occurring between
 $Ri_{b}=0.1$
and
 $1$
can be gained from figure 14. In panel (a) we report the distributions of the flux Richardson number
 $$\begin{eqnarray}Ri_{f}=\frac{-\unicode[STIX]{x1D6FD}g\overline{v^{\prime }\unicode[STIX]{x1D703}^{\prime }}}{\overline{u^{\prime }v^{\prime }}\,\text{d}\overline{u}/\text{d}y},\end{eqnarray}$$
representing the ratio of the production of vertical velocity variance to the production of horizontal velocity variance. Hence,
 $Ri_{f}$
is expected to be a local indicator of the relative dynamical importance of buoyancy as compared to friction. Except for the limiting case of high
 $Ri_{b}$
, the near-wall region is always dominated by shear; hence it is referred to as dynamic or convective sublayer (Kader & Yaglom Reference Kader and Yaglom1990) in the atmospheric science community. Further up, the flow in the so-called free-convection layer is dominated by buoyancy. A major change occurs between
 $Ri_{b}=1$
, where the dynamic sublayer occupies approximately
 $10\,\%$
of the wall layer, and
 $Ri_{b}=0.1$
, where this fraction exceeds
 $50\,\%$
. A quantity of great relevance in turbulence models for scalar transport is the turbulent Prandtl number, defined as the ratio of the turbulent momentum and temperature diffusivities, namely
 $$\begin{eqnarray}Pr_{t}=\frac{\unicode[STIX]{x1D708}_{t}}{\unicode[STIX]{x1D6FC}_{t}}=\frac{\overline{u^{\prime }v^{\prime }}}{\overline{v^{\prime }\unicode[STIX]{x1D703}^{\prime }}}\frac{\text{d}\overline{\unicode[STIX]{x1D703}}/\text{d}y}{\text{d}\overline{u}/\text{d}y},\end{eqnarray}$$
whose distribution is shown in figure 14(b). Consistently with numerical and experimental data (Kader Reference Kader1981; Cebeci & Bradshaw Reference Cebeci and Bradshaw1984; Pirozzoli et al.
Reference Pirozzoli, Bernardini and Orlandi2016), in the forced convection regime
 $Pr_{t}$
is close to unity in the near-wall region, and to
 $0.85$
in the bulk flow up to
 $y/h\approx 0.5$
. Notably, the Prandtl number starts dropping from the outer layer at
 $Ri_{b}=0.01$
, and its value is well below unity throughout the channel at high
 $Ri_{b}$
. This behaviour is in clear contradiction with the assumption of constant
 $Pr_{t}$
advocated in Prandtl’s free-fall theory, and it clearly indicates that buoyancy is much more effective in redistributing temperature than momentum. This inference is confirmed by the
 $u{-}v$
,
 $v{-}\unicode[STIX]{x1D703}$
and
 $u{-}\unicode[STIX]{x1D703}$
correlation coefficients, shown in panels (c), (d) and (e), respectively. As found in canonical Poiseuille flow (Pirozzoli et al.
Reference Pirozzoli, Bernardini and Orlandi2016),
 $C_{v\unicode[STIX]{x1D703}}$
stays close to
 $0.4$
throughout the wall layer at low
 $Ri_{b}$
, and it increases with
 $Ri_{b}$
, reaching a value of approximately
 $0.6$
in free convection, reflecting increased effectiveness of wall-normal motions. On the other hand,
 $C_{u\unicode[STIX]{x1D703}}$
(obviously negative) is found to be close to
 $0.9$
near the wall and to decrease with the wall distance in forced convection, reflecting the similarity in the behaviour of
 $u$
with that of a passive scalar (Abe & Antonia Reference Abe and Antonia2009). The correlation drops sharply past
 $Ri_{b}=1$
, reflecting the change in the organization of
 $u$
by buoyancy-induced vertical motions, presumably through pressure effects. These findings conform well with measurements (Li & Bou-Zeid Reference Li and Bou-Zeid2011) and LES (Patton et al.
Reference Patton, Sullivan, Shaw, Finnigan and Weil2014) of the convective atmospheric boundary layer, which consistently showed that scalars become more efficiently and momentum drastically less efficiently transported as buoyancy increases.
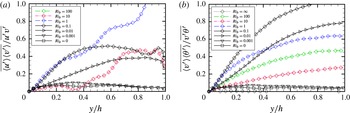
Dynamical effect of large-scale motions: fractional contribution of rollers to turbulent momentum (a) and heat (b) fluxes.

4.1 Effect of large-scale motions
In order to quantify the dynamical effect of the large-scale structures (rollers) observed in the flow visualizations, in figure 15 we show their contribution to the total fluxes of heat and momentum. For that purpose, we consider the
 $uv$
and
 $v\unicode[STIX]{x1D703}$
correlations constructed with the streamwise-averaged velocity fields. As shown by Papavassiliou & Hanratty (Reference Papavassiliou and Hanratty1997), Pirozzoli et al. (Reference Pirozzoli, Bernardini and Orlandi2014), streamwise filtering approximately removes the contribution of all the scales of motion except for those which have strong streamwise coherence. Next, we take spanwise averages to estimate the correlations
 $\overline{\langle u^{\prime }\rangle \langle v^{\prime }\rangle }$
,
 $\overline{\langle v^{\prime }\rangle \langle \unicode[STIX]{x1D703}^{\prime }\rangle }$
which can be interpreted as the part of turbulent stresses associated with rollers. Because of the huge size of a three-dimensional instantaneous configuration, all the diagnostics are collected at runtime, and at the end only the latest snapshot, which is also used for restart, is available. As a consequence any analysis not planned before starting the simulation is either obtained from the latest instantaneous field or requires a new run. Hence the distributions in figure 15 are not perfectly smooth, and they can occasionally exceed the overall turbulent fluxes. Overall, the figure supports the expected result that large-scale eddies are primarily active away from walls. Figure 15(a) further shows that rollers are quite ineffective in transporting momentum in the free-convection regime (
 $Ri_{b}\gtrsim 100$
), and they only become important at lower Richardson numbers, providing virtually all the momentum flux in the channel core at
 $Ri_{b}=1$
. Approximately 30 %–40 % of the Reynolds shear stress is still due to rollers for weak buoyancy effects, down to
 $Ri_{b}=0.01$
, whereas their contribution becomes again small in the forced convection limit. A similar behaviour is also recovered for the heat flux (shown in panel b), however with yet higher influence than for the momentum flux. Rollers appear to be more effective in transporting heat at high Richardson number, and their maximum contribution is delivered at
 $Ri_{b}=0.1$
. An identical behaviour is observed for momentum and heat flux only when buoyancy effects are very small, which corresponds to the range of validity of Reynolds analogy. Hence, it may be speculated that the previously noticed variation of the turbulent Prandtl number with
 $Ri_{b}$
is primarily caused by a different behaviour of the rollers.
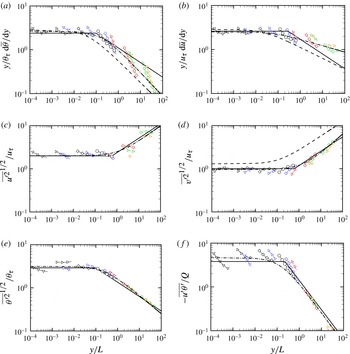
Assessment of MO similarity hypothesis for: (a) mean temperature gradient; (b) mean velocity gradient; (c) streamwise velocity variance; (d) vertical velocity variance; (e) temperature variance; (f)
 $u{-}\unicode[STIX]{x1D703}$
correlation. The solid lines indicate a compound of the scaling laws proposed by Kader & Yaglom (Reference Kader and Yaglom1990), the dashed lines denote the Businger–Dyer flux-profile relationships with classical values of the constants, whereas the dot-dashed lines indicate a fit of the DNS data (see table 3). See table 2 for nomenclature of lines and symbols.

5 Assessment of Monin–Obukhov similarity
A useful parametrization of the wall region in the presence of mixed convection is provided by the MO similarity theory (Obukhov Reference Obukhov1946; Monin & Obukhov Reference Monin and Obukhov1954). Starting from the assumption that the correct velocity scale in wall-bounded flows is the friction velocity
 $u_{\unicode[STIX]{x1D70F}}$
, and the only dimensionally correct length scale is
 $L$
as defined in (1.1), the following scalings result for the fully turbulent part of the wall layer
 $$\begin{eqnarray}\displaystyle \frac{y}{\unicode[STIX]{x1D703}_{\unicode[STIX]{x1D70F}}}\frac{\text{d}\overline{\unicode[STIX]{x1D703}}}{\text{d}y}=\unicode[STIX]{x1D711}_{h}\left(\frac{y}{L}\right),\quad \frac{y}{u_{\unicode[STIX]{x1D70F}}}\frac{\text{d}\overline{u}}{\text{d}y}=\unicode[STIX]{x1D711}_{m}\left(\frac{y}{L}\right), & & \displaystyle\end{eqnarray}$$
 $$\begin{eqnarray}\displaystyle \frac{\overline{u_{i}^{\prime 2}}^{1/2}}{u_{\unicode[STIX]{x1D70F}}}=\unicode[STIX]{x1D711}_{i}\left(\frac{y}{L}\right),\quad \frac{\overline{\unicode[STIX]{x1D703}^{\prime 2}}^{1/2}}{\unicode[STIX]{x1D703}_{\unicode[STIX]{x1D70F}}}=\unicode[STIX]{x1D711}_{\unicode[STIX]{x1D703}}\left(\frac{y}{L}\right),\quad \frac{-\overline{u^{\prime }\unicode[STIX]{x1D703}^{\prime }}}{Q}=\unicode[STIX]{x1D711}_{u\unicode[STIX]{x1D703}}\left(\frac{y}{L}\right), & & \displaystyle\end{eqnarray}$$
with
 $-\overline{u^{\prime }v^{\prime }}\approx \unicode[STIX]{x1D70F}_{w}$
,
 $-\overline{v^{\prime }\unicode[STIX]{x1D703}^{\prime }}\approx Q$
and the
 $\unicode[STIX]{x1D711}$
’s a suitable set of universal functions. The MO relations are widely used in the meteorological practice and as wall functions in numerical simulations of atmospheric circulation as they allow one to estimate momentum and temperature fluxes from mean flow gradients evaluated away from the wall (Deardorff Reference Deardorff1970; Stull Reference Stull2012). Regarding the choice of the universal functions, the typical approach (Kader & Yaglom Reference Kader and Yaglom1990) consists of interpolating between the extreme conditions of forced and free convection. For instance, regarding the scaling of temperature, it is expected that in forced convection a logarithmic layer of
 $\overline{\unicode[STIX]{x1D703}}$
forms, hence
 $\unicode[STIX]{x1D711}_{h}\approx k_{\unicode[STIX]{x1D703}}$
, where
 $k_{\unicode[STIX]{x1D703}}$
is the Karman constant for passive scalars (Kader Reference Kader1981). On the other hand, granted the validity of Prandtl’s theory of free convection (as from (4.1)), the scaling
 $\unicode[STIX]{x1D711}_{h}\sim (y/L)^{-1/3}$
would result. A frequently used representation for the universal functions of MO similarity theory is given by the Businger–Dyer flux-profile relationships (Businger et al.
Reference Businger, Wyngaard, Izumi and Bradley1971; Dyer Reference Dyer1974), which assume
 $$\begin{eqnarray}\unicode[STIX]{x1D711}_{h}=\frac{1}{k_{\unicode[STIX]{x1D703}}}(1+\unicode[STIX]{x1D6FE}_{h}y/L)^{\unicode[STIX]{x1D6FC}_{h}},\quad \unicode[STIX]{x1D711}_{m}=\frac{1}{k}(1+\unicode[STIX]{x1D6FE}_{m}y/L)^{\unicode[STIX]{x1D6FC}_{m}},\end{eqnarray}$$
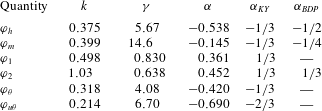
Coefficients of DNS data fits reported in figure 16, assuming functional dependence of the type
 $\unicode[STIX]{x1D711}=1/k(1+\unicode[STIX]{x1D6FE}y/L)^{\unicode[STIX]{x1D6FC}}$
. The coefficients
 $\unicode[STIX]{x1D6FC}_{KY}$
denote the expected power-law scaling exponents in the free-convection regime predicted by Kader & Yaglom (Reference Kader and Yaglom1990), and the
 $\unicode[STIX]{x1D6FC}_{BDP}$
those used in the classical Businger–Dyer and Panofsky relationships.

with the typical choice of constants (Paulson Reference Paulson1970)
 $k=k_{\unicode[STIX]{x1D703}}=0.35$
,
 $\unicode[STIX]{x1D6FE}_{m}=\unicode[STIX]{x1D6FE}_{h}=16$
,
 $\unicode[STIX]{x1D6FC}_{h}=-1/2$
,
 $\unicode[STIX]{x1D6FC}_{m}=-1/4$
. Hence, these relationships account for strong deviations of the mean temperature and velocity fields from the alleged
 $(y/L)^{-1/3}$
behaviour in the limit of light winds. Similar empirical relations have been proposed for the vertical velocity variances by Panofsky et al. (Reference Panofsky, Tennekes, Lenschow and Wyngaard1977), which are also included in the figure. In order to check the validity of the MO similarity predictions, the DNS data are reported in scaled form in figure 16. For that purpose, data have been collected in a limited part of the wall layer, identified under the somehow arbitrary conditions that: (i) the turbulent heat flux is higher than
 $90\,\%$
of the total flux; (ii) the turbulent momentum flux is higher than
 $90\,\%$
of its maximum value. These conditions basically identify the assumptions made by the MO theory that the viscous fluxes are negligible, and the total stress is approximately constant. In figure 16 we also show the asymptotic trends suggested by Kader & Yaglom (Reference Kader and Yaglom1990), as well as the results obtained by fitting the DNS data with Businger–Dyer-like distributions, with coefficients given in table 3. Figure 16(a) shows flat behaviour of the scaled temperature gradient up to
 $y/L\approx 0.1$
, followed by a global roll-off with power-law exponent close to the
 $-1/2$
value given by the Businger–Dyer relationships, but sensibly steeper than the
 $-1/3$
value expected in free convection. It should also be noted that the individual profiles are far from following the predicted scalings, but rather tend to obey much sharper inverse power laws, as previously discussed in figure 10(a). Similar observations have been occasionally made in the atmospheric flows literature (Khanna & Brasseur Reference Khanna and Brasseur1997), and attributed to the importance of
 $h$
-scaled circulatory motions, which would imply the inclusion of
 $h/L$
as an additional parameter in the MO functional relationships. Incidentally we note that, based on the present DNS data, we find that
 $h/L$
is approximately a unique function of the bulk Richardson number, namely
 $h/L\simeq 3.34Ri_{b}^{0.85}$
. The scaled mean velocity gradient (figure 16
b) also has a flat behaviour up to
 $y/L\approx 0.1$
, with very mild roll-off, likely shallower that the
 $(y/L)^{-1/4}$
given by the Businger–Dyer relationships, although the data scatter here is rather severe, and again individual profiles follow steeper power laws. It must also be noted that the data points at the right end of figure 16(b) correspond to low values of
 $Re_{b}$
and moderate values of
 $Ra$
, which might shed some doubt on the direct extension of the DNS trends to real-world flows. However, we believe that the trends are quite robust, in that the corresponding flows appear to be fully turbulent, as seen in the flow statistics shown in figures 12 and 13. Simulations at higher Reynolds number would be certainly welcome to support robustness of the trends, although they would require huge computational resources. As pointed out by Rao & Narasimha (Reference Rao and Narasimha2006), parametrization of the momentum flux in the presence of light wind under unstable stratification is a weak point of current weather forecast models, mainly because field experiments typically convey large scatter for obvious difficulties in achieving stable flow conditions, For instance, based on field measurements, Kader & Yaglom (Reference Kader and Yaglom1990) even argue about possible inversion of the
 $\unicode[STIX]{x1D711}_{m}$
curve at high
 $y/L$
which, however, finds no support in our data. DNS is especially valuable as sustained flow conditions are achievable, although higher values of the Reynolds number would be clearly desirable. The velocity and temperature fluctuations (panels c–e) globally follow the MO scalings quite well. Especially satisfactory is the behaviour of the vertical velocity and temperature fluctuations in the light-wind regime, as previously noticed regarding the free convection (see figure 10
b,d). This finding probably points to the fact that vertical plumes are well parametrized by MO similarity, whereas large-scale circulatory motions obey to a different scaling. In this respect, Panofsky et al. (Reference Panofsky, Tennekes, Lenschow and Wyngaard1977) pointed out that the correct scale for horizontal velocity fluctuations is probably the one defined by Deardorff (Reference Deardorff1970), namely
 $v_{D}=(\unicode[STIX]{x1D6FD}gQh)^{1/3}$
, which corresponds to Prandtl’s free-fall scale based on the channel height. Assuming
 $\overline{u^{\prime 2}}^{1/2}\sim v_{D}$
implies
 $\overline{u^{\prime 2}}^{1/2}/u_{\unicode[STIX]{x1D70F}}\sim (h/L)^{1/3}$
, hence explaining why the global trend of the streamwise velocity fluctuations with
 $y/L$
is increasing, whereas the individual profiles are decreasing with
 $y$
(also recalling the discussion made on figure 10
c). In this context it is quite surprising that the
 $u$
–
 $\unicode[STIX]{x1D703}$
correlation (panel e) satisfies the expected
 $-2/3$
scaling law in the free-convection regime (Kader & Yaglom Reference Kader and Yaglom1990), whereas the individual profiles have strong scatter under conditions of near-neutral stratification.
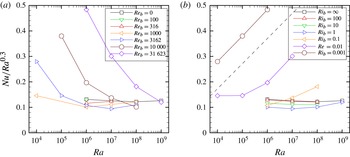
Compensated distributions of Nusselt number as a function of Rayleigh number, grouped into lines with same
 $Re_{b}$
(a) and with same
 $Ri_{b}$
(b). The dashed line in (b) indicates a
 $Ra^{0.45}$
power law.

6 Parametrization of heat transfer and skin friction
The prediction of heat transfer and aerodynamic drag under conditions of unstable stratification is a topic of obvious interest in engineering and meteorology. Given the absence of reliable theoretical mean temperature and velocity profiles for flow conditions far from neutral (Scagliarini et al. Reference Scagliarini, Einarsson, Gylfason and Toschi2015), we attempt to derive correlations based on the available DNS data. For that purpose, we preliminarily try to gain a perception for the behaviour of heat transfer and friction coefficients as a function of the governing parameters. In figure 17 we show the computed Nusselt number, defined as
 $$\begin{eqnarray}Nu=\frac{2Qh}{\unicode[STIX]{x1D6FC}\unicode[STIX]{x0394}\unicode[STIX]{x1D703}},\end{eqnarray}$$
as a function of the Rayleigh number, grouped into curves at constant Reynolds number (panel a) and constant Richardson number (panel b). Data are compensated by
 $Ra^{0.3}$
to better highlight scatter among curves. Panel (a) shows that data at sufficiently high
 $Ra$
tend to cluster around the free-convection (
 $Ra=\infty$
) distribution, with departures taking place at higher
 $Ra$
as the Reynolds number increases, suggesting that the Richardson number may be an important parameter to distinguish among different cases. The figure also shows that the Nusselt number is not a monotonic function of
 $Re_{b}$
for fixed
 $Ra$
, with the counterintuitive conclusion that some small amount of forced convection may yield reduction of the heat exchange with respect to the pure buoyant case, as also evident in panel (b). This effect is the likely consequence of sweeping of convective plumes by large-scale motions, with subsequent loss of efficiency in heat redistribution (Scagliarini, Gylfason & Toschi Reference Scagliarini, Gylfason and Toschi2014). Fitting the DNS data in the free-convection regime we obtain
 $$\begin{eqnarray}Nu(Ra)\approx 0.1165Ra^{0.304},\end{eqnarray}$$
with a power-law exponent not too far from that typically reported in this range of relatively low
 $Ra$
(Ahlers et al.
Reference Ahlers, Grossmann and Lohse2009; Orlandi et al.
Reference Orlandi, Pirozzoli and Bernardini2015b
). The effect of Richardson number reduction from pure buoyancy (see figure 17
b) is initially a downward translation of the
 $Nu(Ra)$
curve, with maximum reduction of up to
 $20\,\%$
at
 $Ri_{b}=1$
. Further reduction of
 $Ri_{b}$
yields a marked increase in the slope of the
 $Nu(Ra)$
curve, which tends to attain a
 $Ra^{0.45}$
slope in the forced convection limit. Fitting the DNS data herein reported in the
 $Ri_{b}=0$
limit as well as data at higher
 $Re_{b}$
(Pirozzoli et al.
Reference Pirozzoli, Bernardini and Orlandi2016) yields
 $$\begin{eqnarray}Nu(Re_{b})\approx 0.0073Re_{b}^{0.802}.\end{eqnarray}$$
A typical engineering approach (Bergman et al.
Reference Bergman, Lavine, Incropera and DeWitt2011) consists of using either (6.2) if
 $Ri_{b}\gtrsim 1$
or (6.3) if
 $Ri_{b}\lesssim 1$
. A convex combination of the two formulae is also sometimes used
 $$\begin{eqnarray}Nu(Ra,Re_{b})=(Nu(Ra)^{n}+Nu(Re_{b})^{n})^{1/n},\end{eqnarray}$$
with
 $n\approx 3$
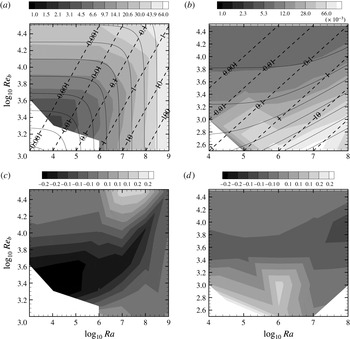
. The performance of (6.4), with the limit Nusselt distributions given in (6.2) and (6.3) is tested in figure 19(a) against a comparison with the DNS data in the mixed convection regime. The agreement seems to be fair in the whole parameter space covered by the simulations, although the formula cannot obviously capture the previously noticed slight reduction of
 $Nu$
with
 $Re_{b}$
which is observed mainly around unit bulk Richardson number. Quantitative information on the relative error in the prediction of
 $Nu$
is given in figure 19(c), which shows maximum relative error of approximately
 $20\,\%$
which is mainly confined in the low-
 $Re_{b}$
, low-
 $Ra$
range, whereas the standard deviation seems to be no larger than
 $10\,\%$
.
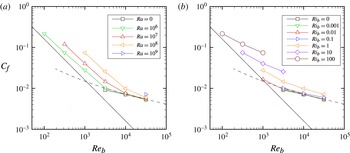
Distributions of friction coefficient as a function of Reynolds number, grouped into lines with same
 $Ra$
(a) and with same
 $Ri_{b}$
(b). The solid and dashed lines in (b) indicate the laminar Poiseuille curve
 $C_{f}=16/Re_{b}$
, and Prandtl’s friction law for turbulent channels (6.6), respectively.

The distribution of the friction coefficients, defined as
 $$\begin{eqnarray}C_{f}=2\unicode[STIX]{x1D70F}_{w}/(\unicode[STIX]{x1D70C}u_{b}^{2}),\end{eqnarray}$$
is shown in figure 18, grouped into curves with constant
 $Ra$
(panel a) and with constant
 $Ri_{b}$
(panel b). For the sake of reference, in the figure we also show the friction curve for laminar channel flow, and Prandtl’s turbulent friction law, derived by solving the equation
 $$\begin{eqnarray}\sqrt{\frac{2}{C_{f}(Re_{b})}}=\frac{1}{k}\log \left(\frac{Re_{b}}{2}\sqrt{\frac{C_{f}(Re_{b})}{2}}\right)+C-\frac{1}{k},\end{eqnarray}$$
with
 $k=0.383$
,
 $C=4.17$
(Pirozzoli et al.
Reference Pirozzoli, Bernardini and Orlandi2014). We find in panel (a) that increasing the Rayleigh number consistently yields an increase of
 $C_{f}$
, which however tends to saturate at high
 $Re_{b}$
. In the low-
 $Re_{b}$
limit the friction curves appear to be nearly parallel to the laminar curve, although the
 $Ra$
-dependent displacement suggests that the structure of the velocity field is different from the classical Poiseuille representation, as we previously pointed out. The same data reported at constant
 $Ri_{b}$
in panel (b) show a steady upward displacement of the friction curves with
 $Ri_{b}$
, which is suggestive of a possible parametrization of the friction coefficient in the form
 $$\begin{eqnarray}C_{f}(Ra,Re_{b})=C_{f}(Re_{b})f(Ri_{b}),\end{eqnarray}$$
with
 $C_{f}(Re_{b})$
given in (6.6). Fitting the DNS data we obtain the following empirical representation for the correction due to buoyancy
 $$\begin{eqnarray}\unicode[STIX]{x0394}f(Ri_{b})=(1+4.64Ri_{b})^{0.26}.\end{eqnarray}$$
The performance of the predictive formulae (6.7) and (6.8) can be appreciated in figure 19(b), where
 $C_{f}$
is shown in the
 $Ra$
–
 $Re_{b}$
plane. It appears that this simple parametrization correctly captures the increasing trend of
 $C_{f}$
in the presence of finite buoyancy, although quantitative agreement with DNS data is not perfect under all flow regimes. Similarly to the Nusselt number discussed above, quantitative information on the relative error in the prediction of
 $C_{f}$
is given in figure 19(d), which again shows maximum relative error of approximately 20 %, which is mainly confined in the low-
 $Re_{b}$
, low-
 $Ra$
range, whereas the standard deviation is no larger than 10 %.
Maps of Nusselt number (a) and friction coefficient (b) as a function of Rayleigh and Reynolds number. The coloured contours correspond to the DNS data, whereas the solid lines indicate fits obtained from (6.4) and (6.7). The dashed diagonal lines have constant
 $Ri_{b}$
. Twelve logarithmically spaced contour levels are shown for each variable, with
 $1\leqslant Nu\leqslant 64$
,
 $0.001\leqslant C_{f}\leqslant 0.1$
. In (c,d) we show the associated relative errors of the predictive formulae.

7 Conclusions
We have carried out direct numerical simulations of turbulent channel flows with unstable thermal stratification in a wide range of Reynolds and Rayleigh numbers varying between the extreme cases of pure free and forced convection. Concerning the large-scale structures, the most interesting effect of mixed convection is the formation of quasi-longitudinal rollers which fill the entire channel height, and whose spanwise aspect ratio may be very large, probably depending to some extent on the size of the computational box. It is worthwhile noting that this effect, absent in pure Rayleigh–Bénard convection and in the turbulent channel flow, shows up for a wide range of Richardson numbers (based on DNS data, we find at least
 $0.01\leqslant Ri_{b}\leqslant 100$
), and hence virtually in all situations where mixed convection is relevant. The core rollers can be interpreted as the turbulent counterpart of the Rayleigh instability modes, which are imparted a preferential direction by the mean shear. It should be noted, however, that the laminar rollers have a typical aspect ratio of unity, whereas turbulent rollers are typically much more oblate. Another interesting feature of turbulent rollers is their tendency to meander in the spanwise direction, again in a fashion reminiscent of the wavy secondary instabilities of laminar rollers. Maximum meandering seems to occur at
 $Ri_{b}\approx 1$
, whereas maximum ordering is found in conditions close to pure forced convection, namely
 $Ri_{b}\approx 0.01$
. The near-wall flow organization consists of the typical pattern of thermal plumes at
 $Ri_{b}\gtrsim 1$
, and of momentum streaks at
 $Ri_{b}\lesssim 1$
, with strong modulating influence from the core rollers. On a more quantitative ground, we have found that rollers contribute to a significant fraction of both momentum and heat turbulent fluxes in a wide range of Richardson numbers, which may be close to
 $100\,\%$
towards the channel centreline at around unit
 $Ri_{b}$
. We also find that rollers, especially in the high-
 $Ri_{b}$
regime, tend to be much more effective in transferring heat than momentum, which is a possible explanation for the failure of Reynolds analogies, also observed in previous experimental studies. Despite the simplified setting in which the present DNS are conducted, the above observations are to a large extent common to the context of atmospheric flows, in which two-dimensional structures are frequently observed.
While the flow statistics are well understood in the case of pure forced convection, things are not clear cut as the limit of free convection is approached. Specifically, in-depth analysis of the flow statistics shows that the mean temperature is far from the
 $y^{-1/3}$
scaling predicted by Prandtl based on the assumption that the flow is dominated by wall-attached plumes. Reasons for this discrepancy may be related to the importance of the core rollers in global redistribution of temperature which destroy strict wall scaling. Based on the present dataset, however, we cannot rule out the possibility that Prandtl’s scaling only emerges at Rayleigh numbers much higher than those considered in this paper and currently accessible to DNS. The same arguments are likely to apply to the horizontal velocity fluctuations, whose variance is decreasing with the wall distance, rather than increasing according to
 $y^{2/3}$
as required by plume-based scaling. On the other hand, vertical velocity and temperature fluctuations closely conform to the model predictions, hence suggesting that vertical motions are mainly controlled by thermal plumes. These findings have a large impact on classical parametrizations of heat flux and wall friction, mainly based on the Monin–Obukhov dimensional ansatz that wall-scaled mean flow gradients and fluctuations should be universal functions of
 $y/L$
. Based on the present DNS database, we find that this assumption is satisfied with reasonable accuracy, probably acceptable for ‘first-order’ estimates. However, we also find that the predictive accuracy of empirical formulae relying on MO similarity varies considerably depending on the variables. Specifically, we find that the individual profiles of vertical velocity, temperature variance and the
 $u$
–
 $\unicode[STIX]{x1D703}$
correlation follow the universal trends quite well. On the other hand, the profiles of mean temperature and velocity as well as the horizontal velocity variances only follow the theoretical trends in a global sense, whereas individual profiles show a radically different behaviour. This is likely to result from the coexistence of a plume-dominated scaling, with statistics varying with
 $y/L$
, and a core-dominated scaling, with quantities scaling as
 $h/L$
Panofsky et al. (Reference Panofsky, Tennekes, Lenschow and Wyngaard1977). Direct verification of this inference would require simulations covering individually a wide range of
 $y/L$
, which is only possible using simultaneously extreme values of
 $Ra$
,
 $Re_{b}$
, and certainly beyond the current DNS capabilities. A relevant outcome of the present study is a set of modified Businger–Dyer relationships for the various flow variables based on fitting the DNS data. Differences with curve fits of current use in meteorological parametrizations are generally small, except for the mean streamwise velocity, for which we recover a very mild
 $(y/L)^{-1/7}$
variation in the light-wind regime, which is sensibly different from the
 $(y/L)^{-1/4}$
of current use. This finding is potentially interesting as correct parametrization of the light-wind regime can have a large impact on the prediction of weather conditions featuring strong thermal instability, as is the case of the Indian monsoon circulation (Rao & Narasimha Reference Rao and Narasimha2006). The present DNS data are especially important for this purpose, as mean wind data in the light-wind regime are extremely scattered owing to difficulties inherent to field atmospheric measurements. We should, however, also recall that the high-
 $Ri_{b}$
regime is particularly challenging also for DNS, as it corresponds to the bottom-right corner of figure 1, where Rayleigh numbers are high but Reynolds number are rather low, thus possibly casting uncertainties on direct applicability of DNS data to the context of atmospheric turbulence. DNS of this flow regime at higher
 $Re_{b}$
and/or
 $Ra$
would be a topic of great interest in our opinion.
Of large practical interest is also the prediction of friction and heat transfer as a function of the bulk flow parameters. Regarding heat transfer, a peculiar behaviour is observed whereby the addition of bulk mass flow initially leads to a decrease of the Nusselt number down to
 $Ri_{b}\approx 1$
, and then an increase moving towards the forced convection regime. Reasonable estimates for
 $Nu$
, which however do not incorporate this effect, are obtained by simple geometric averages of the values found in the limits of free and forced convection. Empirical corrections to the classical heat transfer formulae valid for neutral channels are also established to incorporate the effect of buoyancy by fitting the DNS data. A simple parametrization based on the sole bulk Richardson number yields predictions with typical accuracy of approximately
 $O(10\,\%)$
in the range of the
 $(Ra,Re_{b})$
space under investigation.
Acknowledgements
This work was carried out on the national e-infrastructure of SURFsara, a subsidiary of SURF cooperation, the collaborative ICT organization for Dutch education and research. We also acknowledge PRACE for awarding us access to FERMI based in Italy at CINECA under PRACE project numbers 2015133124 and 2015133204. We also acknowledge that the results of this research have been achieved using the DECI resource Archer based in the United Kingdom at Edinburgh with support from the PRACE aisbl.