

Introduction
Corporate political strategies have enormous potential, delivering benefits to firms that deploy them. Among the advantages are the increase in regulated prices,Footnote 1 favorable decisions on merger and acquisition processes,Footnote 2 better financial performance for companies operating in regulated sectors,Footnote 3 and public grants.Footnote 4 Such strategies include all initiatives addressed to political institutions attempting to align their business environment with their preferences. In this context, lobbying is a frequently employed approach, which is defined as the strategic supply of politically relevant information to government representatives.Footnote 5
First, companies willing to lobby need to gain access to policymakers;Footnote 6 however this is a scarce good due to their time and resource constraints.Footnote 7 Nevertheless, access can lead to advantages, such as strengthening ties with political actors, access to information that decreases political uncertainties, and anticipation of changes within the political arena.Footnote 8 In addition, companies benefiting from this access may be able to influence the regulatory process. As a result, the expected benefits from the deployment of political activities also compel firms to compete in the political environment.Footnote 9
Previous research that investigated the determinants of access to politicians in the United States points towards campaign contributions as a significant factor.Footnote 10 Furthermore, research by Ansolabehere, de Figueiredo and Snyder Jr. (Reference Ansolabehere, de Figueiredo and Snyder2003) shows that expenditure on lobbying is much higher than expenditure on campaign contributions, leading to the conclusion that financial incentives may be used to open up access in order to lobby politicians. Indeed, other research suggests that firms will combine different resources, such as representative offices close to policymakers, campaign contributions, and outside lobbyists, in order to gain access to the political arena.Footnote 11
However, the same conclusion is not valid when analyzing firms’ access to the U.S. bureaucracies where money is not at stake. Even though their exchanges are more difficult to observe and are likely to occur either informally by email and telephone or during the formal procedures where interest groups are invited to give feedback on new rules,Footnote 12 it is well known that most participants in this procedure are business actors.Footnote 13 Also, further research confirmed the existence of informal exchanges during proposal developmentsFootnote 14 and regular interactions between business representatives and regulators in their routines.Footnote 15 Therefore, these findings suggest that business has a relative ease of access to the bureaucracy representatives. A plausible explanation is the ability of business representatives to provide regulators with expertise and tools that they would not be able to provide by themselves.Footnote 16
In this context, a broad understanding of lobbying dynamics must start with an understanding of the dynamics of access to the policymakers. Even if access does not mean influence, the former is a requirement to try to exert the latter.Footnote 17 Nevertheless, lobbying dynamics change according to the institutional setting as verified above. Indeed, some authors have already emphasized the relevance of the institutional environment in the choice of firms’ corporate political strategies.Footnote 18
In this research, we aim to broaden the knowledge about lobbying in the European Commission (EC, or also Commission). A remarkable institutional aspect is that the Commission has a hybrid nature. If we compare to the U.S. institutional setting, the Commission combines attributions of both congressional committees and regulatory bureaucracies.Footnote 19 Furthermore, its supranational characteristics bring additional constraints to the policymaking process, as well as the interdiction to use financial strategies that limit firms’ initiatives in the political arena. In such a context, lobbying dynamics are still unclear.
Moreover, the EC's portfolio of assignments includes many issues that have an impact on firms’ operating environments. Therefore, Brussels has become an important lobbying location, which has witnessed intense growth in the last few decades.Footnote 20 A brief examination of the figures illustrates this well: there are more than 2,300 business and trade associations registered for interest representation in the Commission and more than 500 firms with their headquarters or representative offices in Brussels.Footnote 21 Also, recent data on meetings between Commission representatives and interest groups indicate an uneven pattern of access among companies: while few of them had regularly accessed the Commission representatives, the majority had very few meetings with the Commission.Footnote 22 Such figures are consistent with the concept of competition in the political arena, and thereby the following question arises: why do any firms have more access to the representatives than others when lobbying the EC?
In this research, we propose that the hybrid institutional characteristics of the Commission will lead to high demand for expertise, but access to its representatives is scarce due to their time constraints. There is flourishing literature on the relevance of political knowledge, which is considered a valuable political resource in the development of corporate political strategies.Footnote 23 Thus, political knowledge would be an important factor to explain the difference of access among firms. To advance this hypothesis, we perform an empirical analysis using negative binomial regression relying on a unique dataset built from meetings between representatives of the Commission and interest groups, merged with information on firms. The results suggest that political knowledge accumulation can increase firms’ access to high-level officials within the Commission.
Thus, we expect to address two gaps in the literature of corporate political strategies with this research: an insufficiency of empirical studies to analyze firms’ strategies to lobby the EC and a lack of empirical evidence to support the role of political knowledge to the development of corporate political strategies, especially in what concerns access to political arenas. The paper proceeds as follows: Section 1 develops the concept of political knowledge. Section 2 describes the EU political environment and the main research concerning lobbying in this arena, while section 3 discusses how political knowledge affects it. In section 4, we explain the empirical approach. Finally, we present the results in section 5, and conclude with a discussion on the main findings in section 6.
Political knowledge: A valuable resource in the political environment
Many authors suggest that companies that own political resources and develop political capabilitiesFootnote 24 may be more effective in their political strategies, and may represent a source of competitive advantage in the political arena. These findings are anchored in the RBV perspective, which states that firms owning rare, inimitable, valuable, and non-substitutable resources have a sustainable competitive advantage because of imperfections in strategic market factors.Footnote 25 Dahan (Reference Dahan2005) attempted to identify which resources could be characterized as political ones. Thus, he performed a detailed analysis of the literature that culminated with the identification of three categories named primary, supporting, and complementary resources. Some examples are: expertise, financial resources, organizational structure, and reputation.
Indeed, Bonardi (Reference Bonardi2011) recognizes that the RBV framework is appealing to corporate political strategies research. However, he points out that the main political resources identified in the literature are based on information and money, which are not hard to imitate. Consequently, the RBV framework should embody a real exploration of corporate political resources. In an attempt to develop it further, Bonardi and Vanden Bergh (Reference Bonardi, Vanden Bergh, Lawton and Rajwani2015) explore the concept of political knowledge, which represents the organizational knowledge about the political environment. Therefore, companies owing political knowledge can develop political capabilities to help them achieve the intended political outputs.
They define two dimensions of political knowledge: institution-specific and firm-specific. The former consists of firms' knowledge about political environment dynamics, the identification of pivotal politicians, the policymaking process, and the mechanisms that enable participation in this process. The latter refers to the knowledge of the firms' value in the political environment, such as the political value of firms' business assets, practices, and strategies. Therefore, it means that firms are aware of their weight in the political environment, they can identify internally valuable information for the policymaking process, and they know how to communicate it to win the attention of policymakers. In this state, they suggest that firms that combine both dimensions of knowledge—meaning they have developed firm- and institution-specific knowledge—are more likely to generate a sustainable competitive advantage.
Hence, the development of firm-specific knowledge is consistent with the analysis of Barney (Reference Barney1986) on the sources of informational advantage through organizational analysis in strategic factor markets. While not uncommon, firms have access to internal information that is not available to their competitors. Then, if they manage to develop assets to create firm-specific knowledge in their organizations, it can be a source of competitive advantage.
Also, the development of institution-specific knowledge is aligned with previous research that underlined the relevance of institutional characteristics in terms of choosing corporate political strategiesFootnote 26 and defining whether or not a firm will be politically active.Footnote 27 In this context, the importance of the institutional environment is justified by the differences in the way in which institutions are organized and governance is developed within them. In practice, this means that the rules and the play of the game, which characterize the institutional setting, may impose constraints on organizations.Footnote 28
It is worth clarifying that the concept of political knowledge in management differs from its usual meaning in political sciences, which refers to the ability to predict the consequences of political actions.Footnote 29 In management, this concept approaches the tacit and explicit knowledge that is developed inside the firm aiming to improve its performance in the political arena. It is an intangible resource that can impact the design of corporate political strategies. For instance, firms with little political knowledge may prefer collective actions rather than independent initiatives.Footnote 30 The accumulation of political knowledge is strategic for companies that decide to be active in the political arena. Those that develop little political knowledge risk placing too much dependence on external resources, such as professional lobbyists, and consequently, they may lose the potential rents that come from political activities.Footnote 31
Indeed, there are several ways by which to acquire political knowledge. It can be internally developed as a part of a company's integrated strategy, whereby companies can learn either through their own experience or by observing their fellow companies. Nevertheless, it is unlikely that firms that operate in many countries are able to transfer their institution-specific knowledge from one political environment to another, due to their institutional differences. However, they may opt for investing in the means to obtain external knowledge by hiring a professional lobbyist or joining a business association.Footnote 32 These tactics are not mutually exclusive options, and they can be combined to intensify political action.Footnote 33 Generally, some issues that may also affect these choices are the financial resources available to invest in political activitiesFootnote 34 and the risk of disclosure of proprietary information.Footnote 35
Political environment and corporate political strategies in the European Commission
The European Union is a unique political system where member states transferred part of their decision-making power from the national to the supra-national level, with the aim of constructing the European single market. Concerning its policymaking process, three institutions are directly involved: the European Parliament, which is composed of elected representatives from all member states; the Council, which consist of government ministers from each member state; and the European Commission, the members of which are appointed by the heads of the member state governments.
The EU political agenda results from an inter-institutional dialogue that sets the overall political strategy. Then, the leaders of the EU member states determine the general guidelines that will be reflected in the political priorities fixed by the president of the Commission for the duration of his/her five-year mandate. In general, the ordinary legislative procedure is the main process for policymaking in the European Union. In this process, the Commission works as the agenda setter and drafts the first proposal of legislation. Thereafter, the proposal is submitted to bicameral approval, where the Council and the European Parliament will decide whether or not to approve it.
From this perspective, the Commission figures as the principal executive body of the European Union with a central role in the policymaking process.Footnote 36 Its involvement comprises of initiating policies, issuing rules and regulations, and monitoring policy implementation. With reference to its governance, decisions are taken by the college of commissioners through either consensus or majority voting. In their daily responsibilities, the Commission counts on the support of the Directorates-General (DG), the European Union civil service that performs technical activities, such as the development of policies and the preparation of legislation. They work as the “ministries” of the European Union. Furthermore, each commissioner is assisted by his cabinet, which consists of six to twelve policy advisors.
Nonetheless, the number of Commission staff members is relatively few, resulting in a pronounced need for external information and expertise.Footnote 37 As a part of the policymaking process, the Commission engages with stakeholders through several avenues—such as hearings and public consultations—before issuing legislative proposals. For instance, it includes working closely with consultative bodies that offer specialist recommendations in regards to policymaking—the “Commission Experts Groups.”Footnote 38 These groups, organized according to their differing policy issues, meet on a regular basis. They also involve members of the Commission, as well as a variety of external stakeholders, such as NGOs, member state authorities, associations, and firms. They represent the formal participation of interest groups in the policymaking process, and their selection is based on their expertise, which includes an examination of their potential to contribute to the policymaking process, as well as identifying possible conflicts of interest.
The protagonism of the Commission in the policymaking process, combined with the expectation that few changes will occur in the first legislation draft until final approval by the other EU institutions,Footnote 39 set it as the main target for lobbying at the EU level.Footnote 40 Thus, research that investigated this phenomenon demonstrated that a high percentage of business-related stakeholders are politically active, when compared to other kinds of groups.Footnote 41 Similarly, their decision to participate in the EU political scenario is related to their size and exposure to EU regulation;Footnote 42 however, the choice to engage in direct lobbying is positively related to economic factors, such as the sector's concentration and asset mobility specificities.Footnote 43
Additional relevant research from Coen (Reference Coen1998; Reference Coen2009) described the massive increase in lobbying within the Commission during the 1990s, characterized by a trend of individual lobbying assisted by outside lobbyists responsible for political monitoring. He suggested that the EC political arena is dominated by elite pluralism, meaning that many interest groups participate in the political process, some of them with more power than others. In practice, firms were encouraged to expand their political capabilities in order to engage in lobbying, both at the European and the national levels, due to the EC's need for external information. These firms became pioneers in representational activity by supplying information on several political issues, due mainly to their multinationalism. This enabled them to develop a kind of European credential, which resulted in their privileged access to the EC.
In this context, the EU institutions’ demand for expertise and legitimacy for their decisions appears to be the main driver for lobbying at the EU level. Indeed, in a comparative research of lobbying in the United States and the European Union, Mahoney (2008) described EU lobbyists as being very mild mannered, whereby they attempt to sway the policymaking process using technical, scientific, or legalistic arguments based on research. Additionally, she emphasizes that the EC appreciates the involvement of firms’ in-house lobbyists more than outsourced lobbyists, as the former are able to provide verifiable information.
According to Coen and Vannoni (Reference Coen and Vannoni2018), outside lobbyists are limited to helping firms build a trusting relationship with policymakers, thus, playing a complementary role to the in-house lobbyists in the EU lobbying process. They also conclude that this EU expertise-based lobbying may influence the organizational design of the government affairs departments of politically active companies. Their research indicates that firms would favor experienced in-house managers with specific competencies and in-depth knowledge of their sector.
Contrary to general belief, instead of describing business participation in European politics as a pervasive influence, one should recognize that the Commission needs information from external stakeholders in order to improve its decisions, and its policymaking process is constructed so as to utilize this. Bouwen (Reference Bouwen2002) identifies such demand as access goods. This is crucial information related to expert knowledge or European or domestic interests that enables information suppliers to develop close relationships with the EU representatives. According to this theory, stakeholders that could better supply access goods will gain access to the European institutions. In the particular case of the Commission, its need to support the legitimacy of its decisions leads to the hypothesis that large individual firms will have more access to lobbying the Commission. However, it is worth underlining that business actors may compete for different outcomes in some salient policies,Footnote 44 thus, resulting in a strong competition between firms for access to the EC.
Political knowledge: An approach to understanding firms’ access to the European Commission
Considering the Commission situation, on the one hand, it has a demand for external information and will welcome firms that can provide it. On the other hand, access is a scarce good due to the time constraints of its representatives. In practice, we see that some firms have privileged access to the Commission, although it is still not clear what determines this privilege.
Furthermore, both EU institutional environment aspects and clues from the literature that pointed towards an expertise-based lobbying lead us to consider that political knowledge has an important role in explaining firms’ differing levels of access to EC representatives. In this sense, we continue in this section discussing how firms can develop their political knowledge in the EU political arena and, therefore, increasing their access to the EC.
There are many ways to build and accumulate political knowledge in the European Union. For instance, the establishment of a representative office in Brussels enables the extension of political networks and closer follow-up of European debates. Moreover, market-based solutions, such as hiring lobbyists who know the policymaking process and most likely have political ties, are available. It is also possible that large businesses would have an advantage in accumulating political knowledge due to their familiarity with the markets and the sectors in which they operate. Nonetheless, it is possible that these sources of knowledge are effective in increasing access to the EC due to other mechanisms, such as network issues or market power. That being so, we propose exploring the importance of political knowledge through other dimensions that are more anchored to its accumulation in the EU context: experience, the participation in expert groups, and operation in priority sectors according to the EU political agenda.
Initially, experience is an essential component of knowledge. Firms with more experience in lobbying accumulate more political knowledge due to previous interactions in the political arena. It allows intra-firm sharing of tacit knowledge and transforming it into explicit knowledge. Therefore, they are more familiar with the policymaking process and institutional environments. Schuler and Rehbein (Reference Schuler and Rehbein1997) propose that firms need the will and ability to become politically involved, and experience is one of the factors to influence this. Additionally, previous research demonstrates that experience in dealing with regulators has been significant in relation to favorable decisions made about regulated price adjustments.Footnote 45 This suggests that experience is valuable and helps to develop political knowledge, and leads us to our first hypothesis:
H1:
Firms with more experience lobbying at the EU level will have more access to the European Commission.
Furthermore, participation in the expert groups is also an alternative to developing political knowledge in the EC, considering that it formally calls for external advice. In this environment, participants have contact with several stakeholders in the political arena, where they can create connections with the staff of the Commission. As participants gather more information about the political agenda, they also develop a social network in which they can exchange knowledge. Therefore, companies benefiting from this opportunity acquire institution-specific knowledge. Also, the admission process analyzes companies’ potential to contribute to discussions. It legitimates them as actors with recognized expertise in a policy domain, thereby indicating that they must have firm-specific knowledge. For example, according to a report from ALTER-EU (2018), there is intense business participation in the expert groups dealing with financial, gas, and trade domains—which are reported as being successful in shaping policy discussions in the European Union—because the Commission recognizes their expertise. Thus, we propose the second hypothesis:
H2:
Firms that participate in commission expert groups will have more access to the European Commission.
It is noteworthy that access to the Commission is not only based on firms' efforts but also on the Commission's interests, which is related to firms' ability to provide relevant information to the policymaking process. Hence, considering that Commission representatives face time availability constraints, they will favor listening to firms that can address issues that are priorities in their political agenda. Consequently, if companies are fortunate enough to have knowledge that fits these priorities, they will receive more attention from the representatives of the Commission and, consequently, more access to them.
For instance, the Digital Single Market is a current priority. Therefore, companies in the telecommunications sector can provide meaningful information concerning the target policy domain. These firms have a natural advantage to be able to supply the Commission with relevant, firm-specific information aligned to the needs of the Commission, leading to advantages regarding access.
By contrast, it would be more difficult for companies in other sectors to raise the same level of interest from the Commission and, consequently, it would impact their probability of meeting a commissioner (although, they may try to arrange it). For example, The Walt Disney Company met with the Commission in order to highlight the role of creative industries in the Digital Single Market. Likewise, TetraPak met with the Commission to discuss the circular economy in relation to environmental policies (currently another priority). Therefore, companies in non-priority sectors can also access the Commission, either by linking their activities to a priority or by approaching general issues, such as general regulatory issues. However, companies in sectors directly impacted by political agendas receive intrinsic benefits because of their firm-specific knowledge. This leads us to our last hypothesis:
H3:
Firms that operate in sectors that are priorities in the political agenda will have more access to the European Commission.
Empirical approach
To bring some novelty to the empirical research on lobbying in the European Union, we rely on a new dataset built from the merger of two primary sources: information about the Commission meetings with interest groups and the Transparency Register (TR). A new perspective for research on lobbying in the Commission came from an official decision in 2014 stating the mandatory requirement to publish information on all meetings involving the commissioners, the members of their cabinets, and directors-general with third parties.Footnote 46 Through the stakeholder name, we obtain further information from the TRFootnote 47 database.
The TR is a non-mandatory register that contains basic information about interest groups intending to participate in European policymaking discussions. The register is valid both for the Commission and the European Parliament. Despite its voluntary character, interest groups are impelled to register because some lobbying activities are restricted to registered stakeholders, such as participation in expert groups and meetings with commissioners. Thus, the TR contains more than ten thousand registrations, from amongst associations, NGOs, professional lobbyists, small and large firms, and others. Some of the available information includes stakeholders' basic financial information, lobbying resources, and interest representation information. It is the main source of lobbying information at the EU level and has already been exploited by previous researchers.Footnote 48 It is worth highlighting that among the fourteen hundred meetings that occurred during the period studied, only 1.5 percent of meetings included a non-registered interest group.
To enrich the dataset, we have added information about membership of the expert groups and the economic sector using Thomson Reuters Business Classification (TRBC).Footnote 49 We also differentiate between small and large companies using both the Fortune Global 500Footnote 50 list for 2016 and 2016 Forbes World's Biggest Public Companies.Footnote 51 Furthermore, we consider the top four European business associations with access to the EC in order to identify participants in the main coalitions, which are BusinessEurope,Footnote 52 DigitalEurope,Footnote 53 Eurocommerce,Footnote 54 and American Chamber of Commerce to the European Union.Footnote 55 Only the associations with more than fifty meetings registered during the period were studied, representing 7 percent of the total of this category, which is composed of more than 750 business associations.
The resulting sample is a cross-sectional dataset including 1,845 observations that represent worldwide companies registered in the TR in December 2016. In the final sample, 808 observations showed meeting with an EC representative at least once during the period studied—from December 2014 and December 2016—whereas 1,037 had no meeting during this period. The dataset dismissed 210 observations that were either missing relevant information for the analysis or misclassified as companies.
Measures
The dependent variable is a measurement of access to the Commission. We operationalize it through the number of meetings a company had with a commissioner, a member of the commissioner's cabinet, or director-general during the two-year period observed.
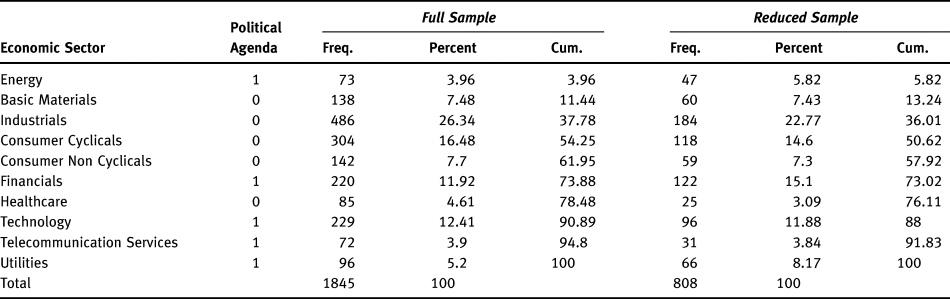
The independent variables associated with political knowledge include Experience which is measured by the number of years a company is active in the TR for interest representation. Expert Group is a dummy variable that takes true value for companies that have any membership status in any Commission expert group, as extracted from the official webpage of EU expert groups. Sector in EU Political Agenda is also a dummy that identifies sectors directly involved in the priorities established by the Commission. The priorities related to economic sectors are Energy Union, Digital Single Market, Economic, and Monetary Union. Therefore, using the TRBC ten major economic sectors as a reference, energy, financials, technology, telecommunication services, and utilities were set as priorities, whereas basic materials, industrials, consumer cyclicals, consumer non-cyclicals, and healthcare were not considered to be priority sectors.
We also include some variables associated with the deployment of corporate political strategies that can influence access. Brussels Office is a dummy variable that identifies, from the TR database, whether a company has either a representative office or headquarters in Brussels. Lobbyist is a dummy to identify if an outside professional lobbyist is representing the company, and also comes from TR. Large Companies is a dummy variable that takes true value for the companies that appear either on the Forbes list, “The World Biggest Public Companies” or the Fortune Global 500 list. Business Association is another dummy variable to classify if a company has membership in one of the main associations identified in the previous subsection.
Finally, the dataset contains other variables extracted from the declared information in the TR: full-time equivalent people involved in lobbying activities (FTE); number of people accredited access to the European Parliament (Parliament); expenditure with lobbying activities measured in thousands of euros (Lobbying Costs); and a dummy variable that indicates if the company is from the European Union (EU Country). These are variables that could interfere with the level of access of firms to the EC, although the hypotheses do not contemplate them.
Analysis
The analysis follows the characteristics of the dependent variable: a count variable that is discrete and non-negative. The classical least squares regression methods may present estimation errors when the variable has the mentioned characteristics.Footnote 56 The count models are adequate for this type of data because it considers all its specificities in the regression.
The basic approach to analyzing count data is by using the Poisson model. However, one of the principles of the model is the equidispersion of the variable, meaning that the variance and the mean must present the same value. When a violation of this condition occurs, another model should be employed to avoid misspecification of the regression components. If there is data overdispersion, which is the case of the dependent variable number of meetings, then, for the most part, the negative binomial model is used. The negative binomial model derives from a Poisson-gamma mixture distribution where an additional term is incorporated to accommodate overdispersion. In a Poisson model, μ represents the variance, whereas μ + μ2/v is the variance in the negative binomial model, where μ2/v is the gamma variance, and v is the gamma shape parameter corresponding to the overdispersion.Footnote 57
A challenge to our analysis is the excess of zeros in the sample. Only 43 percent of the firms had a meeting during the observed period. We cannot assume that all firms have attempted to meet with representatives of the highest level of hierarchy within the Commission, as they may have been pursuing other lobbying initiatives, such as targeting Parliament or participating in public consultations. On the other hand, there is a risk of selection bias if we only consider the observations that account for at least one meeting. To deal with this, we run two types of analysis in order to test our hypotheses. The first includes the full sample with the excess of zeros leading us to employ a zero-inflated negative binomial (ZINB) regression. The second considers only the 808 observations that account for a meeting so as to focus on the difference in access among companies that have selected the EC as a target for lobbying. Thus, we employ a zero-truncated negative binomial (ZTNB) regression.
The existence of zeros in the sample is a principle valid both for the Poisson and negative binomial models. The excess or absence of zeros is a violation of the model, which would result in estimation errors if not treated.Footnote 58 The variable number of meetings violates this condition in the two types of analysis we propose. Thus, it justifies the use of ZINB and ZTNB models that deal with all of the specificities of the dependent variable.
Before running the regression, it is necessary to certify that overdispersion is real instead of apparent. The use of negative binomial models for apparent overdispersion can also lead to the wrong specification of the estimators. Our data present a very high Pearson statistic which denotes overdispersion. Some tests were performed to check the following: (i) the apparent overdispersion caused by outliers; (ii) the omission of explanatory variables; and (iii) link problems. The results indicate real overdispersion. We used different configurations of regressions to test (i) and (ii) that indicated the persistence of high Pearson statistic, whereas test (iii) was performed by the Tukey-Pregibon link test that calculates the hat matrix diagonal statistic after modeling the data.
Furthermore, some tests, such as Z-score and Lagrange Multiplier, evaluate overdispersion. They analyze if the amount of overdispersion in a Poisson model is sufficient to violate assumptions. The Z-score test is based on t-test probability whereas the Lagrange multiplier evaluates chi2 statistics.Footnote 59 We ran both tests and, according to their results, we can reject the hypothesis of no overdispersion. Finally, the observation of the results of the likelihood ratio test ensured that a negative binomial model is more appropriate than a Poisson model, while the Vuong test ensured that the zero-inflated approach is better than the standard negative binomial approach for the full sample.
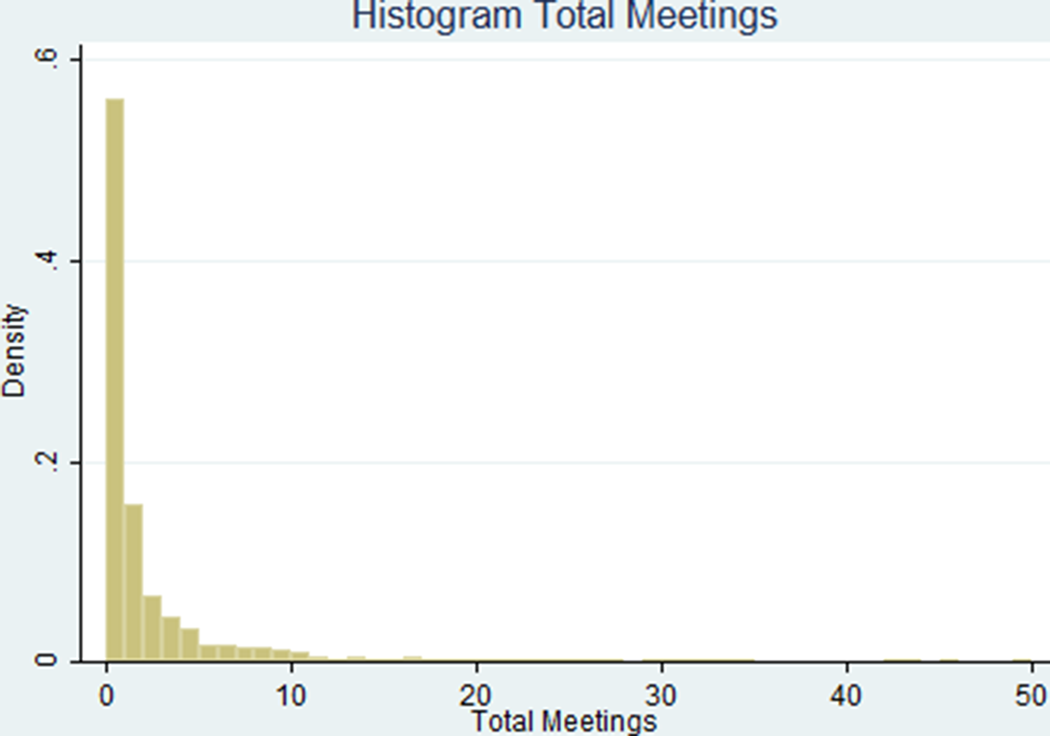
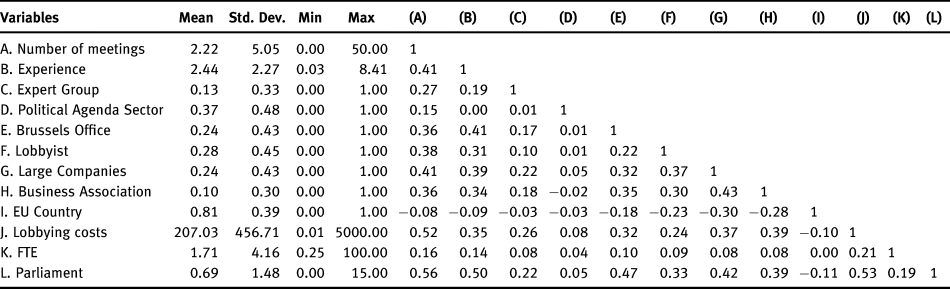
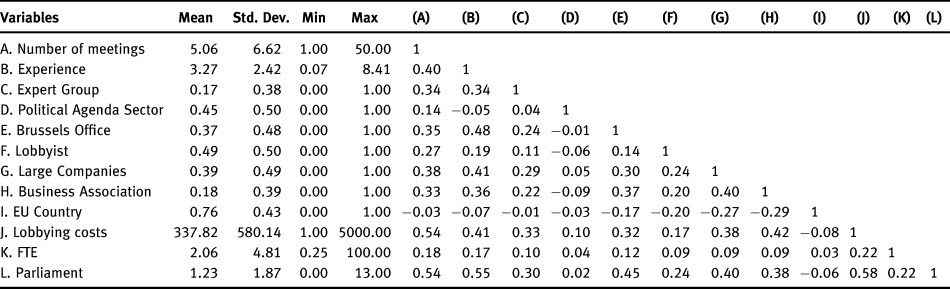
We present in figure 1 the histogram of the dependent variable number of meetings. Table 1 and table 2 present, respectively, a summary of the variables, as well as the correlation matrix for the full sample and the reduced sample. Table 3 presents the frequency distribution of firms among sectors.
Histogram

Descriptive Statistics and Correlation Matrix - Full Sample - 1845 observations

Descriptive Statistics and Correlation Matrix - Reduced Sample (Only firms with at least one meeting) - 808 observations

Distribution per Economic Sector

Results
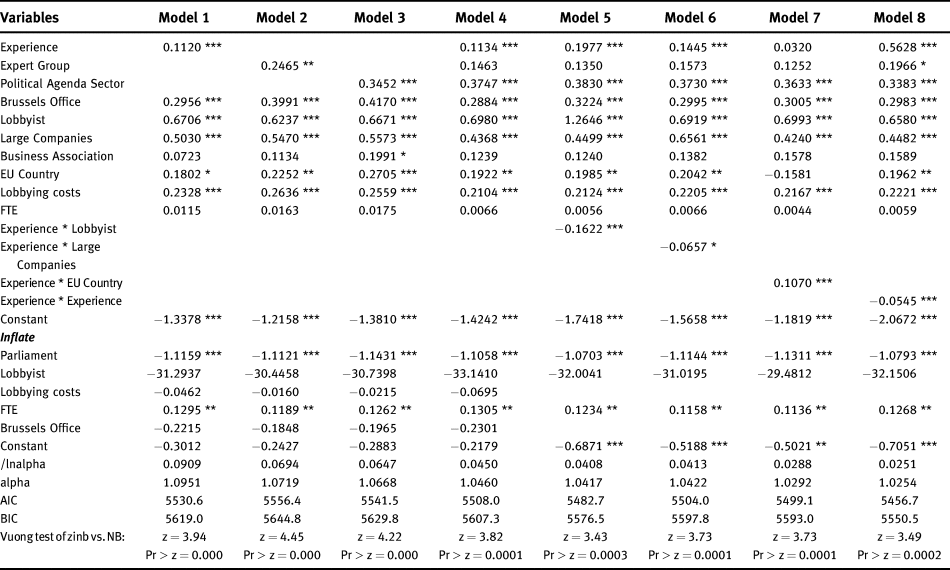
Table 4 shows the results of the analysis with the full sample using a ZINB regression. It is a two-part regression that models zero counts using both the binary and count processes. It assumes that zeros may have two different origins: a failure, or merely no attempt, to achieve the expected result. Therefore, the binary part, also known as the inflation process, uses predictors to define the results of the binary process, and then a negative binomial regression analyzes the count process.Footnote 60 The binary process uses a logit regression, and it is noteworthy that it estimates the probability of a zero observation.
Zero-Inflated Negative Binomial Regression Analysis - Number of Observations: 1845

* p < .10, ** p < .05, *** p < .01
The logical approach of ZINB fits our sample. Zero meetings indicate either the Commission's refusal of a meeting request or no attempt to organize it. It is important to emphasize a difference between the binary and the count processes. The former is related to the willingness of the firms that will make an effort (or not) to organize a meeting, whereas the latter represents the willingness of the Commission to meet that firm. The count process is the one we are interested in so as to test our political knowledge hypothesis.
However, we need to understand the two processes that generate zeros to set the predictors of the ZINB regression. We propose that firms aiming to meet the representatives of the Commission will invest in lobbying activities and the expansion of their lobbying network. Consequently, the variables Brussels Office, Lobbyist, Lobbying Costs, FTE, and Parliament could be good predictors. Because some of them may also explain the count process, they are present in both parts of the regression.
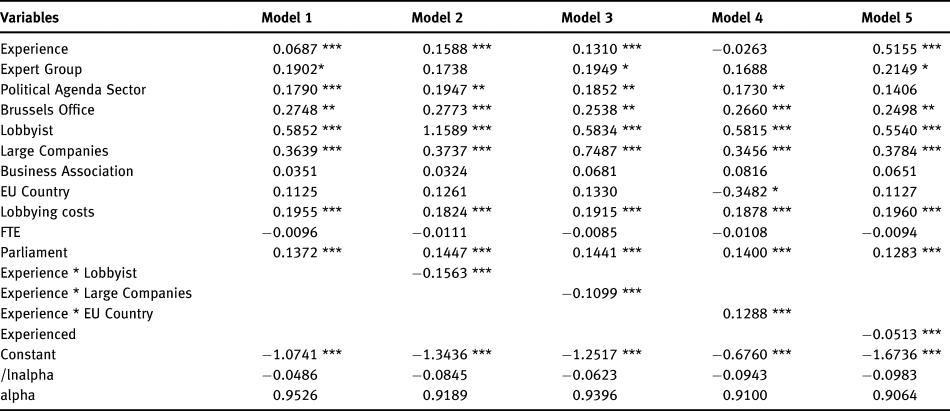
First, we regress the dependent variables on one of our variables linked to the hypotheses and other control variables, as shown in models 1 to 3. In model 4, we include three measures of political knowledge together. Finally, on top of model 4, we investigate some interactive effects in models 5 to 8. Specifically, we focus on the interactions between Experience and other variables of the models that characterize the firms. From our set of independent variables, Experience is the one that most explicitly symbolizes knowledge accumulation. Therefore, the interactions can give us further understanding of political knowledge building at the EU level, and how it affects firms’ access to the Commission. Also, from model 5, we dismiss some variables in the inflated part that were not significant. This reconfiguration took into consideration the results of Akaike's (AIC) and Bayesian (BIC) information criteria.
In the inflated part of the regressions, we note that the number of accredited people with access to Parliament, and the full-time equivalent people, are all predictors of positive counts. Taking into consideration that the inflated part measures the probability of zero, we can interpret that the more people with access to Parliament increases the possibility of a meeting, while the more people working in lobbying activities decreases it. People accessing Parliament are lobbying the European deputies that are also part of the hierarchy of targets for EU lobbying. This result suggests that the number of people reaching targeted representatives is more relevant than the size of the team. Contrary to our initial idea, lobbying expenditure and a representative office in Brussels are not good predictors of positive counts.
In general, the estimation results are consistent with our hypotheses. Models 1 to 3 show that our measures of political knowledge, namely, Experience, Expert Group, and Political Agenda Sector, are significant with a correct sign in explaining the number of meetings. When all three measures are included in one single regression in model 4, only Experience and Political Agenda Sector are significant. Unsurprisingly, and aligned with the current state of the art, Brussels Office, Lobbyist, Large Companies, and Lobbying Costs are also positively correlated with access to the Commission.
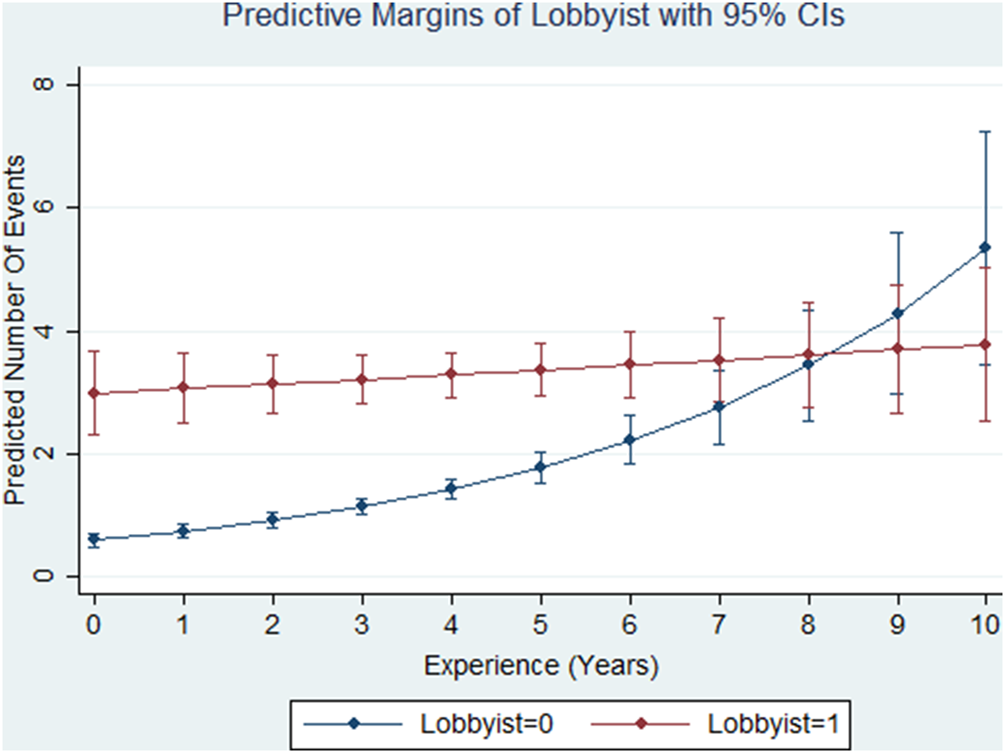
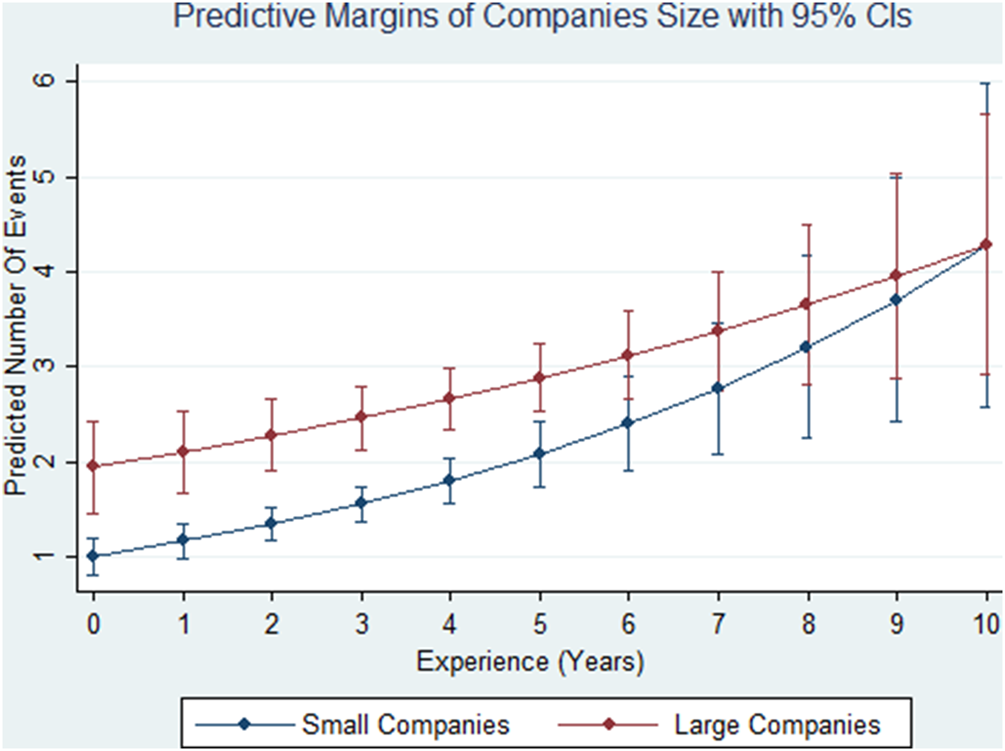
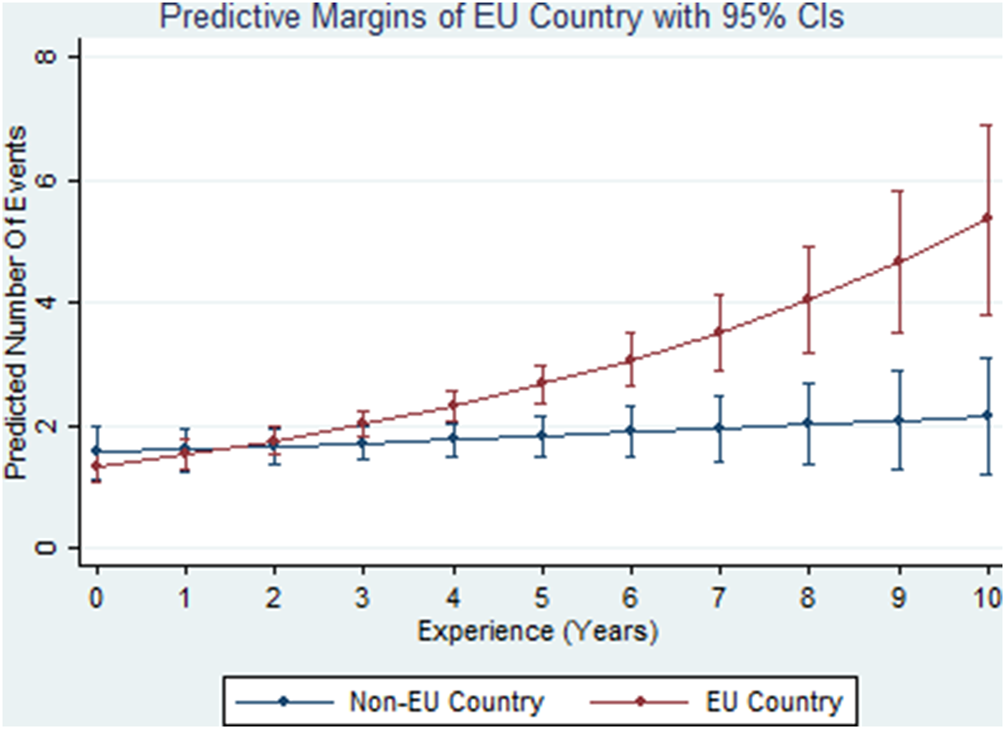
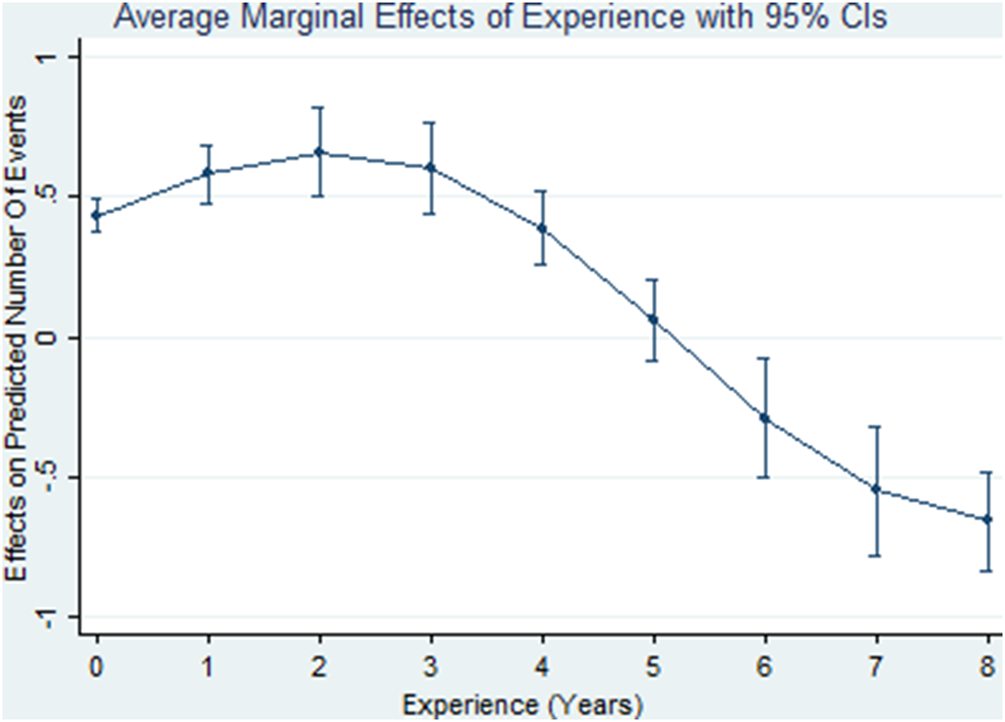
We are interested in the possibility that experience may interact with other variables, and that the effect of experience may diminish over time. In model 5, the interaction of Experience and Lobbyist is included. The interaction is negative and significant, and, therefore, experience is more relevant for companies that do not hire an outsourced lobbyist, as illustrated in figure 2 through the predictive margins. In other words, an additional year of experience impacts less when the stakeholders hire professional lobbyists, while doing so is associated with a higher number of meetings. In model 6, we interact Experience and Large Companies and find that it is negative and significant, suggesting that experience can compensate in some way for the advantage in terms of firms’ size to gain access to the Commission. Refer to figure 3; given the same level of experience, small companies are, on average, associated with fewer meetings, but are not significantly different from large companies at a sufficiently high level of experience. In model 7, we find that the interaction between Experience and EU Country is positively significant. It is easier to interpret this effect through the predictive margins’ graphic shown in figure 4. At a low level of experience, companies from both EU and non-EU are almost identical in terms of the number of meetings, but the effect of experience on the former is established quickly and produces a significant difference. The flat curve of non-EU companies shows that experience is almost irrelevant for non-EU companies. Finally, we add the squared term of Experience to model 8, which is negative and significant. Figure 5 shows the average marginal effects of Experience. The marginal effect is positive in the beginning, reaching its peak at two years, but falls to almost zero at roughly five years. Beyond five years, the marginal effect becomes negative. This result suggests that the effect of experience is more pronounced when the companies are still new to the EU lobbying framework.
Predictive Margins of Lobbyist

Predictive Margins of Companies Size

Predictive Margins of EU Country

Average Marginal Effects of Experience

To confirm our results, we performed a ZTNB regression only with the 808 observations that accounted for at least one meeting. Unlike the ZINB, this is a one-part regression without predictors. Following the rationale of table 4, we run the ZTNB regression in different configurations in order to analyze the effects of the interactions. The results presented in table 5 support our hypotheses H1 and H3; both Experience and Political Agenda Sector are significant. However, Expert Group is less significant and not a robust result. Likewise, the results of interactions are equivalent to the previous analysis. It is interesting to note that according to the ZTNB, the nationality of the companies is not a determinant factor in obtaining privileged access to the EC. A possible explanation is that many non-EU companies, mainly American ones, are able to establish a good relationship with the Commission due to their major role in sectors, such as Google, Microsoft, and Facebook. Finally, we observe that the participation in business associations was not significant in both analyses. This suggests that collective strategies may not be an effective way to leverage access to individual strategies in the EU political arena despite its potential to provide some institution-specific knowledge.
Zero-Truncated Negative Binomial Regression Analysis - Number of Observations: 808Variables

Likelihood-ratio test of alpha = 0: Prob>=chibar2 = 0.000 for all models
* p < .10, ** p < .05, *** p < .01
To summarize, our results suggest that, ceteris paribus, lobbying experience, and operating in a sector that focuses on the political agenda are important factors to help gain access to Commission representatives, while attending expert groups is a less relevant one. It demonstrates the relevance of the accumulation of political knowledge for the deployment of corporate political strategies within the Commission. Moreover, the results also corroborate the relevance of other characteristics and tactics, such as firms’ size, the use of outside lobbyists, and the establishment of a representative office in Brussels, as previously discussed in the literature.
Discussion on potential endogeneity
A likely source of endogeneity is reverse causality. Political knowledge impacts on political connections and, thus, on the number of meetings, but causality may go in the opposite direction. We discuss each variable of interest in order. We measure Experience by the years the stakeholders have been registered in the TR, which has been exogenously determined in the model. The decision to register has been made before any meetings have been arranged. Although there could be common factors that drive two variables at the same time, they are very likely associated with those characteristics of stakeholders for which the model has controlled.
For Political Agenda, one may argue that lobbying efforts influence it. However, we should be aware that successfully fixing an agenda would require much coordination among firms within the sector, which is hardly achievable as they operate in different member states where economic and political constraints are far from identical. Political agenda priorities are results of inter-institutional dialogues, thus, leaving little room for lobbying and, consequently, leading us to discard such any possibility of reverse causality associated with Political Agenda.
Lastly, the correlation between Expert Group and the number of meetings could be subject to reverse causality even if there has been a procedure to ensure the positions are judiciously assigned. The potential possibility of reverse causality would have strengthened the positive correlation between Expert Group and the number of meetings. Therefore, we employed a two-stage instrumental variable approach to tackle the problem. The first stage is an OLS regression in which Expert Group is explained by the instrumental variable Business Association and other variables. Business Association is a reasonable pick as it does not significantly explain the number of meetings, as shown in table 4 and 5, and the Commission would appoint some expert group members according to the nominations made by representative EU-level associations.Footnote 61 The second stage is the same negative binomial regression, except that Business Association is taken away and the residual of the first stage is now included. We do not find a robust and significant effect of Expert Group.Footnote 62 Nonetheless, Expert Group is not a robust predictor of the number of meetings, as shown in our baseline results of table 4 and 5.
Discussion
In this study, we investigated the determinants of firms' access to the European Commission. Some researchers have analyzed the dynamics of European lobbying, yet few have analyzed it empirically. During the 1990s, many companies established offices in Brussels, aspiring to participate in the European policymaking process. Several researchers have studied this phenomenon and how the lobbying strategies have evolved through the years, from a national approach to a more sophisticated one that includes supra-national strategies. Much research has confirmed this corporate interest, and some research theorized that a number of stakeholders enjoy privileged access to Commission representatives.
In general, theories related to lobbying dynamics in the European Union are quite convergent concerning access differentiation. Indeed, the number of business-related stakeholders that have established an office in Brussels strongly suggests that there is substantial corporate interest in the European Union. This is reinforced by the share of meetings that include these stakeholders, reaching 68 percent of the total, according to our data. Therefore, one of the missing pieces in the Commission lobbying puzzle has been a quantitative analysis, which provides some empirical support to confirm the theories already developed, related to the dynamics of access. We aim to fill this specific gap by performing further investigation on the determinants of firms' access to EC representatives.
In this research, we propose that firms' accumulation of political knowledge is associated with their level of access to the Commission. Considering the two dimensions of this knowledge—institution-specific and firm-specific, as developed by Bonardi and Vanden Bergh (Reference Bonardi, Vanden Bergh, Lawton and Rajwani2015) —we discuss various ways in which firms build political knowledge in the Commission context and how this leads to more access to its representatives. The reported analysis relies on a new dataset built from the merger of the Commission representatives’ meetings information, the TR database and additional firms' data. Our sample has 1,845 companies 808 of which held a meeting with the Commission during the two-year period of analysis. The strength of this dataset is the establishment of a direct measure of access to representatives, that is, the number of meetings. Before meeting detail information was made available, researchers relied on different measures. For instance, Hermansson (Reference Hermansson2016) measured privileged access through participation in exclusive public fora. Eising (Reference Eising2007) used surveys to analyze business associations and firms' access. Bernhagen and Mitchell (Reference Bernhagen and Mitchell2009) made direct lobbying operational through a combination of firms' parameters, such as a Brussels office, the use of an external lobbyist and the existence of an EU affairs representative. Although these approaches provide some clues about lobbying dynamics, they are less precise in measuring the level of direct lobbying activity.
Our results support the relevance of political knowledge accumulation for gaining more access to the EC. The lobbying experience and the sector included in the political agenda were significant in every analysis performed. However, we did not find support for the hypothesis that links expert group membership to access. In addition, experience appeared as a relevant factor to compensate for the impact of the firms’ size in obtaining access, plus the absence of a professional lobbyist to leverage their political actions, despite this effect fading in the long term. Furthermore, other variables included in the analysis, such as firms’ size, use of outside lobbyists, and the existence of a representative office in Brussels, presented extremely robust results, suggesting they are also relevant to access.
Thus, our contribution is twofold. Firstly, it extends the knowledge about corporate political strategies in the EC, a hybrid institution that has both agenda-setter and regulatory responsibilities. Thus far, there is a scarcity of data, which holds back the development of quantitative studies. Our novel dataset allows us to shed some light on the dynamics of access and complement previous research on EU lobbying. Secondly, we empirically test the relevance of political knowledge to the deployment of corporate political strategies. Even if previous research hinted about its importance, no empirical research has directly analyzed it. We show that political knowledge is important to access policymakers and smooth the effects of some potential disadvantages in the political arena such as being a small firm or lacking the support of an outsourced lobbyist. These findings provide useful insights for companies planning to deploy political strategies in Europe.
It is worth discussing how our findings relate to the existent literature. For instance, Coen (Reference Coen1998; Reference Coen2009) described the emergence of a European identity for some companies that resulted in privileged access; the elite pluralism phenomenon. According to the analysis provided in this article, this identity is probably built and sustained through the accumulation of political knowledge. We confirm that the main characteristics of the companies identified in the elite pluralism (firms’ size, office in Brussels, and lobbying experience) are relevant factors for access.
Moreover, these findings are also consistent with the theory proposed by Bouwen (Reference Bouwen2002). He hypothesizes that companies that are able to provide access goods would gain more access to the Commission, and refers to value-added information supplied by companies during the policymaking process. In the context of this research, access goods are equivalent to the outputs of political knowledge of firms. Our findings are also convergent with the results of Hermansson (Reference Hermansson2016), who suggests that stakeholders’ expertise is a relevant dimension for the Commission.
We also analyze the impact of the economic sector on the level of access. Vannoni (Reference Vannoni2012) hypothesized that the different weight of economic sectors in direct lobbying due to the Olsonian argument attributes access to industry concentration. In a different way, in this research, we suggest that the participation of various sectors is related to policy agenda setting. Our results confirm that most of the sectors operating in those areas that are considered priorities to the European legislation are more easily able to access EC representatives.
Despite these interesting results, some limitations of this study should be noted. First, lobbying in Europe involves all EU institutions, as well as national institutions. In this research, we focus on the EC, and, thus, we do not have the complete picture of inter-institutional dynamics. Additionally, meeting information is only available for high-level Commission officers, but lobbying also occurs at the operational levels of European institutions. An interesting finding in this research is the relevance of the number of people accredited with access to Parliament. The results indicate that this variable is important for both the binary and count processes. It points towards a relationship between lobbying in Parliament and in the Commission that is little explored in the literature and deserves more attention.
It is also pertinent to mention that a considerable percentage of the data comes from the TR database. The register is voluntary, and there is no audit of the data, which may lead to inconsistencies. Furthermore, as meeting information disclosure is very recent, we have a short period of analysis. Finally, it would be valuable to have more specific information about firms’ financial indicators. However, our sample contains more than eighteen hundred companies, with a variety of sizes and nationalities, which creates challenges in finding sources to supply this data.
The reported findings encourage us to continue to investigate lobbying dynamics in Europe. An extended period of analysis would provide more robustness to the results and would discard the risk of bias related to discussions of specific policy issues due to the analysis of one single agenda. Additionally, it would be interesting to evaluate if or how access is translated into influence. Current research typically mentions that access does not necessarily imply influence. However, would it impact policymaking, in any case? If previous studies in the United States have demonstrated that corporate political strategies result in several positive outcomes for companies, we have reason to presume that the same could happen in the European Union. We believe there are many avenues for future research on corporate political strategies in the European Union that would provide additional insights to this research field.