

Introduction–the early days
Recently, two authors (Serpieri and Franchi, Reference Serpieri and Franchi2024) analyzed the scientific literature on the physicochemistry of DNA between 1947 and 1961 as well as some publications on PCR/DNA denaturation until the 1980s. Some of the studies cited contradict each other, but a number of scientific publications show the fragility of DNA at higher temperatures. There are indeed a couple of results indicating heat-induced (hydrolytic) DNA fragmentation:
-
• Viscosity drop after heating indicates DNA fragmentation (e.g., Goldstein and Stern, Reference Goldstein and Stern1950).
-
• Heating alters gDNA so that the ethanol precipitation produces a flocculent rather than fibrous precipitate, indicating a change from its pre-heating behaviour. (Goldstein and Stern, Reference Goldstein and Stern1950).
-
• Heating leads to thixotropy in DNA solutions, while untreated DNA does not show this phenomenon, which indicates irreversible (physico-)chemical changes (Zamenhof and Chargaff, Reference Zamenhof and Chargaff1950).
-
• Heated DNA loses its ability to transform bacteria, as shown for the uptake of antibiotic resistance genes by Haemophilus influenzae (Zamenhof et al., Reference Zamenhof1953), indicating loss of its integrity.
-
• Serpieri and Franchi report further arguments for heat-induced depolymerisation, e.g. observed changes in UV absorption and changes in DNA dye staining behaviour (for refs. see Serpieri and Franchi, Reference Serpieri and Franchi2024).
-
• For more aspects (and refs.) see Serpieri and Franchi (Reference Serpieri and Franchi2024).
Overall, there is indeed some experimental data in favour of DNA degradation by heat-induced depolymerisation. Some of the effects have been reported to occur already just above 80 °C. Since denaturation in PCR takes place at approx. 95 °C, it is reasonable to ask whether the DNA is fragmented during this step. Surprisingly, there seems to be little systematic research on this topic; one example is Gustafson et al. (Reference Gustafson1993), who also report DNA damage at high temperatures. We therefore want to take a closer look at this question.
Nature tells a different story: hyperthermophilic prokaryotes
The assumption that DNA is already significantly damaged at over 80 °C is not compatible with what nature tells us. There are hyperthermophilic prokaryotes that not only withstand temperatures above 100 °C but even grow under such conditions: Pyrolobus fumarii grows up to 113 °C (Blöchl et al., Reference Blöchl1997). Geogemma barossii (‘Strain 121’) grows at 121 °C and tolerates 130 °C (Kashefi et al., Reference Kashefi and Lovley2003). Methanopyrus kandleri can survive and reproduce at 122 °C (Takai et al., Reference Takai2008). The latter two species can be grown in a running laboratory autoclave without any problems.
Of course, the conditions in a living cell are quite different from those for “naked” DNA in solution: DNA integrity is continuously monitored and maintained by enzymes: cells take various measures to protect their DNA (Daniel and Cowan, Reference Daniel and Cowan2000; Grosjean and Oshima, Reference Grosjean, Oshima, Gerday and Glansdorff2007), amongst others specific chaperones (e.g. Kampmann and Stock, Reference Kampmann and Stock2004) and adapted DNA repair systems, which surprisingly do not appear to be exceptional (Marshall and Santangelo, Reference Marshall and Santangelo2020). Nevertheless, even in the presence of these repair and maintenance systems, it seems very unlikely that the molecular biology of a cell should be able to constantly counteract the complete destruction of its genome more than 40 °C above the critical temperature.
Consideration of some contemporary PCR methods
A large number of PCR variants now exist (e.g. Coen et al., Reference Coen, Ausubel, Brent, Kingston, Moore, Seidman, Smith and Struhl2003: Unit 15 in Ausubel et al.). It is not necessary to cover them all: in the following paragraphs, we will focus on some of these that are particularly significant in terms of DNA stability.
RT-PCR (reverse transcription PCR) and SMART-libraries
RT-PCR is the means of amplifying RNA targets. Since virtually all DNA-dependent DNA polymerases are unable to accept an RNA template, RNA must be converted to cDNA by reverse transcriptase before it can be used as a template for PCR. A very intelligent combination of reverse transcription and PCR is the method for generating SMART cDNA libraries (Zhu et al., Reference Zhu2001). This technique has been widely used to create cDNA libraries as part of genome sequencing projects in order to map exons (and thus genes) to genomic data (e.g. Wiemann et al., Reference Wiemann2001). Since TaqPol has no proof-reading activity (Tindall and Kunkel, Reference Tindall and Kunkel1988; Cline et al., Reference Cline1996), an increased error rate (causing point mutations) of about 10−4 is to be expected in SMART libraries. (The value actually determined varies: it depends on assay methodology, reaction conditions, and template sequences, as outlined by Potapov and Ong Reference Potapov and Ong2017.) These errors are automatically detected during the mapping of the cDNA sequences to the genomic data. If further errors and artefacts were to occur during PCR, as claimed by Serpieri and Franchi (Reference Serpieri and Franchi2024), they would easily have been detected during these data processing steps. Zhu et al. (Reference Zhu2001) systematically compared the quality of a SMART library and a conventionally generated cDNA library (with and without a PCR step, respectively). They found that the SMART library was superior in every respect. The German cDNA consortium (Wiemann et al., Reference Wiemann2003, Wellenreuther et al., Reference Wellenreuther2004, Bechtel et al., Reference Bechtel2007) has cloned, sequenced, and mapped over 2,200 different ORFs from human cDNA. Their quality was verified and the proportion of artefacts was low – despite the complex and tricky SMART technology. Baross et al. (Reference Baross2004) have developed and tested a method for the targeted isolation of cDNA clones. After cDNA synthesis, the target ORFs were amplified by PCR with gene-specific primer pairs flanking the ORFs. The clones were then sequenced to investigate reverse transcription and amplification artefacts. In this way, the authors were able to determine the probability of obtaining error-free clones as a function of their length. High-quality cDNA libraries have been established for plant transcriptomes, too (e.g. Cartolano et al., Reference Cartolano2016). Meanwhile, the SMART method has been tuned in a way that the recovery and analysis of RNA from a single cell is possible (e.g. Hagemann-Jensen et al., Reference Hagemann-Jensen2022). In all such cases, temperature-induced artefacts as described by Serpieri and Franchi (Reference Serpieri and Franchi2024) have not been found.
qPCR: measuring the efficiency parameter
In the 1990s, a PCR variant was developed for the quantification of target DNA or (m)RNA molecules: the qPCR (Higuchi et al., Reference Higuchi1993, Heid et al., Reference Heid1996, Kubista et al., Reference Kubista2006, Dorak, Reference Dorak2006, VanGuilder et al., Reference VanGuilder2008). This method allows the quantification of the initial template by quantitatively detecting the amplicons in each individual cycle – that is: in real time. Meanwhile, quite a few variants exist (for a short overview see Dymond, Reference Dymond2013) utilizing specific (e.g. TaqMan) or non-specific (e.g. SYBR green) detection methods. It is possible to precisely determine the efficiency parameter for qPCR (e.g. Svec et al., Reference Svec2015, Tellinghuisen, Reference Tellinghuisen2021). This parameter provides information about the efficiency of the amplification reaction, that is how close the PCR process comes to an exact duplication of amplicons per cycle. The mathematical formulation of the efficiency parameter E is:
 $$ {m}_{(n)}={m}_0\bullet {\left(1+E\right)}^n $$
m: mass of amplicons; m 0: starting material (with respect to the target amplicon);
m (n): mass of amplicons after n cycles; n: number of cycles;
(1 + E): base of the exponential function; E: efficiency parameter.
In the case of E = 1, the PCR performance would be perfect because each cycle (before the process approaches the plateau) exactly doubles the number of amplicons. The crucial point: if DNA damage were to occur, as claimed by Serpieri and Franchi (Reference Serpieri and Franchi2024), then acceptable E values would not be achievable (also see below: next section). qPCR has been thoroughly tested and the pitfalls – which of course exist as with any method – are well known (Bustin and Nolan, Reference Bustin and Nolan2004), but DNA fragmentation is not one of these. For quantitative PCR methods, a detailed guideline catalogue has been created (“MIQE qPCR & dPCR”: Bustin et al., Reference Bustin2009), in which all challenges, pitfalls, and solutions are dealt with.
In forensics (see below), qPCR is routinely used to quantify template DNA. Systematic studies have been carried out on various kits (e.g. Poetsch et al., Reference Poetsch2016 – see below: Forensic DNA analysis: STR-PCR) So, qPCR has become a very powerful and reliable tool (Valasek and Repa, Reference Valasek and Repa2005).
Measuring the E parameter of a qPCR system in a practical course
qPCR is meanwhile a very well-established method that can be performed by students. The Molecular Biology degree programme at the Westphalian University of Applied Sciences offers a qPCR practical course in which students are tasked with preparing and carrying out a qPCR to detect GMO gDNA. They are then asked to manually calculate the efficiency of the qPCR system (see Materials and methods section). Figure 1 shows the regression line.
Regression straight line from a TaqMan qPCR and the associated E parameter (duplicate determination). Determined E parameter = 0,975.

Such a value for E, close to 1.0, cannot be achieved if the DNA is significantly damaged during the denaturation phase. Note that the entire amplicon must remain intact, as not only the primer binding sites but also the binding site of the TaqMan probe must be present and intact.
qPCR in virus detection: the case of SARS-CoV2
Early in the COVID-19 pandemic, qPCR detection systems for SARS-CoV2 were developed. Quite a few studies assessed the fidelity, sensitivity, and specificity of these qPCR systems (Chan et al., Reference Chan JFYip2020; Nagura-Ikeda et al., Reference Nagura-Ikeda2020; Winichakoon et al., Reference Winichakoon2020; Yang et al., Reference Yang2020; Lawrence et al., Reference Lawrence Panchali2022). The values determined were between satisfactory and very good. The main factor influencing the fidelity was not the PCR system itself, but the sample source and quality. Moreover, the sensitivity depends in particular on the expression rate of the transcripts targeted by the qPCR system (Chan et al., Reference Chan JFYip2020). Quite a few studies have compared different qPCR systems (e.g. Freire-Paspuel et al., Reference Freire-Paspuel2021a, Reference Freire-Paspuel2021b; Freire-Paspuel et al., Reference Freire-Paspuel2022; Salamanca-Neita et al., Reference Salamanca-Neita2022): their performance was good to excellent. A reliable diagnostic system cannot function if the DNA is thermolabile to any significant degree.
Sanger cycle sequencing
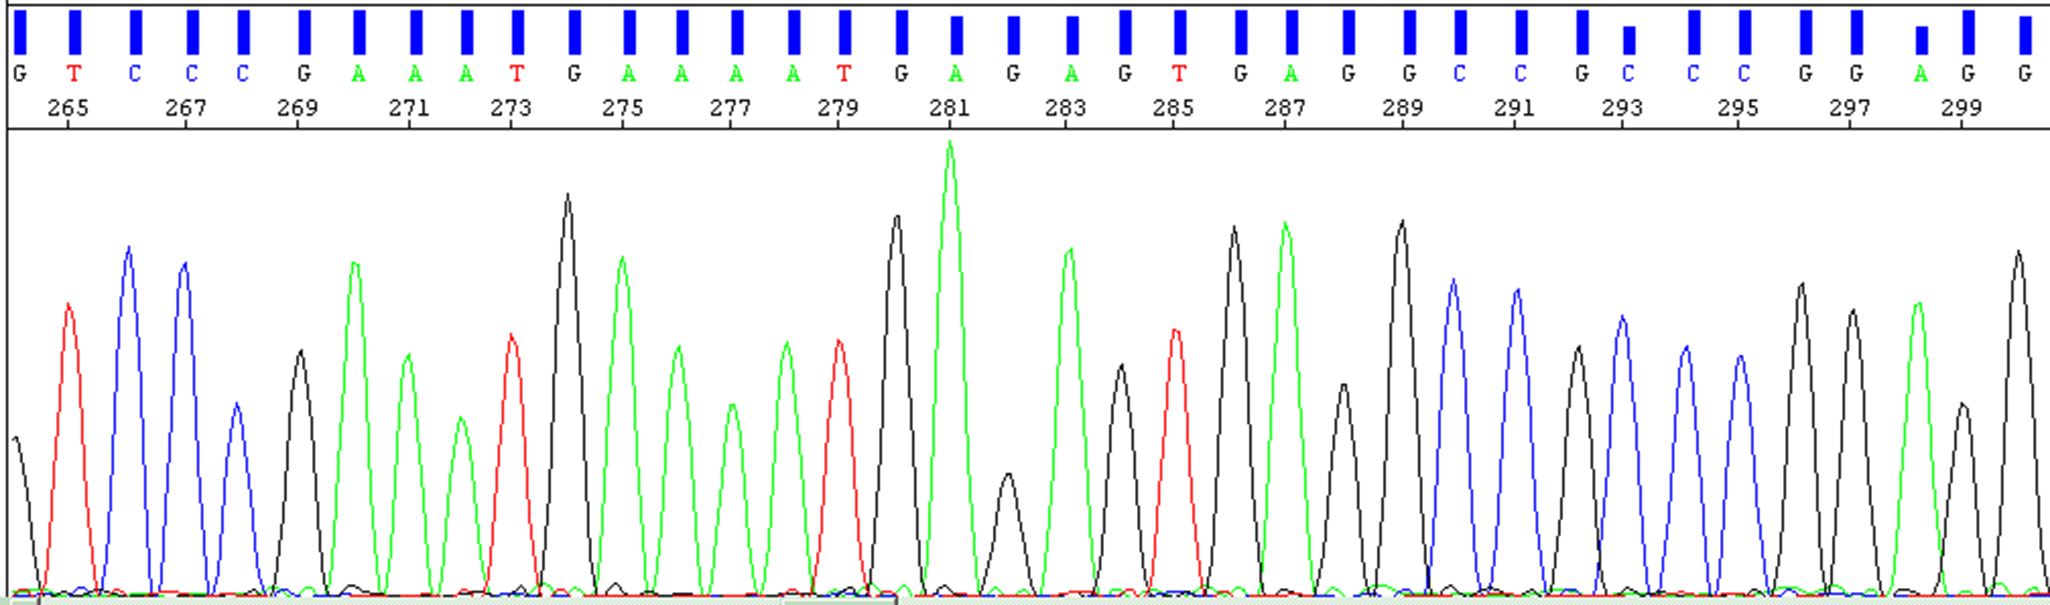
In Reference Sanger1977, Sanger et al. developed the enzymatic chain termination method of DNA sequencing. About a decade later, the enzymatically produced fragments were labeled with dyes rather than with radionuclides, allowing the process to be automated (Chait et al., Reference Chait1988). Around the same time, the cycle sequencing method was invented, which is a “one-primer PCR,” so to speak (Murray, Reference Murray1989, Blakesley, Reference Blakesley, Griffin and Griffin1993). Templates that can be used are plasmid or phage clones as well as PCR products that – after removal of the PCR primers – can be sequenced directly (Coen et al., Reference Coen, Ausubel, Brent, Kingston, Moore, Seidman, Smith and Struhl2003: Unit 15.2 in Ausubel et al.; Mardis and McCombie, Reference Mardis and McCombie2017). Cycle sequencing is usually carried out with 20–30 cycles. It only leads to linear amplification, as only a single primer is used. Artefacts such as those claimed by Serpieri and Franchi (Reference Serpieri and Franchi2024) can therefore not be compensated for by exponential amplification. Provided that the template DNA is clean, the primers have no secondary binding sites, and the cycle conditions (especially the annealing temperature) are appropriate, cycle sequencing typically provides clear signals without background. Figure 2 shows an arbitrarily selected example (human VPS4A: Beyer et al., Reference Beyer2003). This is not compatible with the assumption of major DNA damage due to fragmentation during the denaturation steps.
Image section of an electropherogram from a Sanger cycle sequencing reaction (from Beyer et al., Reference Beyer2003). The electropherogram shows clear, clean signals with extremely low background. There are no signs of DNA fragmentation or other damage caused by the repeated denaturation steps.

Some publications deal with the reasons for poor Sanger sequencing electropherograms (e.g. Al-Shuhaib and Hashim, Reference Al-Shuhaib and Hashim2023). There are also troubleshooting guides by sequencing core facilities such as those at the Center for Computational and Integrative Biology of Massachusetts General Hospital in Harvard (https://dnacore.mgh.harvard.edu/new-cgi-bin/site/pages/sequencing_pages/seq_troubleshooting.jsp). In none of those sources, heat-induced hydrolysis of the DNA during PCR is cited as one of the reasons for poor results in Sanger Sequencing and noisy peaks in the electropherogram.
Next generation sequencing (NGS) with bridge amplification PCR
MPS (massively parallel sequencing) approaches were developed in the 1990s and have been commercially available since around 2005 (Margulies et al., Reference Margulies2005; see also: Voelkerding et al., Reference Voelkerding2009). These technologies usually involve a PCR-based amplification step that starts from single (!) molecules (Anderson and Schrijver, Reference Anderson and Schrijver2010). Two examples that will be briefly explained here are Bridge Amplification/Polony PCR and Emulsion/Droplet PCR.
First step in the development of both methods was the “DNA colony generation principle,” invented and developed in 1996 by Pascal Mayer and Laurent FarinelliIn (Glaxo-Welcome’s Geneva Biomedical Research Institute, GBRI: patents WO 9844151 and WO 9844152). For both methods, the prepared DNA – usually gDNA – is fragmented down to a defined size and subsequently adapters are ligated to the (blunt) ends of these fragments. These adapters carry target (binding) sequences for PCR and sequencing primers. (The adapters are more complex than described here: they also carry index sequences that allow parallel sequencing of different samples in a single run. This is omitted here for simplicity.) The fragments are then amplified by PCR. The main difference from a standard PCR is the fact that the PCR primers are immobilized, that is covalently attached to a surface. Therefore, the ends of the immobilized fragments have to find the immobilized primers by diffusion (and not vice versa, as in a standard PCR process). In this way, clusters of – in each case identical – PCR-generated fragments are formed. These clusters of PCR-generated DNA colonies are called polonies. (An early paper on the principle in the context of genome sequencing is Mitra et al., Reference Mitra2003.)
-
• Bridge amplification/polony PCR – the Solexa/Illumina technology
In this case, the primers are attached to the surface of a so-called flow cell. The DNA fragments (fitted with adapters) are applied to the flow cell in a defined concentration so that polonies are formed in a defined density. After the PCR process, these polonies sit on the surface of the flow cell like little forest islands and here, the sequencing reaction takes place. (Figure 3).
-
• Emulsion/droplet PCR: the 454 technology
Here, the primers are attached to the surface of beads. These beads are mixed with the DNA fragments (with adapters ligated to both ends), TaqPol, reagents, and buffer. This solution is mixed with oil and vortexed thoroughly so that an emulsion is formed. Most micelles include a single (or no) bead and most beads have bound a single (or no) DNA fragment. The PCR process is performed in this emulsion so that the bridge amplification takes place on the surface of the beads. Finally, most of the beads have polonies, each of which emerged from an individual DNA fragment. After the PCR, the beads are applied to PicoTiter™ plate where the sequencing reaction is performed.
Simplified sketch of the bridge amplification principle. Steps 5-7 are repeated in the process of colony-PCR. 8 shows the result: polonies on the surface of the flow cell. Note that each polony/cluster emerges from a single DNA molecule after some rounds of amplification and thus also some rounds of denaturation.

With such PCR-based technologies the 1,000 genomes project (https://www.internationalgenome.org/) has sequenced over 2,000 human genomes. They were able to identify over 88 million sequence variants in our genome (Sudmant et al., Reference Sudmant2015; 1,000 Genomes Project Consortium, 2015). The project was continued: until 2022 over 110 Million single nucleotide variants and over 14 Million InDels have been identified and verified (Byrska-Bishop et al., Reference Byrska-Bishop2022).
The quality of the obtained data has been assessed thoroughly (Belsare et al., Reference Belsare2019). Different classes of error were examined, and of course, it turned out that the data was not error-free. One of the error classes concerns incorrect SNPs caused by errors produced by polymerase, sequencing, or data processing. If, however, DNA indeed displayed “scarce resilience and significant loss of structural integrity when DNA is heated at temperatures above 90 °C, even for 1 minute,” as claimed by Serpieri and Franchi (Reference Serpieri and Franchi2024), this would have had extreme impact on the error rate, which was never observed. Within the human genome project, the overall base accuracy was high, with an average of one base error per 651,000 base pairs, equating to an error rate of about 0.00015% mainly due to errors such as deletions and misassemblies and not false sequencing reads (Schmutz et al., Reference Schmutz2004).
Another example is the sequencing of genomes of extinct human (sub-) species. PCR-based NGS technologies enabled the generation of high-quality genomic data from Neanderthals and Denisovans (e.g. Meyer et al., Reference Meyer2012; Prüfer et al., Reference Prüfer2014). This in turn made it possible to trace the genetic history and ancestry of Homo sapiens sapiens, Neanderthals and Denisovans (Disotell, Reference Disotell2012; Ahmed and Liang, Reference Ahmed and Liang2013; Sánchez-Quinto and Lalueza-Fox, Reference Sánchez-Quinto and Lalueza-Fox2015; Slon et al., Reference Slon2018; Gokcumen, Reference Gokcumen2020; Sankararaman, Reference Sankararaman2020 ; Bergström et al., Reference Bergström2021; Lalueza-Fox, Reference Lalueza-Fox2021; Schaefer et al., Reference Schaefer2021; Zeberg et al., Reference Zeberg2024).
All this progress was only possible with high-quality genomic data obtained with PCR-based methods. The reaction conditions are even more critical than with a “standard PCR”: The starting material for each individual sequence is a single DNA molecule. If thermal DNA damage were a significant factor, all these NGS/MPS methods would not work.
Assessing error sources in PCR
Indeed quite a few studies exist on error sources caused by PCR; some of them will be mentioned now.
It became clear early on that the length of the amplicons is limited by incorrectly inserted nucleotides due to the lack of proof-read activity of the TaqPol. Mismatched bases incorporated in this way either lead to errors in the amplicons or prevent the polymerase from continuing its work. In the 1990s, alternative polymerases with proof-read activity became available. Used in PCR, they enabled the amplification of fragments of more than a dozen kBp – see e.g. Barnes (Reference Barnes1994): his protocol generated clear, sharp amplicon bands in AGE up to 18 kbp. He discussed various sources of error, including heat-induced DNA damage. According to Barnes, at 95 °C and pH ~6.5, one apurinic site can be expected to be generated every 20–30 kb of single-stranded DNA per minute. However, he found no evidence for more frequent strand breaks during the denaturation intervals.
From the very beginning, PCR products have been cloned into vectors (e.g. Finney et al., Reference Finney, Ausubel, Brent, Kingston, Moore, Seidman, Smith and Struhl2001). In the 1990s, many protocols relied on elution of the amplicons from excised gel slices by boiling. Frost and Guggenheim (Reference Frost and Guggenheim1999) have determined the degree of DNA fragmentation under various conditions. They found that the extent of hydrolytic strand breaks depended strongly on the buffer. After 90 minutes boiling (!), the yield in pure water was zero and in TE buffer it was really low, but boiling in PCR buffer produced very good results (see Figure 2 in Frost and Guggenheim, Reference Frost and Guggenheim1999).
Pienaar et al. (Reference Pienaar2006) investigated errors caused by the polymerase as well as thermal DNA damage. They found that thermally induced damage is a relevant source of errors in PCR-generated amplicons. Three types can be distinguished: A + G depurination, oxidative damage of guanine to 8-oxoG, and cytosine deamination to uracil (see also refs. in Pienaar et al., Reference Pienaar2006). However, depurination does not lead to defective amplicons, as synthesis stops at depurinated sites. Therefore, depurination can only reduce the yield, while the other two processes produce point mutations. They found no evidence that heat-induced depolymerization is a relevant problem in PCR.
Orton et al. (Reference Orton2015) conducted a very thorough and comprehensive experiment. Their initial question was as follows: When genomes of RNA viruses are sequenced, for example during an epidemic or pandemic, mutations are mapped to track the emergence and development of new virus strains. To do this, it is important to distinguish real mutations from artefacts. To this end, the authors created the following experimental setup to distinguish errors produced by (a) transcription, (b) reverse transcription, (c) PCR, and (d) base calling:
First, the genome of an RNA virus (FMDV) was cloned into a plasmid vector. Then, four different experimental pipelines were run in parallel. (#1) The cloned FMDV fragment was excised from the vector and prepared by AGE. (#2) The cloned FMDV genome was diluted and subjected to PCR [19 cycles]. (#3) The same as (#2), but a higher dilution was prepared and the PCR was run for 39 cycles. (#4) The cloned FMDV genome was transcribed, the RNA synthesized was reverse transcribed and then subjected to a 39-cycle PCR. Last, all samples were analysed by Illumina NGS. Pipeline #4 displayed a total error rate (i.e. sum of errors from all sources mentioned) of less than 0.14%/site for 95% of the genome and a maximum of 0.66% for certain sites. There was no hint of significant problems caused by DNA fragmentation during PCR.
Potapov and Ong (Reference Potapov and Ong2017) also employed NGS to examine sources of error in PCR. As expected, they found for TaqPol the well-known base substitutions, rare cases of single base deletions, and even rarer cases of single base insertions. Polymerases with proofread activity performed [some of them much] better. Two artefacts were described that had previously been underestimated: In rare cases, a template/strand switch occurs in palindromes, and also, rare cases of PCR-mediated recombination via template switching were observed. As far as damage caused by heat is concerned, the effects described above have been observed. There were no indications of noteworthy problems due to heat-induced strand breaks.
Forensic DNA analysis: STR-PCR
In the review by Serpieri and Franchi (Reference Serpieri and Franchi2024), the use of PCR in forensic genetics is explicitly mentioned. PCR methods have been used routinely for some decades to create individual, specific DNA profiles based on the analysis of short tandem repeats (STRs) (Schneider, Reference Schneider1997; Morling, Reference Morling2009; Butler, Reference Butler2011). Moreover, PCR analysis is also a necessary part of mitochondrial DNA (mtDNA) analyses (Holland and Parsons, Reference Holland and Parsons1999; Bär et al., Reference Bär2000; Parson and Dürr, Reference Parson and Dür2007; Dumache et al., Reference Dumache2016).
STRs are short repetitive sequence units, which can differ in the number of repeats between different individuals. To establish a DNA profile of an individual, these STRs are first amplified using PCR and then separated lengthwise by capillary electrophoresis (Butler, Reference Butler2007). Alternatively, newer methods employ the massive parallel sequencing (MPS) technique using Bridge Amplification as already described before. MPS not only determines the length of the fragments but also detects the exact nucleotide sequence of the STRs (Alonso et al., Reference Alonso2018). Nowadays, 16 different STRs are analyzed in Germany to create a DNA profile (Butler, Reference Butler2005; Schneider and Martin, Reference Schneider and Martin2001).
The sequence of the individual DNA bases of a given STR and the flanking areas of these STRs are conserved sequences, with the exception of individual mutations (Kline et al., Reference Kline2011). If a “thermal degradation” during PCR as described by Serpieri and Franchi (Reference Serpieri and Franchi2024) occurred, a reliable and consistent establishment of a DNA profile would not be possible.
A simple experimental approach shows that these assumptions by Serpieri and Franchi (Reference Serpieri and Franchi2024) cannot be confirmed. Six different tissues (brain, heart, lung, liver, kidney, and muscle) were taken from each of three different people and analyzed using a commercially available STR kit (see methods section). The results for all three individuals showed identical, complete, and reproducible results in all STRs for each individual, regardless of tissue used. In addition, for routine PCR and subsequent fragment length analysis, a positive control, commercial control DNA 2800 M (Promega, Mannheim, Germany), has been analyzed in our laboratory for 10 years. This consistently showed the same DNA profile, which matches the Promega reference DNA profile at all loci (James, Reference James2011). It shows no random fragmentation during the PCR (Figure 4) over the entire time, regardless of the equipment used (various thermal cyclers and capillary electrophoresis systems) or applied methods (e.g. PCR and fragment length analysis and/or MPS). This reliability and reproducibility show that the assumptions of Serpieri and Franchi (Reference Serpieri and Franchi2024) are not true. Obviously, neither the target fragments to be amplified themselves nor their primer binding sites are subject to randomized, chaotic fragmentation and polymerization during the denaturing phases of the PCR.
STR profile of control DNA 2800 M (Promega, Mannheim, Germany). The figure shows STR profile of control DNA 2800M (Promega, Mannheim, Germany) generated with PowerPlex® ESX kit (Promega, Mannheim, Germany). The electropherogram, i.e. the DNA profile matches the Promega reference DNA profile in all alleles (James Reference James2011). It shows no random fragmentation during PCR and has been reproducible for many years.

A major challenge in the field of forensic genetics is samples with degraded DNA. When analyzing these so-called low-template DNA traces, alleles may not be displayed (allele drop-out) and additional alleles may occur in the electropherogram that are not present in the DNA sample at all (stutter and drop-in). These phenomena are very well understood and the literature shows that these drop-outs and drop-ins are simply stochastic effects (Weusten and Herbergs, Reference Weusten and Herbergs2012; Timken et al., Reference Timken2014).
As early as 1996, Taberlet et al. (Reference Taberlet1996) showed in their study that reliable genotyping by PCR is possible even using just a few picograms of gDNA. In addition, Poetsch et al. (Reference Poetsch2016) demonstrated in a method comparison study that consistent and reliable DNA profiles could be amplified with commercial forensic genetics kits using the maximum input of 8 μl with samples of at least 8 pg/μl. This study also shows that partial STR results can be expected in analyses employing DNA concentrations between 3.4 pg/μl and 8 pg/μl (Figure 5) (Poetsch et al., Reference Poetsch2016). The mass of the genome of a single human cell is 6.51 pg for women and 6.41 pg for men (Piovesan et al., Reference Piovesan2019). It is therefore not surprising that newer methods in forensic genetics enable reliable and reproducible single cell STR analysis and that these studies also refute the statement by Serpieri and Franchi (Reference Serpieri and Franchi2024), even for low concentration samples in the context of forensic genetics (Williamson et al., Reference Williamson2018; Anslinger et al., Reference Anslinger2019; Meloni et al., Reference Meloni2019; Watkins et al., Reference Watkins2021).
Kind of STR profiles obtained as a function of DNA concentration in a sample. The figure shows how many complete profiles (green diamonds), incomplete profiles (yellow squares) and no profiles (red triangles) could be determined from the samples depending on the DNA concentration. The horizontal lines indicate threshold values in order to be able to estimate the quality of the STR profile after quantification. From a concentration > 8 pg / µl (black line) a complete STR profile can be expected, > 3.4 pg / µl (red line) a partial STR profile and below that no STR profile. There were two outliers, marked with the circles (based on Poetsch et al. Reference Poetsch2016).

In addition, the routinely used kits produce short STR amplicons to avoid drop-outs and drop-ins due to DNA degradation in the sampled trace DNA. The fragment lengths of analyzed STRs vary between ~100 bp to ~500 bp (PowerPlex® ESX Kit, Promega, Mannheim, Germany) and ~120 bp to ~450 bp (AmpFLSTR™ NGM SElect™, Thermo Fischer Scientific, Darmstadt, Germany). In the past, so-called miniplex kits were often used for degraded DNA samples. These amplify only very few loci, but have significantly shorter amplicon lengths. Examples are the PowerPlex® S5 Kit (Promega, Mannheim, Germany) with fragment lengths between ~80 bp and ~ 220 bp or the Investigator® Triplex AFS QS Kit (Qiagen, Hilden, Germany) with fragment lengths between ~100 bp and ~ 300 bp. However, some of these are no longer available, as the latest kits contain all loci (based on the loci used for the DNA database in Germany) with fragment lengths between ~80 bp - ~324 bp (PowerPlex® 18E System, Promega, Mannheim, Germany) and ~120 bp - ~350 bp (NGM Detect™, Thermo Fischer Scientific, Darmstadt, Germany). Contrary to the statements by Serpieri and Franchi (Reference Serpieri and Franchi2024), it is therefore possible to generate reliable and reproducible STR results even despite poor DNA quality (Butler et al., Reference Butler2003; Coble and Butler, Reference Coble and Butler2005; Wiegand et al., Reference Wiegand2006; Poetsch et al., Reference Poetsch2011).
In mtDNA analysis, usually the hypervariable sections HV1, HV2, and HV3 on the circular DNA molecules of the mitochondria are amplified using PCR and then analyzed using Sanger Sequencing (Sanger et al., Reference Sanger1977; Chait et al., Reference Chait1988). New methods and platforms such as NGS/MPS (see section “Next Generation Sequencing (NGS) with Bridge Amplification PCR”) enable the sequencing of the entire mitochondrial genome. Regardless of whether individual sections are analyzed or a whole genome analysis is performed, the detected sequence is displayed base by base. In a comparison of the results with the Cambridge Reference Sequence using an alignment for evaluation and assessment (Anderson et al., Reference Anderson1981; Andrews et al., Reference Andrews1999), differences are highlighted and the haplotype of a person is determined (Just et al., Reference Just2004; Parson and Dürr, Reference Parson and Dür2007; Strobl et al., Reference Strobl2018). Since, as mentioned above (see section “Sanger Cycle Sequencing”), this is a linear amplification during cycle sequencing, any erroneous PCR artefacts as described by Serpieri and Franchi (Reference Serpieri and Franchi2024) should appear in the electropherogram. However, in a small experimental analysis for this review, we could establish reproducible results without background signals (such as shown in Figure 2, data not shown). In three different tissue types (psoas muscle, brain, and heart muscle) from three different individuals, mtDNA regions HV I and HV II were amplified and sequenced by PCR. The resulting sequences were compared with the reference sequence and the respective haplogroup was determined independently using two different mtDNA databases/programs (https://haplogrep.i-med.ac.at/; https://empop.online/). An identical haplotype and consequently an identical haplogroup were determined for all three individuals, regardless of the tissue. We established haplogroup J1c, haplogroup T2f1, and haplogroup U5b1 for individuals 1, 2, and 3, respectively (Table 1). This small experiment also demonstrates the reliability and reproducibility of this method, which is representative of PCR-based analyses routinely carried out in forensic genetics for decades, and accordingly contradicts the claims of Serpieri and Franchi (Reference Serpieri and Franchi2024).
The table shows the results of the haplogroup determination for all three individuals

In all three individuals, identical deviations were found in the three different tissues for HV1 and HV2 compared to reference sequence and therefore also the identical haplogroup.
In summary, the statement by Serpieri and Franchi (Reference Serpieri and Franchi2024) can therefore be refuted, also in the context of forensic genetics. In standard PCR protocols, there is no influential, random fragmentation of the DNA molecules during the relatively short heating steps. Accordingly, PCR products are not chaotic, randomized nucleotide sequences. This is not only shown by the small exemplary experiments in this review, but is above all confirmed by the countless existing literature, some of which is cited here, which on the one hand empirically confirms the reliability and reproducibility of PCR methods and, on the other hand, also clearly defines their limitations.
Denaturation–renaturation and C 0t analysis
Serpieri and Franchi (Reference Serpieri and Franchi2024) apparently even question the mechanism of DNA denaturation and renaturation itself: they repeatedly use the term “denaturation claim.” Concerning renaturation/annealing they say “Caution should be applied to verify whether these annealing phenomena truly consist of an ordered reformation of a two-stranded material from the association of two one-stranded chains, or also involve the other much less ordered combined fragmentation-aggregation phenomena.” This is somewhat surprising because already in the 1960s denaturation–renaturation studies have been performed to characterise different fractions of complex genomes (e.g. see Britten and colleagues – Waring and Britten, Reference Waring and Britten1966; Britten and Kohne, Reference Britten and Kohne1968; Britten et al., Reference Britten1974). They discovered that the genomes of higher organisms contain repetitive elements in high copy numbers, as this fraction reassociates much faster than the rest after heat-induced denaturation (Figure 6). They could even distinguish a high-repetitive, a low-repetitive, and a unique fraction. During the renaturation process, highly repeated sequences renature rapidly: most strands find their complementary counterpart quite fast. The moderately repeated fraction will have an intermediate time of renaturation. Finally, unique sequences will have the slowest time of renaturation. This characteristic behavior of DNA reassociation can be visualized in the form a so called C0t curve (Figure 6).
Simplified sketch of a C 0t experiment. gDNA is denatured by heat (left) and then cooled down for denaturation (middle). There are fractions with a different number of copies (green, blue, red), which re-associate at different speeds (right). Reassociation is measured by measuring UV absorption.

In the post-genomics era, this has been confirmed by genomic sequence data (Martin, Reference Martin1991; Jurka et al., Reference Jurka2007; de Koning et al., Reference de Koning2011; Lower et al., Reference Lower2019; Liehr, Reference Liehr2021). By now, elaborate mathematical models of the kinetics of the reassociation of DNA strands are available (e.g. Murugan Reference Murugan2002). Later, denaturation–renaturation kinetics were also used preparatively (instead of just analytically) to isolate defined fractions (e.g. of unique or low-copy sequences) from complex genomes (Peterson et al., Reference Peterson2002; Yuan et al., Reference Yuan2003; Lamoureux et al., Reference Lamoureux2005; Rong et al., Reference Rong2013). All this is obviously only possible because the DNA survives the heat-induced denaturation without greater damage.
A simple experiment
At the end of this review, we would like to add some data from a simple experiment, namely a PCR reaction with subsequent denaturation phases, addressing the concern of thermal (in)stability of ssDNA. This experiment is carried out at the Westphalian University of Applied Sciences for students and also for pupils (a “pupils’s lab program”).
In this experiment, the cloned cDNA fragment from a plasmid was amplified (see Materials and methods section). Afterwards, the obtained fragment was denatured at 95 °C for different time intervals, followed by renaturation at 75 °C, and finally analysed by AGE. Figure 7 shows the result.
Electrophoretic analysis of denaturation-renaturation experiments of a PCR fragment. MW: molecular weight standard (o’gene ruler 1kb, Thermo Scientific).0: PCR-sample that has not been cycledP: PCR-sample 1, 3... 90: samples that were subjected to denaturation at 95°C for 1, 3, 10, 30, 60, and 90 minutes, respectively. After denaturation, all samples were incubated at 75°C for 20 minutes for renaturation. Sample volume = 10 µl, the complete samples were loaded on the gel. Faint bands at the bottom indicate residual primers.

As expected, the sample that was not cycled showed no band. The input of 0.5 ng plasmid is not enough to be seen in AGE. The PCR produced a clear, sharp band. Lanes 1 … 90 demonstrate, that denaturation up to 10 minutes has virtually no effect. Only after 30 minutes first signs of degradation are visible. It takes, however, more than 1 hour of denaturation to introduce a break into all PCR fragments. Keep in mind that 30 minutes is more than the total denaturation time even of a PCR of 40 cycles.
Loop-mediated isothermal amplification (LAMP): a modern alternative to PCR
LAMP is a variant of isothermal strand displacement amplification methods (developed by Notomi et al., Reference Notomi2000. See also Kim and Easley, Reference Kim and Easley2011, Fakruddin et al., Reference Fakruddin2013). Without going into detail, it can be said that in all these cases, the temperature-dependent DNA denaturation is replaced by the strand displacement activity of an enzyme: typically, a DNA-dependent DNA polymerase with strand displacement activity like Bst polymerase is used. LAMP is a method for sequence-specific amplification, just like PCR. A special primer design ensures that loops are introduced at the ends of the amplicons. These loops harbor primer binding sites for the next DNA synthesis step.
Four to six primers (two inner primers, two outer primers, and optionally loop primers – see Nagamine et al., Reference Nagamine2002) are required for a single amplification target. For this reason, primer design is complicated and multiplexing is quite difficult. With standard PCR, however, multiplexing of over 100plex has been possible for more than a decade. (Li et al., Reference Li2011). This is much more than could ever be achieved with LAMP. Furthermore, the cloning of LAMP products is tricky and the use of degenerate primers is very difficult. In addition, the exact quantification of targets using qPCR is now well established, whereas only approximate quantification is possible with LAMP (Soroka et al., Reference Soroka, Wasowicz and Rymaszewska2021; Rolando et al., Reference Rolando2024). However, LAMP is fast and a laboratory is not essential for its application. For this reason, it is now routinely used in point-of-care diagnostics and on-site diagnostics (Jordan et al., Reference Jordan2012, Nixon et al., Reference Nixon2014).
Coming back to the paper by Serpieri and Franchi
At this point, the question arises as to why Serpieri and Franchi (Reference Serpieri and Franchi2024) come to such divergent views regarding the stability of the DNA and the reliability of the PCR. First of all, it is striking that the two authors mainly consider outdated literature from a time when, in fact, nothing was known about the molecular biology of DNA. Secondly, a citation bias is noticeable: as already mentioned, the authors ignore the C 0t experiments. It is also surprising that the only citations that refer specifically to PCR parameters are from the early days of PCR, when those parameters had not yet been thoroughly tested. In doing so, they ignore the huge mountain of knowledge that has been acquired about PCR over the last 4 decades – a wealth of evidence, of which only a small selection is cited here. Thirdly, it is noteworthy that the authors did not undertake any experiments of their own on this topic – as shown in this review, even some very simple experiments are informative. Fourthly, some of the papers they cite are irrelevant for the question of whether DNA is thermoresistant enough for PCR – three examples:
-
• Zamenhof and Chargaff (Reference Zamenhof and Chargaff1950) investigated the changes in the viscosity and thixotropy of DNA solutions after treatment of the DNA with acid, alkali, or heat and subsequent return to more physiological conditions. If you read this paper, you will notice that no real distinction is made between depolymerization (hydrolysis?) and denaturation. This is hardly surprising given the fact that virtually nothing was known about the DNA molecule at that time: the double helix structure of DNA was only published three years later by Watson and Crick (Reference Watson and Crick1953). The effects Zamenhof and Chargaff (Reference Zamenhof and Chargaff1950) had observed can easily be explained without the assumption of extensive DNA damage. As soon as gDNA is released from cells during preparation, it breaks into pieces, no matter how carefully it is handled. (For this reason, the separation of complete chromosomes by pulsed-field electrophoresis is only possible if the cells are lysed in an agarose block so that they are never free in solution: see e.g. Finney, Reference Finney, Ausubel, Brent, Kingston, Moore, Seidman, Smith and Struhl2003: Unit 2.5B in Ausubel et al., Reference Coen, Ausubel, Brent, Kingston, Moore, Seidman, Smith and Struhl2003.) Of course, all these gDNA fragments are different, so after denaturation, they will never find their original partner strands again during renaturation. Therefore, after the renaturation of gDNA, an undefined mixture of double strands with single-strand ends and cross-hybridized strands will result. Of course, this configuration has different mechanical properties than the gDNA originally prepared.
-
• The same reason applies to the altered behaviour of the gDNA during precipitation with ethanol (Goldstein and Stern, Reference Goldstein and Stern1950).
-
• At the end of their paper, Serpieri and Franchi (Reference Serpieri and Franchi2024) cite Williams (Reference Williams1952) who “sprayed 0.01% water solution of DNA prepared by the method by Schwander and Signer subjected to a process consisting of (1) freezing at −78 °C, (2) 60 °C heating for drying, and (3) rapid cooling.” It is obvious that this treatment is far removed from the conditions during PCR.
Conclusion: PCR is reliable
PCR is neither a magic remedy nor a miracle product. Of course, as with any technology, there are challenges and pitfalls with the PCR method, which are meanwhile known and well understood (e.g. see the sections “Background Information” and “Critical Parameters and Troubleshooting” in Coen et al. Reference Coen, Ausubel, Brent, Kingston, Moore, Seidman, Smith and Struhl2003: Unit 15 in Ausubel et al.; Lorenz, Reference Lorenz2012).
-
• Just because of the sensitivity of the exponential PCR kinetics, contamination and carry-over is an extremely important issues (e.g. a case report by Wernike et al., Reference Wernike2021).
-
• Template quality is also a crucial point (e.g. Lanoix et al., Reference Lanoix2012).
-
• Primer design is an essential aspect. This refers both to the primer sequences and the primer binding sites (to avoid secondary binding sites) (Dieffenbach et al., Reference Dieffenbach1993; Yuryev, Reference Yuryev2007; Li and Brownley, Reference Li and Brownley2010; Thornton and Basu, Reference Thornton and Basu2011; Ye et al., Reference Ye2012; Chuang et al., Reference Chuang2013; Kumar and Chordia, Reference Kumar and Chordia2015; Rodríguez et al., Reference Rodríguez2015; Bustin et al., Reference Bustin2020; Xie et al., Reference Xie2022).
-
• For qPCR, reference transcripts must be carefully selected (e.g. Lanoix et al., Reference Lanoix2012). The math behind it is tricky (e.g. Freeman et al., Reference Freeman1999).
-
• It can happen that a PCR system works close to a certain “limit line,” so that tiny parameter changes push the system over a tipping point (Schrick and Nitsche, Reference Schrick and Nitsche2015 give a case report).
-
• As mentioned above, TaqPol does not have proof-read activity, so it displays an increased error rate (McInerney et al., Reference McInerney2014). The use of alternative polymerases with proofread activity cannot completely eliminate this problem, as the reliability of the cellular replication and DNA repair systems cannot be achieved with these either.
-
• As already mentioned, PCR-mediated recombination and template/strand switch may happen (Potapov and Ong, Reference Potapov and Ong2017).
-
• However, template fragmentation induced by heat is not a significant problem, as has now been explained in detail. Fragmentation, among other effects, will contribute to the fact that an E-parameter value of exactly 1.00 cannot be achieved. However, this effect is of no significance for shorter amplicons. So can the (tiny) fraction of broken strands “with probability very close to certainty” be the reason “that PCR products consist of chaotically randomized sequences of nucleotides”? (Serpieri and Franchi, Reference Serpieri and Franchi2024) The clear answer is “no,” because (a) a strand break within a primer binding site simply prevents primer binding. (b) A strand break within the amplicon, i.e., between the two primer binding sites, will result in the molecule in question only being amplified linearly from now on. Therefore, in cases (a) and (b), molecules are produced that simply drop out of the PCR process. (c) A strand break outside the amplicon in the primary DNA template has no effect. This is basic PCR knowledge.
The PCR variants discussed here are only a part of the “PCR universe”; the same applies to the literature cited. It was not the purpose of this mini review to provide a comprehensive overview of PCR in the year 2025; instead, we only wanted to address the question of whether PCR is reliable. Our conclusion: If a PCR system is carefully designed and validated, it is absolutely reliable, taking into account the limitations mentioned above. Degradation of DNA due to high temperatures only happens to a noteworthy extent when exposure is prolonged. This is not the case in contemporary PCR protocols. In typical PCR protocols, the denaturation step lasts 5–30 seconds per cycle, which is not enough time to induce significant DNA hydrolysis. It turned out that DNA remains intact and amplifiable even after 30–40 cycles of PCR (e.g. Saiki et al., Reference Saiki1988).
Over the last four decades, millions of PCR systems have been developed and billions of PCR reactions have been performed. The PCR method has a very successful history.
Materials and methods
Forensic DNA typing
The tissue samples were collected at the Institute of Legal Medicine in Essen during court-ordered autopsies (ethics vote number 15-6345-BO). DNA extraction was performed using DNA IQ Casework Pro Kit and Casework Extraction Kit in the Maxwell® RSC 48 instrument (Promega, Walldorf, Germany). Subsequently, DNA was quantified with PowerQuant™ kit (Promega) in a 7500 Fast Real-Time PCR system (ThermoFischer Scientific, Darmstadt, Germany). STR typing was done using PowerPlex® ESX 17 Kit and mtDNA sequencing was done with BigDye™ Terminator version 3.1 cycle sequencing kit and BigDye XTerminator™ purification kit. The last step of both methods – electrophoretic analysis – was performed on 3500 Genetic Analyzer instrument (ThermoFischer Scientific, Darmstadt, Germany) and results were analyzed using either GeneMapper HID software (ThermoFischer Scientific, Darmstadt, Germany) or Chromas software (Technelysium Pty Ltd, South Brisbane, Australia).
PCR
A cDNA plasmid clone of Homo sapiens RNA binding fox-1 homolog 2 (RBFOX2), transcript variant 1, cDNA, (GeneBank Acc NM_001031695.4), cloned in pDONR211, served as PCR template. It was propagated in E. coli DH5α in standard medium (LB) at 37 °C overnight with aeration and shaking. Plasmid isolation was performed with a standard miniprep kit (Nucleospin Plasmid EasyPure Preparation Kit, Macherey & Nagel, https://www.mn-net.com/).
DNA yield and purity were determined by photometry (OD 260/280 nm). A Biometra thermal cycler (Biometra TRIO 48 Multi Block Thermal Cycler, purchased from Analytik Jena, Germany) was used for incubation of the samples at defined temperatures and PCR as well.
As primers, standard primers were used:
M13fw(−20, modified by one base): 5’-TGTAAAACGACGGCCAGT-3′ /.
M13rev(−27): 5’-GGAAACAGCTATGACCATG-3′.
They were purchased from eurofins (https://eurofinsgenomics.eu).
Low-eeo-agarose was used for AGE. Staining of DNA in agarose gels was performed with SYBR safe in 1:10,000 dilution as recommended by the manufacturer (Thermo Scientific: https://www.thermofisher.com/de/de/home/life-science/dna-rna-purification-analysis/nucleic-acid-gel-electrophoresis/dna-stains/sybr-safe.html). The Thermo Scientific™ O’GeneRuler 1 kb DNA ladder (Fisher Scientific, https://www.fishersci.de/) was used as a molecular weight standard.
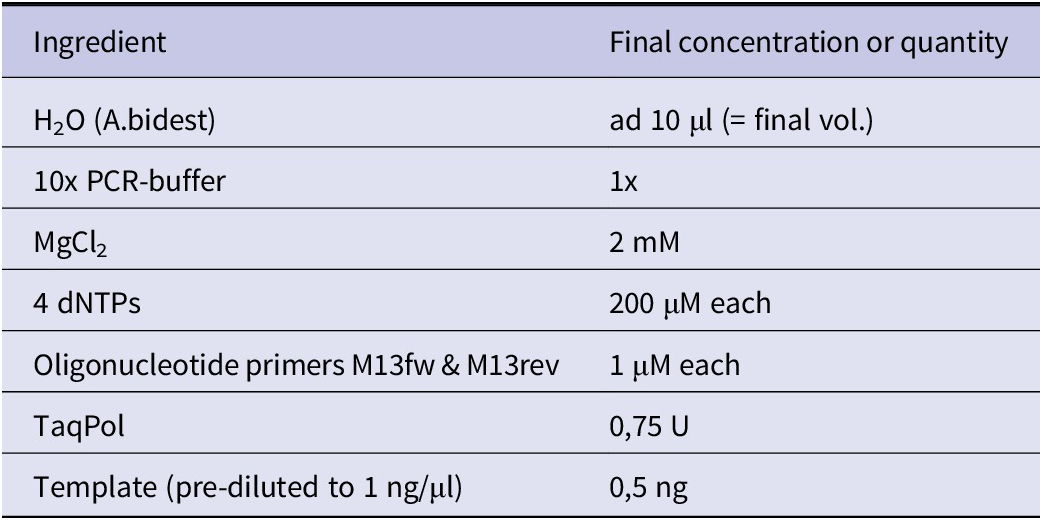
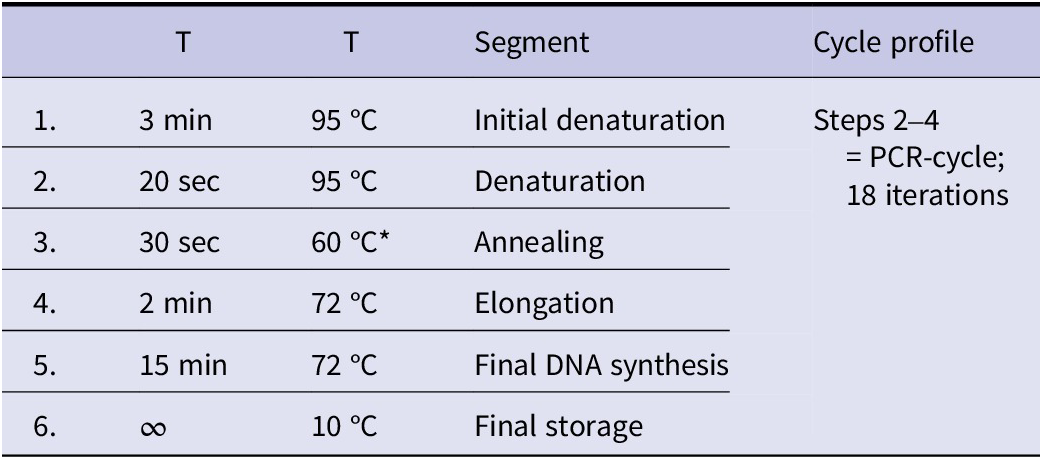
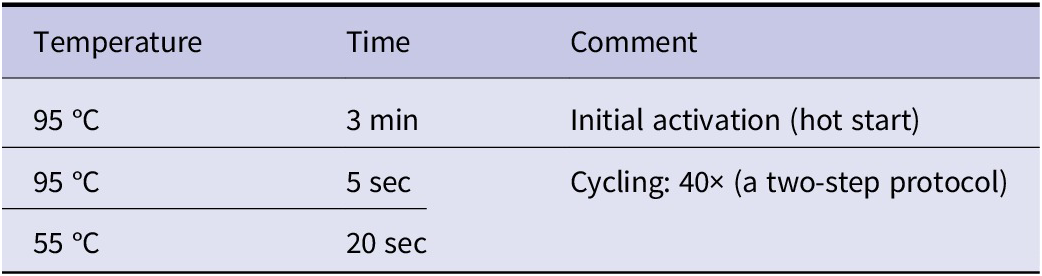
All PCR samples were identical; therefore, a master mix (100 μl) was prepared (Table 2) and then split. Table 3 shows the PCR profile.
Ingredients for PCR (a master mix was prepared; given values refer to a single 10 μl sample)

PCR profile

After PCR, one sample was set aside for AGE; the others were pooled to remove Mg2+, 0.5 M EDTA was added to a final concentration of 3 mM, which inhibits TaqPol. The mixture was then split again into 10 μl samples and subjected to denaturation at 95 °C for various time intervals. Immediately afterwards, the samples were incubated at 75 °C for 20 minutes to allow renaturation. (For denaturation and renaturation, the incubation function of the PCR cycler was used.)
1% (w/v) agarose gels were prepared for AGE. Electrophoresis buffer was 1× TAE (final concentration: 40 mM tris-acetate pH 8.0; 1 mM EDTA). After boiling in the microwave oven (900 W), the gel solution was cooled to approximately. 50 °C before adding SYBR Safe (final dilution 1:10,000, according to the manufacturer). Then the gel was poured. Electrophoresis was performed at a field strength of 5 V/cm at room temperature.
qPCR
Soya beans were purchased from standard traders and ground into flour in a mixer. As reference, soy meal from genetically modified soya containing glyphosate-resistant EPSP synthetase (#ERM-BF410bp GTS 40–3-2) was obtained from the Joint Research Center, Directorate F - Health, Consumers and Reference Material of the European Commission.
gDNA was isolated from this meal with the Genomic DNA from food kit from Macherey-Nagel (#740945.50). Yield and purity were determined by photometry (OD 260/280 nm).
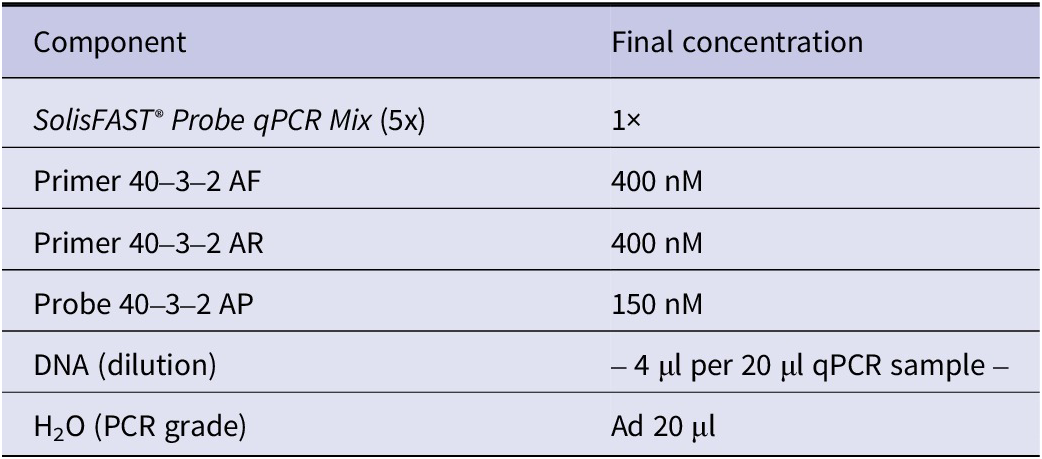
A hot-start TaqMan qPCR mix (SolisFAST® Probe qPCR Mix with UNG from Solis Biodyne, https://solisbiodyne.com; Cat# 28–21-0000S) was used. Table 4 shows the primers and the probe, Table 5 the ingredients of the PCR sample, and Table 6 the cycle conditions.
Sequences of primers (AF, AR) and probe (AP) for detection of GTS 40–3-2 (amplicon length 74 bp)

Composition of the PCR assay

qPCR cycle conditions. A StepOnePlus Real-Time PCR-System from applied biosystems was used

Abbreviations
- AGE
-
agarose gel electrophoresis
- bp
-
base pairs
- cDNA
-
complementary DNA (reverse transcribed from RNA)
- DNA
-
deoxyribonucleic acid
- gDNA
-
genomic DNA
- GMO
-
genetically modified organism
- HV I-III
-
hypervariable regions I-III
- kBp
-
kilo base pairs
- MPS
-
massively parallel sequencing
- mtDNA
-
mitochondrial DNA
- NGS
-
next-generation sequencing
- ORF
-
open reading frame
- PCR
-
polymerase chain reaction
- qPCR
-
quantitative PCR
- RT-PCR
-
reverse transcription PCR
- SMART
-
switching mechanism at the 5′ end of RNA template
- STR
-
short tandem repeat
- TaqPol
-
thermostable DNA dependent DNA polymerase from Thermus aquaticus
Data availability statement
All relevant data are included in this publication or can be found in the cited literature.
Acknowledgements
We thank Prof. Dr. Katrin Grammann and Dennis Gluma for the qPCR data and Prof. Dr. Christian Hiepen for creating the illustrations of Figures 3, 6, and the graphical abstract.
Author contribution
Concept: A.B. / Manuscript: H.K. wrote the part about forensics, A.B. the rest/Experiments: STR profiling by H.K., DNA denaturation experiment by A.B., qPCR was planned by K.Grammann and performed by students of the Westphalian University of Appl. Sci., study course Molecular Biology (Bc) under supervision of D.Gluma.
Financial support
There has been no funding.
Competing interests
The authors declare none.