INTRODUCTION
Ecological interactions affect a variety of characteristics in the ecosystems in which they occur; from primary productivity to population dynamics and the reproduction of individuals (Dyer et al. Reference DYER, WALLA, GREENEY, STIREMAN and HAZEN2010). Ant–plant interactions are a common interaction in the tropics (Davidson & McKey Reference DAVIDSON and MCKEY1993, Heil & McKey Reference HEIL and MCKEY2003). Particular attention has been given to facultative mutualistic interactions between plants and ants, such as the ones found between extra-floral nectary-bearing plants and ants (Diaz-Castelazo et al. Reference DIAZ-CASTELAZO, GUIMARÃES, JORDANO, THOMPSON, MARQUIS and RICO-GRAY2010, Rico-Gray et al. Reference RICO-GRAY, GARCIA-FRANCO, PALACIOS-RIOS, DIAZ-CASTELAZO, PARRA-TABLA and NAVARRO1998). These interactions have been studied in detail using network analyses (Blüthgen & Fiedler Reference BLÜTHGEN and FIEDLER2004). Symbiotic plant–ant associations are restricted to the tropics (Heil & McKey Reference HEIL and MCKEY2003) and have been studied for the most part in a pairwise fashion with some recent publications using a network approach (Dáttilo et al. Reference DÁTTILO, IZZO, VASCONCELOS and RICO-GRAY2013, Emer et al. Reference EMER, VENTICINQUE and FONSECA2013, Guimarães et al. Reference GUIMARÃES, RICO-GRAY, OLIVEIRA, IZZO, DOS REIS and THOMPSON2007, Passmore et al. Reference PASSMORE, BRUNA, HEREDIA and VASCONCELOS2012). However, these studies have focused on comparisons between undisturbed and disturbed forests. To date, comparative studies of ant–plant networks are still scarce at larger regional geographic scales.
Obligate symbiotic plant–ant communities are ideal mutualistic associations in which to test hypotheses developed with a network approach. For example, two alternative hypotheses that can be tested are: (1) that interacting species converge and specialize for particular traits that characterize mutualistic associations and (2) interacting species evolve unique traits in association with specific species. Adapting by evolving a specific set of traits becomes a stable strategy when species richness increases in communities. If interactions among species are driven by the presence of core traits, it is possible that interaction networks develop similar structures across geographic ranges (Thompson Reference THOMPSON2005), i.e. species identity or richness should not influence community network structure. Structure should be maintained as long as there is a similar distribution of species along the specialization-generalization gradient. We thus predicted that the structure of obligate symbiotic plant–ant interactions will be similar, independent of the geographic location within which they are collected.
Several quantitative and qualitative metrics have been developed to study network structure (Blüthgen et al. Reference BLÜTHGEN, MENZEL and BLÜTHGEN2006, Jordano Reference JORDANO1987). Network structure and organization can be used to study network stability or resistance to species extinction. Network stability is typically inferred by simulating sequential removal of network species, either most connected to least connected, least abundant to more abundant species, or by the random removal of individuals (Dormann et al. Reference DORMANN, FRÜND, BLÜTHGEN and GRUBER2009, Memmott et al. Reference MEMMOTT, WASER and PRICE2004).
We studied communities of obligate symbiotic plant–ant associations located in three Neotropical forests. Specifically we expected that: (1) network structure (e.g. link distribution and distribution of asymmetries) does not vary geographically among obligate symbiotic plant–ant communities in Ecuador, Peru and Costa Rica although different numbers of plant and ant species may be found; (2) the degree of specialization of individual species present in these three communities does not vary geographically; and (3) sequential removal of better- to less-connected plant species from plant–ant obligate networks causes higher percentages of simulated ant extinction than sequential removal of random or less-abundant plant species. This result does not vary across the three communities.
METHODS
Study sites and field collections
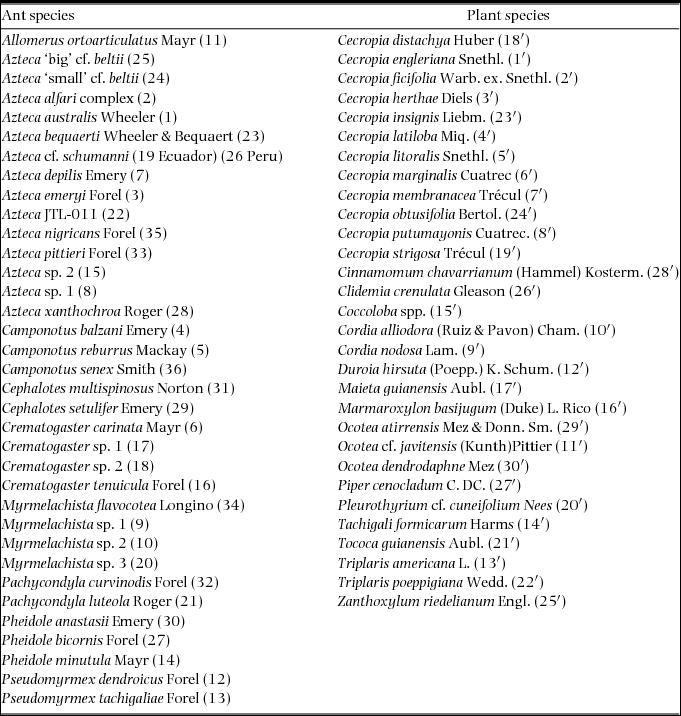
This research was carried out in three localities: (1) at La Selva Biological Station (10°26′N, 83°59′W), Costa Rica; (2) Yasuní Research Station (00°41′S, 76°24′W) in Yasuní National Park, Ecuador; (3) Research and Training Center at Los Amigos River (CICRA) (12°33′S, 70°06′W), the Madre de Dios area, Peru. The research stations visited are all located in lowland tropical rain forest (McDade & Hartshorn Reference MCDADE, HARTSHORN, McDade, Bawa, Hespenheide and Hartshorn1994, Valencia et al. Reference VALENCIA, CONDIT, FOSTER, ROMOLEROUX, VILLA MUÑOZ, SVENNING, MAGÅRD, BASS, LOSOS, BALSLEV, Losos and Leigh2004a). Annual rainfall averaged 3081 mm at the Yasuni Research Station. The wettest months are April–May and October–November and there are no months with less than 100 mm of rainfall. The annual average temperature in Yasuni is 28°C (Valencia et al. Reference VALENCIA, CONDIT, FOSTER, ROMOLEROUX, VILLA MUÑOZ, SVENNING, MAGÅRD, BASS, LOSOS, BALSLEV, Losos and Leigh2004a). At Los Amigos Biological Station mean annual rainfall from 2000–2006 was 2700–3000 mm (N. C. Pitman, unpubl. data). Long-term high-quality weather data from Los Amigos do not yet exist. However, mean temperatures for 2005 and 2006 were reported as 24°C in both years (N. C. Pitman, unpubl. data). The annual average rainfall from 1963–2010 at La Selva is 4375 mm with no apparent dry season (Cadol & Wohl Reference CADOL and WOHL2010). Mean annual temperature is 26°C (Cadol & Wohl Reference CADOL and WOHL2010). Yasuni National Park is known as one of the most diverse areas in the world (Bass et al. Reference BASS, FINER, JENKINS, KREFT, CISNEROS-HEREDIA, MCCRACKEN, PITMAN, ENGLISH, SWING and VILLA2010). A 25-ha tree inventory has recorded 1104 taxa represented in this area, making Yasuni the second most diverse area of all the other Forest Dynamics Plots in the Center for Tropical Forest Science network study areas (Valencia et al. Reference VALENCIA, CONDIT, ROMOLEROUX, FOSTER, VILLA MUÑOZ, LOSOS, BALSLEV, SVENNING, MAGÅRD, Losos and Leigh2004b). A 36-ha tree inventory at the Madre de Dios Area, where Los Amigos Biological Station is located, found 829 tree species (Pitman et al. Reference PITMAN, TERBORGH, SILMAN and NUÑEZ1999) while La Selva has 1400 ha and 1458 native plant species, with ~315 tree species (Hammel Reference HAMMEL and Gentry1990, Harsthorn & Hammel Reference HARTSHORN, HAMMEL, McDade, Bawa and Hespenheide1994). Myrmecophyte species richness for this study can be found in Table 1 and Appendix 1.
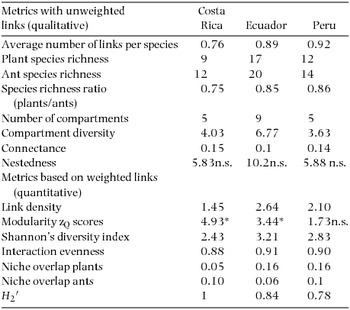
Summary of select qualitative and quantitative metrics for La Selva (Costa Rica), Yasuni (Ecuador) and Los Amigos (Peru) ant–plant networks. n.s.: Not significantly different from null models. * significantly different from null model.

We attempted to sample at least 10 individuals of each known myrmecophyte species with a minimum distance of 100 m between sampled individuals. In some cases, due to host rarity, less than five individuals per host species were sampled. Voucher leaves of Cecropia (Urticaceae) species and all ant species were deposited at Herbarium QCA (Quito, Ecuador), Museo Nacional de Costa Rica (San Jose, Costa Rica) and Museo de Historia Natural Universidad Nacional Mayor de San Marcos UNMSM (Lima, Peru). We did not collect vouchers of the other myrmecophyte species. Those were identified in situ, with the assistance of local naturalists, or through pictures taken for later identification. Only ant species from established colonies (e.g. presence of numerous workers and/or larvae and pupae) inside the domatia of the myrmecophytes were considered in this study. Established colonies were found in juvenile plants, e.g. without inflorescences present, as well as in adult reproductive trees. This procedure was followed to avoid collecting ants foraging opportunistically. Collections were made in Ecuador and Peru in January and February 2009 and in Costa Rica during May 2010. Since the ants are in an obligate symbiotic relationship with the plants, once they inhabit the host and establish as a mature colony they can be found in their tree regardless of the time of the year, season or weather conditions. Obligate ants are competitively superior to non-obligate ants when occupying their trees and non-obligate ants have not been found to be as dominant in mature myrmecophytes (Longino Reference LONGINO1989). Therefore, since juvenile or adult trees were sampled consistently among sites, sampling closely different years will not change the network structure by obligate symbiotic ants interacting.
Specimen identification and barcode analyses
All collected ants were mounted and labelled. One of the main ant genera that interact with myrmecophytes in the Neotropics is Azteca. Azteca (Formicidae: Dolichoderinae) identifications were confirmed following J. Longino's Costa Rican Azteca key (http://academic.evergreen.edu/projects/ants/genera/azteca/key.html) and taxonomic revisions for Azteca in Costa Rica (Longino Reference LONGINO1991, Reference LONGINO2007). After initial Azteca identification, specimens were directly compared with those at the Smithsonian National Museum of Natural History and in the J. Longino Azteca collection. Azteca alfari Emery and A. ovaticeps Forel were identified to the species level when queens were available. When only workers were available, identification was less certain so we followed expert advice and pooled all individuals from these two species into the alfari complex (J. Longino, pers. comm.). J. Longino identified A. emeryi Forel and verified Azteca species that were not barcoded. Ant collections were deposited at the Museum of Zoology at the Pontificia Universidad del Ecuador, Quito (QCAZ).
Because Azteca species frequently show little morphological differentiation, ant samples from Ecuador and Costa Rica were barcoded. Ants were barcoded by sequencing the cythochrome oxidase I gene (COI), which sorts unidentified individuals into species or species groups, and has been especially useful with ants (Smith et al. Reference SMITH, RODRIGUEZ, WHITFIELD, DEANS, JANZEN, HALLWACHS and HEBERT2008). A maximum of five individuals per species were used. A piece of a leg from each individual ant was collected and placed on a microplate with a drop of ethanol. Utensils were sterilized with 95% ethanol to avoid cross-contamination. Microplates were sent to the Canadian Centre for DNA barcoding (CCDB). Detailed laboratory procedures can be found in Smith et al. (Reference SMITH, RODRIGUEZ, WHITFIELD, DEANS, JANZEN, HALLWACHS and HEBERT2008). Sequence divergences were obtained using the Kimura 2 parameter distance model (Kimura Reference KIMURA1980) and visualized with a neighbour-joining tree.
Branches from myrmecophytic trees were sampled by climbing, with a pole pruner, or with a crossbow. Resident ants were collected and preserved in 95% ethanol. Plant species were photographed and identified in situ or with help from local taxonomists. Cecropia branches/leaves were collected, pressed and dried.
Network structure of plant–ant interactions
Basic qualitative (presence and absence data) and quantitative metrics (frequency of interactions) were calculated using bipartite package version 1.17 for R using the function networklevel. Matrices with ant species by plant species were built and cells contained the number of times a specific plant and ant were found to interact. The number of times a species was observed interacting with another was recorded as the total number of observations for that species. The link distribution was obtained by taking the total number of occupied cells in the matrix per ant species. Nestedness was calculated using non-weighted NODF, which corrects for matrix dimensions and fill (Almeida-Neto & Ulrich Reference ALMEIDA-NETO and ULRICH2011, Almeida-Neto et al. Reference ALMEIDA-NETO, GUIMARAES, GUIMARÃES, LOYOLA and ULRICH2008). Nestedness values of close to zero show no nested patterns and values closer to 100 show perfect nestedness. Modularity Q was calculated to test if modularity found in these networks is higher than would be expected in randomly interacting networks (Dormann & Strauss Reference DORMANN and STRAUSS2014). Modularity Q was corrected by a null model that keeps marginal totals and connectance at the same level as the observed data (vaznull), because the Q value is dependent on network size and the number of links (Dormann & Strauss Reference DORMANN and STRAUSS2014). This correction produces a z-score assumed to be normally distributed. Values of z above 2 are considered significantly modular (Dormann & Strauss Reference DORMANN and STRAUSS2014). Niche in this study refers to the host plants available for an ant to use, and niche overlap calculations used Horn's similarity index, which is not strongly affected by sample size (Krebs Reference KREBS1999). Values close to zero indicate no overlap in host use, while 1 shows total overlap in host use.
Asymmetries in networks were calculated using the interaction-push-pull index calculated by the specieslevel function in bipartite. Values of this index are between −1 and 1, where positive values indicate that a species affects more the species with which it interacts than vice versa. It quantifies whether dependencies between interacting organisms are symmetric.
Two-sample Kolmogorov–Smirnov (K-S) tests were used to compare link distributions in our networks (Stuart et al. Reference STUART, ORD and ARNOLD1999). Three two-sample comparisons among our sites were performed. The distribution of asymmetries, where zero and non-zero values were used, found in the three networks were compared using Pearson's Chi-square test. Fisher's exact test (Agresti Reference AGRESTI2007) was also performed only with non-zero values. Statistical analyses were performed in R Version 2.7.0, (R Core Team, Vienna, Austria) and SAS ® Version 9.4 with 13.1 analytics (SAS Institute, Cary, NC, USA).
The observed H 2′ specialization index (Blüthgen et al. Reference BLÜTHGEN, MENZEL and BLÜTHGEN2006) was compared with the distribution under the Vázquez null model which is very conservative, holding marginal totals approximately and connectance absolutely constant (Dormann et al. Reference DORMANN, FRÜND, BLÜTHGEN and GRUBER2009, Vázquez & Aizen Reference VÁZQUEZ and AIZEN2003). We generated 1000 matrices with values conforming to associations that followed this null model, and compared these matrices with observed data. We computed the specialization index d′ for each plant and ant species (Blüthgen et al. Reference BLÜTHGEN, MENZEL and BLÜTHGEN2006) and compared their distribution across country of origin with Fisher's exact test.
Network resistance to species extinction
Rarefaction was applied to entire interaction networks because different total samples were obtained in each country (Blüthgen Reference BLÜTHGEN2010). Peru had the lowest number of interactions (70). Therefore, 70 samples were randomly obtained from the interaction matrices in Ecuador and Costa Rica. The process of obtaining 70 plant samples from the matrices in Ecuador and Costa Rica was repeated 1000 times. This procedure was performed without replacement, and mean matrices produced for Ecuador and Costa Rica were used in the simulation.
Plant extinctions were simulated in each location to determine the effect of the stepwise reduction of nesting places by ants in each community. One plant species after the other was randomly removed stepwise without replacement, producing the reference with which to compare the two systematic removals: (1) beginning with the least abundant plants and progressing to increasingly abundant, and (2) beginning with highly connected plants (used by most number of ant species) towards less connected plants. The random simulations were repeated 1000 times.
The observed proportions of non-extinct ant species were treated as a continuous variable between 0 and 1. The probability distribution of ant survival for each country and type of removal was modelled as a beta distribution using a generalized linear model (GLM) approach. Modelling the mean of a beta distribution as a linear model can be accomplished by using the logit function:
 \begin{equation*}
\log \it{it}(p) = {\it In}(p/[1 - p]),
\end{equation*}
where ln is the natural logarithm function. Initially we fitted a quadratic function of the proportion of plant extinction on the logit scale allowing regression coefficients to depend on the type of sequential removal, the country where the samples were taken, and the type of removal by country interaction using analysis of covariance techniques. Non-significant terms were removed from the model and the model was refitted until an adequate model was obtained. For presentation purposes, the results were back-transformed to proportions of ant survival. We omitted data points with all plants present (0% extinction) and all extinct (100% extinction). GLM analyses were performed using SAS ® version 9.4 with 13.1 analytics (SAS Institute, Cary, NC, USA).
Robustness (R) was calculated to measure the area under the extinction curve (Burgos et al. Reference BURGOS, CEVA, PERAZZO, DEVOTO, MEDAN, ZIMMERMANN and DELBUE2007), and it was calculated on the 1000 rarefied matrices. This index represents network robustness to species extinction. R-values close to 1 come from robust networks and values close to zero result from curves where species extinction has immediate consequences for the other trophic level, i.e. networks are not robust to even a small loss of plant species (Burgos et al. Reference BURGOS, CEVA, PERAZZO, DEVOTO, MEDAN, ZIMMERMANN and DELBUE2007). A one-way ANOVA was performed using the 1000 robustness values from rarefied matrices to compare values among localities per each type of plant removal. Relative robustness (R*) was also calculated where  $R^*\; = \;(R\; - \;\hat R_0 )/\hat R_0$, where
 $\hat R_0$ is the average robustness of the null model (Emer et al. Reference EMER, VENTICINQUE and FONSECA2013).
RESULTS
Network structure of plant–ant interactions
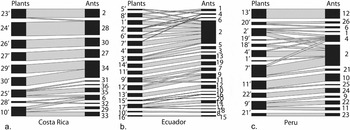
The link distribution of the networks showed that most species were connected to others by fewer than ten links. In Ecuador, the Azteca alfari-complex (ant species 2 in Figure 1) was connected to different plant species with eight links, while the maximum links found at other locales were five in Peru, and three in Costa Rica. On average, a similar number of links per species were found in the three localities (Table 1). Link distribution was not significantly different among localities (P > 0.05; Ecuador vs. Peru D = 0.14, Ecuador vs. Costa Rica D = 0.1, Costa Rica vs. Peru D = 0.14), and asymmetry distributions for plant or ant species (P > 0.05) also were not significantly different. Networks from Costa Rica and Ecuador were significantly more modular than expected for random networks (Table 1). Ecuador had the lowest connectance, while Peru and Costa Rica had similar proportions of realized interactions. None of the networks was significantly nested (P > 0.05, in each case).
Network figure showing ant–plant interactions in myrmecophyte plants and their ant associates. Plant and ant species were identified by appropriate taxonomists. In addition, ants from Ecuador and Costa Rica were barcoded at the Canadian Centre for DNA barcoding (CCDB). Sampling locations: La Selva (Costa Rica) in 2010 (a), Yasuni (Ecuador) in 2009 (b) and Los Amigos (Peru) in 2009 (c). Horizontal bars indicate pairwise species associations. Width of horizontal bars indicates relative frequency of the association. Numbers with apostrophes represent plant species and without apostrophes represent ant species (Appendix 1).

Network interactions were more diverse in Ecuador than in Peru or Costa Rica as shown by the Shannon diversity index (Table 1), although interaction evenness showed that there was not much variation in interaction frequencies in these three communities. Low values of interaction evenness, close to zero, were linked to high variation in interaction frequencies. There was very little niche overlap among species in each trophic level in all sites as measured by Horn's similarity index (Table 1). Values of H 2′ in the three sites were significantly different from the vaznull null model (P < 0.01 in Ecuador and Costa Rica, P < 0.05 in Peru), showing that these plant–ant interactions are highly specialized.
Degree of species specialization
The distribution of d′ values was not significantly different among ant or plant communities (Fisher's exact test; ants P = 0.59, plants P = 0.11). Among ants, the Azteca alfari complex was present at the three locales and in Costa Rica reached the highest level of specialization. Azteca australis had a higher specialization index in Ecuador than in Peru while Camponotus balzani had an index with more specialization in Peru than in Ecuador.
Network resistance to species extinction
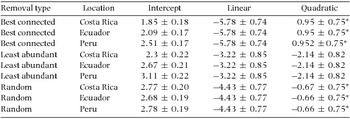
The final fitted model for ant survival as a function of plant extinction consisted of quadratic functions at the logit scale in which linear and quadratic coefficients differed by removal type (F3/84 = 36.2, P < 0.0001 for linear and F3/84 = 3.08, P = 0.032 for quadratic coefficients, respectively), but not by location (F2/80 = 1.39, P = 0.254 for linear and F2/80 = 2.08, P = 0.132, for quadratic coefficients). Intercept terms depended on the removal type × location interaction (F9/84 = 72.49, P < 0.0001). The relationship between plant extinction and ant survival is better explained by a linear fit, when plant species are removed either from the best-connected to the least-connected or randomly, since their quadratic coefficients were not significantly different from 0 (Table 2, t84 = 0.952, P = 0.206 and t84 = −0.059, P = 0.381, respectively). When plant species were removed from the least to the most abundant, ant survival was best explained by a quadratic association (Table 2, t84 = −2.14, P = 0.0106).
Plants and their symbiont ants were collected in Costa Rica, Ecuador and Peru and a model was constructed to show the relationship between non-extinct ant species as a function of the proportion of extinct plant species. Estimated coefficients for the final fitted model are provided as estimated coefficient ± SE. * indicates that the coefficient is not significantly different from 0 (P = 0.05) based on a t-test.

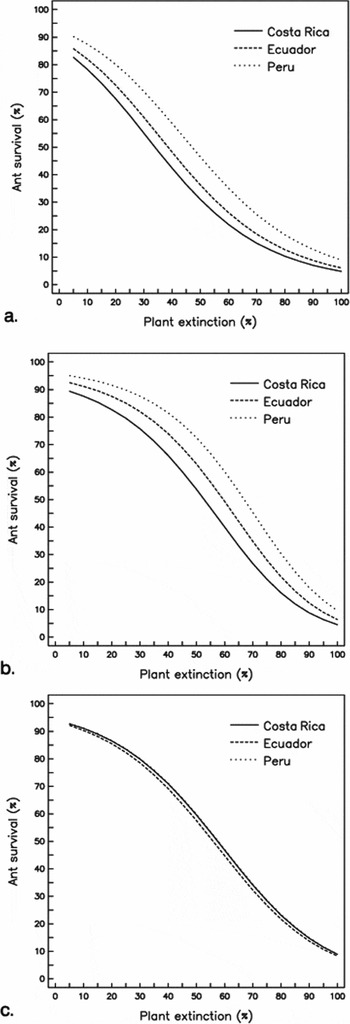
Geometrically the model on the logit scale was represented by sets of curves, one per removal type, where curves representing locations are parallel within each set (Figure 2 for the back-transformed curves). For best-connected and least-abundant removals, all three locations were significantly different (F2/84 = 17.8, P = 0.038 best-connected, F2/84 = 21.8, P = 0.0013 least-abundant).
Results from simulations performed to infer the number of ant species that will not go extinct or disappear after the sequential removal of plant species. Plants and their symbiotic ants were collected in Costa Rica, Ecuador and Peru. Plant species were removed in three ways: best-connected to least-connected (a), least-abundant to most-abundant (b), and randomly (c). Ant survival was modelled as a function of plant extinction based on the final fitted model back-transformed from the logit scale with: best connected removal (a), least abundant removal (b) and random removal (c).

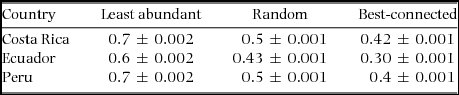
Random plant removals produced similar proportions of estimated ant extinction for all sites (Figure 2, F2/84 = 0.57, P = 0.568). Random removals showed that when 75% of the plant species were removed, only about 27% of ant species were still present. Plant removals in general showed that the ant–plant interactions are vulnerable to plant loss (Table 3), that robustness values were significantly different (P < 0.01) among localities for the best-connected, least-abundant and random plant removals, and that the null model is more robust than the observed networks (P < 0.025).
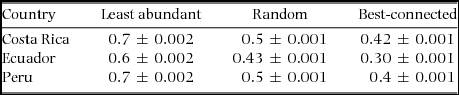
Data on plants and their symbiotic ant associates collected in Costa Rica, Ecuador and Peru were used to calculate robustness of these interactions. Robustness represents the area under the extinction curve and in this case shows how robust the interactions are to plant species extinctions. Mean robustness ± SE values to plant species extinctions are shown from 1000 rarefied matrices. Robustness is an index with values from 0–1; 0 shows no robustness to plant species extinction, and 1 equals robustness to plant species extinction.
DISCUSSION
Our research showed that some network structure features such as link distribution, distribution of asymmetries, and distribution of d′ values, did not vary among the three communities. However, link density and H 2′ were different among the three communities. Our findings showed that neither ant nor plant identity nor richness had an effect on link distribution, degree of specialization of each node, or asymmetry distribution. The structure of symbiotic obligate plant–ant communities in Costa Rica and Ecuador was significantly more modular than expected in random networks. Overall networks and species were highly specialized.
Schleuning et al. (Reference SCHLEUNING, FRÜND, KLEIN, ABRAHAMCZYK, ALARCÓN, ALBRECHT, ANDERSSON, BAZARIAN, BÖHNING-GAESE, BOMMARCO, DALSGAARD, DEHLING, GOTLIEB, HAGEN, HICKLER, HOLZSCHUH, KAISER-BUNBURY, KREFT, MORRIS, SANDEL, SUTHERLAND, SVENNING, TSCHARNTKE, WATTS, WEINER, WERNER, WILLIAMS, WINQVIST, DORMANN and BLÜTHGEN2012) in a study focused on plant-pollinator and seed-disperser associations with plants argued that biotic specialization decreased with the increase of local and regional plant diversity. Although we have too few sites to demonstrate a latitudinal pattern in specialization, our results agree with those of Schleuning et al. (Reference SCHLEUNING, FRÜND, KLEIN, ABRAHAMCZYK, ALARCÓN, ALBRECHT, ANDERSSON, BAZARIAN, BÖHNING-GAESE, BOMMARCO, DALSGAARD, DEHLING, GOTLIEB, HAGEN, HICKLER, HOLZSCHUH, KAISER-BUNBURY, KREFT, MORRIS, SANDEL, SUTHERLAND, SVENNING, TSCHARNTKE, WATTS, WEINER, WERNER, WILLIAMS, WINQVIST, DORMANN and BLÜTHGEN2012). To the best of our knowledge, no studies have been performed that compare myrmecophyte species richness along a latitudinal gradient in the Neotropics, but this study demonstrated myrmecophyte species richness was lowest in Costa Rica and highest in Ecuador with an intermediate value in Peru (Table 1, Appendix 1). Values of H 2′ in this study are in line with other tropical studies, but are considerably higher (~0.8) than those found on seed-disperser or plant-pollinator networks (~0.25 and 0.35, respectively) (Schleuning et al. Reference SCHLEUNING, FRÜND, KLEIN, ABRAHAMCZYK, ALARCÓN, ALBRECHT, ANDERSSON, BAZARIAN, BÖHNING-GAESE, BOMMARCO, DALSGAARD, DEHLING, GOTLIEB, HAGEN, HICKLER, HOLZSCHUH, KAISER-BUNBURY, KREFT, MORRIS, SANDEL, SUTHERLAND, SVENNING, TSCHARNTKE, WATTS, WEINER, WERNER, WILLIAMS, WINQVIST, DORMANN and BLÜTHGEN2012).
These obligate associations were not robust to plant extinctions, in general, and removal of the best-connected plant species had a slightly greater impact on ant species persistence. Relative robustness in best-connected removals of plant species showed that these networks are not as robust as the ones produced by the vaznull model. This outcome is different from Passmore et al. (Reference PASSMORE, BRUNA, HEREDIA and VASCONCELOS2012), but those authors faced limitations with ant identifications, isolation of forest fragments, and protection of these isolated plots from anthropogenic disturbances. All these factors, they conclude, could make their results more conservative. Also, the networks of Passmore et al. (Reference PASSMORE, BRUNA, HEREDIA and VASCONCELOS2012) were slightly less specialized than those in our study and others in Brazil.
In contrast, Emer et al. (Reference EMER, VENTICINQUE and FONSECA2013) found that networks in undisturbed forests, lake-edge environments and islands were more sensitive to secondary extinctions when plants were eliminated first. Interactions maintained on islands were significantly less robust than the null model. They observed that symbiotic plant–ant interaction networks lost their compartmentalized structure in lake-edge environments, and networks observed on islands had the lowest compartmentalized value in comparison to undisturbed forests.
In this study curves produced by plant extinction simulations were different from plant-pollinator extinction curves (Kaiser-Bunbury et al. Reference KAISER-BUNBURY, MUFF, MEMMOTT, MÜLLER and CAFLISCH2010, Memmott et al. Reference MEMMOTT, WASER and PRICE2004). Curves generated by this study were more linear and their more linear shape was a direct consequence of extremely high specialization in several compartments of the networks studied. Random removals of the symbiotic associations showed almost a 1:1 relationship in the curves, product of the very high specialization in the system. As in Memmott et al. (Reference MEMMOTT, WASER and PRICE2004), sequential removal of the best-connected to the least-connected species resulted in the fastest rate of ant species loss while removal of the least-abundant species or random removal resulted in the slowest loss rate (Figure 2). This pattern occurred in each of the three locales. These networks were not robust to plant loss due to the high levels of specialization. Aizen et al. (Reference AIZEN, SABATINO and TYLIANAKIS2012) found a similar result in pollination networks in Argentina.
Interaction frequencies among some species in the three locales varied (Figure 2) indicating that the ecological impact of species forming these networks varied among location (Blüthgen Reference BLÜTHGEN2010). For example, the Azteca alfari complex seemed to play a more important role connecting several plant species in Ecuador and Peru than in Costa Rica. It would be important to explore the consequences of the variation among interaction frequencies on plant benefits at a regional scale if data were available.
In conclusion, some metrics showed that network structure was similar across locations. H 2′ showed that these interactions are highly specialized and plant simulation extinctions showed that these networks are not robust to plant loss. Evaluation of the stability of ant-plant associations was conducted from the perspective of static networks without regard to behavioural flexibility measured as switches in interactions. A more dynamic approach should increase our understanding of interaction dynamics because ant–plant interactions may change with the hosts’ stage of development. The incorporation of plant and ant phylogenies to the networks produced in this study would provide an evolutionary context which is needed to test additional hypotheses and to better understand compartment evolution in obligate symbiotic interactions. We also need more information about the possible adaptive responses of ants in these communities to better incorporate them into simulations.
ACKNOWLEDGEMENTS
Funding for this project came from WWF's Russell E. Train Education for Nature Program, Organization for Tropical Studies (Glaxo Fund), and Dissertation Research Award, Fulbright College of Arts and Sciences, University of Arkansas to PB and NSF, Office of International Science and Education grant # 0813594 to CS and N. Garwood. We acknowledge J. Trager, A. Wild, D. Donoso, J. Longino, W. Mackay for ant identifications/verifications. C. C. Berg, F. Michellangeli, D. Penneys, H. van der Weff, J. Gonzalez and J. P. Latorre for plant identification/verification. A. Smith for barcode cooperation. A. Barragan, H. Navarrete, OTS-Costa Rica, OTS-Peru, N. Blüthgen, G. Petris, A. Dowling and staff at Yasuni Research Station for help with logistics, equipment and/or advice. To J. L. Hamrick for editorial support. To Ministerio del Ambiente in Ecuador, Ministerio de Agricultura in Peru and to Ministerio de Ambiente y Energia in Costa Rica for permits to conduct this research.
Ant and plant species found at La Selva (Costa Rica), Yasuni (Ecuador) and Los Amigos (Peru). Numbers in parentheses match the numbers in network figures (Figure 1).