I. INTRODUCTION
Composites of soft compliant polymers and conductive fillers have long been investigated to enable devices with a range of functionalities including sensors,Reference Zare and Shabani1,Reference Kim, Kim and Park2 inductors,Reference Lazarus, Meyer, Bedair, Slipher and Kierzewski3 conductive components,Reference Zare and Shabani1,Reference Park, Park and Jeong4,Reference Mrozek, Cole, Mondy, Rao, Bieg and Lenhart5 actuators,Reference Stoyanov, Kollosche, Risse, Waché and Kofod6 and EMI shielding.Reference Al-Saleh and Sundararaj7 Polymer composites are commonly based on hard spherical particles dispersed homogenously in a continuous polymer phase.Reference Voet8,Reference Pal9 These systems, while conceptually simple, are limited in their functionality by an upper filler concentration limit (maximum random packing fraction).Reference Seth, Mohan, Locatelli-Champagne, Cloitre and Bonnecaze10 At high filler concentrations, the deformation characteristics of the composite material often suffer from increased stiffness, reduced elongation at break, and decreased mechanical damping that, for elastomers, can render the device no longer compliant.Reference Pishvaei, Graillat, McKenna and Cassagnau11,Reference Olhero and Ferreira12 Nonspherical solid fillers, such as metal flakes,Reference Itabashi, Inoue and Tada13 graphene,Reference Kim, Zhao, Jang, Lee, Kim, Kim, Ahn, Kim, Choi and Hong14,Reference Liu, Li, Dai, Zheng, Liu, Shen, Yan, Guo and Guo15 and carbon nanotubes,Reference Sekitani, Nakajima, Maeda, Fukushima, Aida, Hata and Someya16 generally have similar material/electronic challenges even though lower concentrations are required to obtain electrical performance as changes in the deformation behavior will also occur at lower concentrations. Room-temperature liquid eutectic metals, such as those based on gallium, have received considerable interest as an alternative to rigid conductive particles due to their high conductivity, ability to stretch and deform, and reduced soft/stretchable material tradeoff.Reference Lazarus, Meyer, Bedair, Slipher and Kierzewski3,Reference Stoyanov, Kollosche, Risse, Waché and Kofod6,Reference Bartlett, Fassler, Kazem, Markvicka, Mandal and Majidi17–Reference Tabatabai, Fassler, Usiak and Majidi20
Eutectic gallium–indium–tin (galinstan) and eutectic gallium–indium (EGaIn) have been studied as compliant conductive materials for soft, stretchable devices. Prior work studying EGaIn and galinstan as conductive components has been largely based on microfluidics for conformal, stretchable, and electronic devices. The majority of this work has focused on using the room-temperature liquid metals to fill microfluidic channels to pattern the device architecture. A significant challenge of incorporating liquid metals into microfluidics is that adhesion between the liquid metal oxide shell and the polymer microfluidic walls also often leads to a build-up in pressure and rupture of the channels.Reference Khan, Trlica, So, Valeri and Dickey21 In addition, fabrication of microfluidic devices commonly requires significant investment of time and instrumentation for patterning, etching, and filling.Reference Khoshmanesh, Tang, Zhu, Schaefer, Mitchell, Kalantar-zadeh and Dickey22 While techniques are being developed to overcome these challenges, microfluidic liquid metal devices remain a high labor, high investment means of making a stretchable, soft device. Printing of EGaIn and galinstan is also currently being explored, but the liquid metal material properties have made simple, scalable processes difficult.Reference Tabatabai, Fassler, Usiak and Majidi20,Reference Ladd, So, Muth and Dickey23,Reference Parekh, Ladd, Panich, Moussa and Dickey24 For example, EGaIn and galinstan have surface tensions exceeding 500 mN/m, which greatly decreases the ability to jet droplets out of a nozzle.Reference de Gans, Duineveld and Schubert25 In addition, the oxide skin that forms nearly instantaneously on the surface of the liquid metals increases the viscosity and yield stress of the material making flow out of a printer nozzle difficult.Reference de Gans, Duineveld and Schubert25–Reference Xu, Oudalov, Guo, Jaeger and Brown28 Another, potentially simpler, method of incorporating liquid metals into a polymer matrix is through blending to form dispersions.
Typically, control of final dispersion characteristics comes from the instrument parameters (type of mixer, impeller, speed, time, etc.) and the dispersion formulation parameters (type of filler, filler loading, matrix viscosity, etc.).Reference Gutiérrez, González, Maestro, Solè, Pey and Nolla29,Reference Singh, Meher, Raval, Khan, Chaurasia, Jain and Chourasia30 For stretchable electronic materials, it is particularly important to understand how the instrument and formulation parameters will influence material stiffness and capacitance/conductivity. In general, the capacitance or conductance of a material will be modulated through filler loading, with higher loadings leading to increased permittivity/conductivity.Reference Mrozek, Cole, Mondy, Rao, Bieg and Lenhart5,Reference Bartlett, Fassler, Kazem, Markvicka, Mandal and Majidi17 A stiffer matrix material may be made by using a more highly cross-linked polymer while a softer material may be generated by a polymer with less cross-links or more of a “solvent” phase to form a polymer gel.Reference Mrozek, Knorr, Spangler, Cole and Lenhart31 The mechanical control over dispersion properties, however, is generally eclipsed by the increased stiffness generated by the filler, which increases exponentially with increased filler loading and is limited by a maximum random packing fraction (e.g., 55 vol% for monodisperse spheres).Reference Song, Wang and Makse32 By contrast, emulsions are liquid–liquid dispersions that are subject to similar control parameters but can be formulated to have a wide variety of viscosities, phase compositions, and dispersed filler loadings up to ≥90 vol%.Reference Masalova, Foudazi and Malkin33,Reference Pal34 Dispersions of liquid metals, as conductive, deformable filler materials, in an initially fluid, uncured polymer matrix may allow for conductive filler loadings that exceed typical particle packing limitations while having a minimal impact on the mechanical properties of the host polymer. This level of control would allow for the electrical properties to be tailored through the metal dispersion and loading independent of the mechanical properties of the host polymer to address the needs of a wide variety of practical applications.
However, while dispersions of hard conductive materials into a polymer matrix have been studied extensively for decades, dispersions of liquid metal are a more recent addition to the literature. Droplets of EGaIn and galinstan in water and organic solvents have been controlled through the use of flow-focusing microfluidics (which allows for control of size and shape, but is a low throughput method)Reference Thelen, Dickey and Ward35,Reference Hutter, Bauer, Elliott and Huck36 and surfactants or other interfacial components.Reference Hohman, Kim, Wadsworth, Bednar, Jiang, LeThai and Weiss37,Reference Lin, Liu, Genzer and Dickey38 The literature focused on liquid metal dispersions in elastomers is more limited. Kazem et al. measured the permittivity and modulus of EGaIn in silicone or polyurethane dispersions up to 50 vol% liquid metal. They determined that the dispersion’s relative permittivity followed effective medium theory predictions (at the 50 vol% EGaIn, relative permittivity, εr, reached ∼20) and strains at a break of ∼600% were reached.Reference Kazem, Hellebrekers and Majidi19 Bartlett et al. created similar devices and measured thermal conductivities up to 4.7 W/(m K) at >600% strain.Reference Bartlett, Fassler, Kazem, Markvicka, Mandal and Majidi17 Jeong et al. made dispersions of galinstan in polydimethylsiloxane (PDMS) with loadings up to 66 vol% but evaluated the resulting devices as pure electrical insulators (resistivity >0.5 GΩ cm) modulating the material properties through metal loading. These devices demonstrated thermal conductivity up to 2.2 W/(m K).Reference Jeong, Chen, Huo, Gamstedt, Liu, Zhang, Zhang, Hjort and Wu39 Fan et al. showed even higher thermal conductivities up to 6.73 W/(m K) for dispersions of EGaIn in silicone oil with liquid metal volume fractions up to 85.7 vol%.Reference Fan, Sun, Wang, Chang, Zhang, Yao, Lu, Rao and Liu40
While dispersing liquid metal into a soft polymer matrix is conceptually simple, it is critical to understand the complicated effects of formulation (i.e., metal loading, metal viscosity, and matrix viscosity) and processing parameters (i.e., mixing method, speed, and duration) on the final dispersion properties (morphology, rheology, and permittivity/conductivity). The subsequent discussion systematically explores these relationships in galinstan-PDMS dispersions to determine the advantages of using a room-temperature, liquid metal relative to a more traditional rigid particulate additive. The authors chose to focus on galinstan due to its low melting point providing a larger operational temperature range; however, it is anticipated that the trends will be applicable to most liquid metals (i.e., EGaIn). The electrical and mechanical properties of galinstan-PDMS dispersions were characterized in both the uncured and cured state to better understand the material characteristics present during processing (uncured) and device usage (cured), respectively. The influence of galinstan addition was also compared to a model liquid and solid additive to provide quantitative insight into the advantages of using a liquid metal filler for electronic applications. For example, at increased galinstan concentrations, an electrically conductive phase inverted system composed of PDMS in a continuous galinstan phase was obtained. As a result, PDMS-galinstan dispersions can comprise a complete set of materials with largely independently tunable mechanical and electrical properties from electrically insulating (low to high permittivity) to electrically conductive. This wide range of design space has the potential to enable a broad range of stretchable electronic devices.
II. EXPERIMENTAL
A. Materials
Galinstan was purchased from Rotometals (San Leandro, California) as 68.5% Ga 21.5% In 10% Sn. All PDMS was purchased from Gelest, Inc. (Morrisville, Pennsylvania). Vinyl-terminated PDMS was used at molecular weights of 28,000 (DMS-V31, 1 × 10³ cSt) and 62,700 (DMS-V41, 1 × 10⁴ cSt) g/mol. Methyl-terminated PDMS was used at molecular weights of 1250 (DMS-T11, 10 cSt), 62,700 (DMS-T41, 1 × 10⁴ cSt), and 308,000 (DMS-T61, 1 × 10⁶ cSt) g/mol. Conductive nickel particles were 10 µm in diameter on average and were purchased from Novamet (Wyckoff, New Jersey). Mineral oil was purchased from VWR (Suwanee, Georgia) and used as-received. Cured samples were mixed with 800 ppm platinum–cyclovinylmethylsiloxane complex catalyst and tetrakis (dimethylsiloxy)silane cross-linker. Catalyst and cross-linker were also purchased from Gelest, Inc.
B. Forming dispersions
Four different PDMS formulations were used to make galinstan/PDMS dispersions: 1:3 V31:T11 (37 cP), 1:1 V41:T11 (860 cP), 1:1 V41:T41 (10,338 cP), and 1:1 V41:T61 (160,083 cP) (all ratios are by volume, full rheology provided in the Supplementary Material). The blend ratios were selected to systematically vary the uncured viscosity. Where possible, the ratio of vinyl-to methyl-terminated PDMS was held constant to avoid variations in vinyl-functional group density. Galinstan in PDMS dispersions were mixed using a Caframo overhead mixer (Georgian Bluffs, Ontario, Canada) with a turbine stirrer for 2 h at 2000 rpm. PDMS in galinstan dispersions were formed using the same overhead mixer, stirring for 15 min. Galinstan-in-PDMS dispersions were formed at 30, 50, 70, and 80 vol% galinstan as possible for each PDMS matrix viscosity. No macroscopic phase separation or particle aggregation was observed during the time scale of the experiments performed. Settling of 30 vol% dispersions was observed, due to the density difference between galinstan and PDMS, so these dispersions were remixed for an additional 30 s before being measured. Limited settling while rheology was being measured was not found to significantly alter results.
Galinstan dispersions of 30, 50, and 70 vol% in V41:T11 were also evaluated after curing. Cured dispersions were cooled to 15 °C for 30 min prior to catalyst and cross-linker addition. The solution was mixed for an additional one minute before loading the sample into the rheometer in a parallel plate geometry for cure at 82 °C. One PDMS-in-galinstan dispersion (phase inverted) was formed for each PDMS matrix viscosity at the lowest galinstan level consistently possible (50, 70, or 90 vol%). No PDMS-in-galinstan samples were cured. Formulations of nickel (10, 30, and 50 vol%) and mineral oil (10, 20, and 30 vol%, no surfactant) were also made with V41:T11 PDMS and tested both uncured and cured in the rheometer similar to galinstan dispersions. All the samples were made and tested in triplicate. All the cured samples were free-standing and showed no phase separation or particle aggregation during the time scale of the measurements.
C. Dispersion characterization
The viscosity and modulus (η*, G′, and G″) of all dispersions were measured at 25 °C on an Anton-Paar (Graz, Austria) MCR501 rheometer with the dielectric-rheological accessory (using two steel parallel plates). Cured samples' viscosity and modulus were measured at 25 °C after being heated to 82 °C on the rheometer for post-curing measurements. Sample impedance was interrogated on the rheometer using an ENA Series E5061B Agilent Technologies (Santa Clara, California) network analyzer varying frequency from 1 kHz to 1 MHz. Rheology and permittivity of neat PDMS samples were similarly analyzed for comparison. Galinstan in PDMS dispersion size and morphology were observed using confocal microscopy. PDMS in galinstan dispersions were observed with X-ray computed tomography (CT) scanning using a Zeiss Xradia 520 (Oberkochen, Germany). The scan power was 80 kV and 7 W with a 0.935 µm voxel size.
III. RESULTS AND DISCUSSION
A. Uncured dispersion rheology
The rheology of solid suspensions in an immiscible liquid phase and suspensions of liquids in an immiscible liquid phase are substantially different in large part due to the deformability of a suspended liquid. The ability of an immiscible dispersed liquid to deform causes a slower transition to solid-like rheological behavior with increasing volume fraction and a higher overall maximum concentration relative to a rigid particulate filler. For example, dispersions of solid monodisperse spheres are constrained by an upper theoretical maximum random packing fraction, Φ ≈ 0.55, and at these high dispersed fractions, it is difficult to retain fluid properties of the continuous phase.Reference Song, Wang and Makse32 It is possible to increase the maximum packing fraction to Φ ≈ 0.7 by using a polydisperse set of solid particles; however, fluid flow will still not be maintained.Reference Luckham and Ukeje41 By contrast, liquid/liquid dispersions, or emulsions, can be made with internal phase concentrations (concentration of dispersed immiscible liquid) ≥90%.Reference Sharu, Simon, Cheng, Zank and Bhattacharyya42,Reference Masalova and Malkin43 At such high concentrations, the dispersed liquid droplets must take on more of a polyhedral shape rather than spheres, but the overall system remains fluid. One potential benefit of using the liquid metal galinstan rather than solid conductive particles as the dispersed phase is to maintain a low viscosity that is possible with fluidsReference Huang, Liu, Mokasdar and Hou44,Reference Wang, Jiang, Zhou, Gou and Hui45 while achieving high metal loading and thus high permittivity. Rheological measurements of metal dispersions in an uncured polymer matrix that have demonstrated this benefit have not been previously recorded as a function of concentration and, particularly, not at concentrations exceeding the maximum packing fraction of solid, spherical particles.
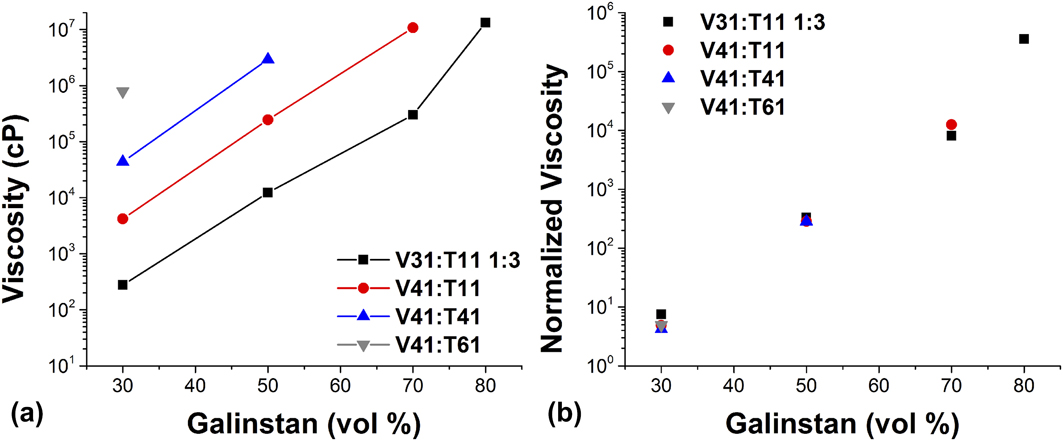
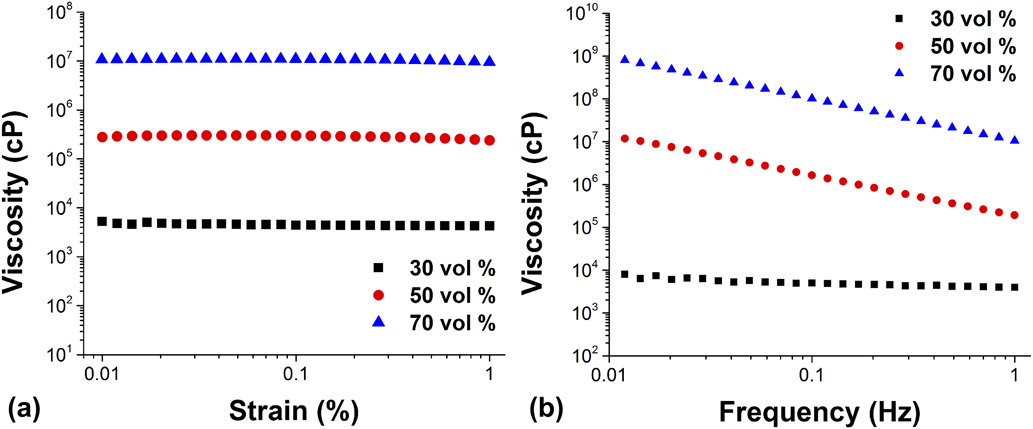
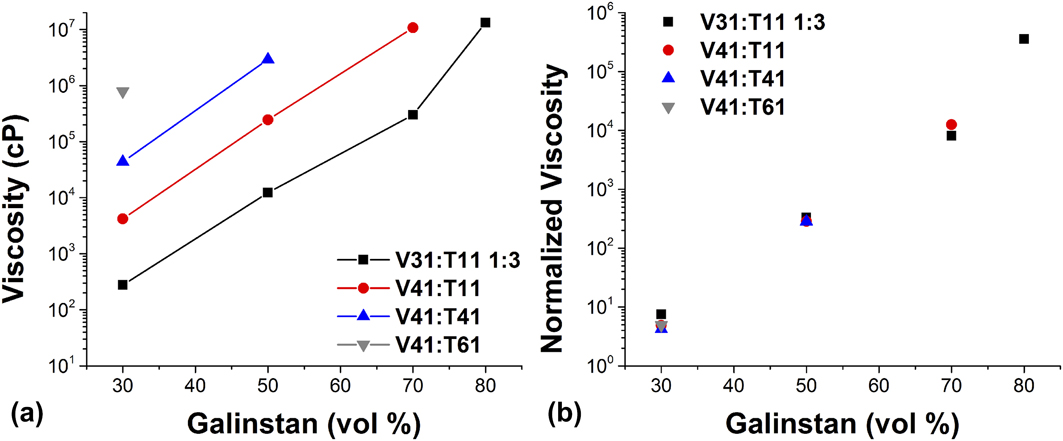
Figure 1 shows the viscosity of galinstan in PDMS dispersions as a function of galinstan loading for PDMS with four different viscosities. Viscosity values are only shown for those dispersions where PDMS remained the continuous phase. As is expected, at any given metal loading dispersions composed of a more viscous PDMS exhibit a correspondingly more viscous dispersion. When normalized to the constituent PDMS viscosity, however, the four curves collapse to a single master curve [Fig. 1(b)]. This indicates that dispersion viscosity is not dependent on particle size or polydispersity, discussed in Sec. III.D, as liquid metal particles at the highest viscosity PDMS are at least two orders of magnitude smaller and less polydisperse than those formed with the lowest viscosity PDMS. Dispersion viscosity is, however, clearly dependent on metal loading. For the lowest viscosity PDMS, as metal loading increases from 30 to 80 vol%, the viscosity increases by about five orders of magnitude. This drastic increase in viscosity with loading is seen for each PDMS used within the possible loading range. The dependence of viscosity on particle loading but not on particle size suggests that dispersions of liquid metals in uncured PDMS behave rheologically like dispersions of hard spheres in a fluid (larger than 1 µm and thus not dominated by Brownian motion).Reference Pal9,Reference Mewis and Spaull46 Figure 2 shows the shear rate and strain dependence of dispersions composed of V41:T11 with respect to galinstan loading. As would be expected for a dispersion of hard spheres, Fig. 2 shows an increase in shear dependence with an increase in metal loading.Reference Mewis and Spaull46 This behavior is counter-intuitive as it would be expected that a dispersion of liquid metal would act as a dispersion of one liquid in another. For comparison, the viscosity of mineral oil in PDMS dispersions shows no change in shear dependence with an increase in loading (Supplementary Material).
(a) Viscosity of uncured galinstan-in-PDMS dispersions with respect to loading composed of four different PDMS viscosities. (b) Dispersion viscosity data normalized to continuous phase viscosity. Data taken at 0.1% strain, 1 Hz.
Viscosity of uncured galinstan-in-PDMS dispersions composed of V41:T11 PDMS in the (a) strain domain (at 1 Hz) and (b) frequency domain (at 0.1% strain).
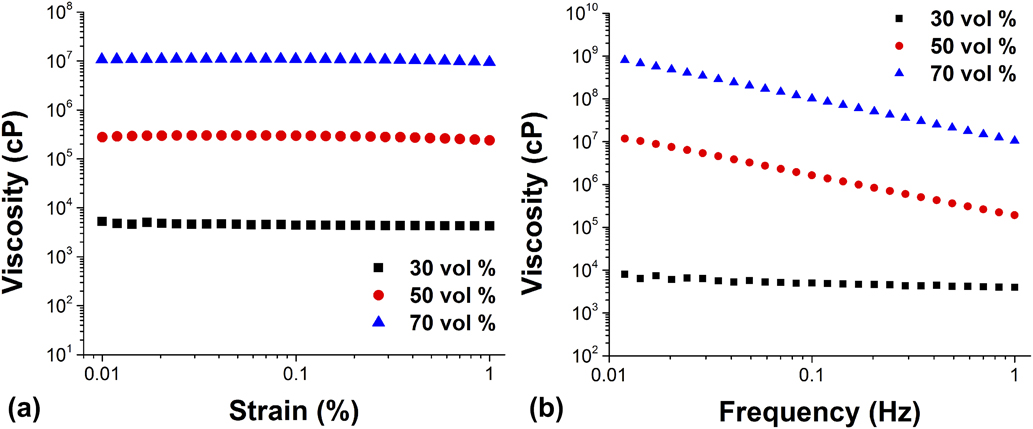
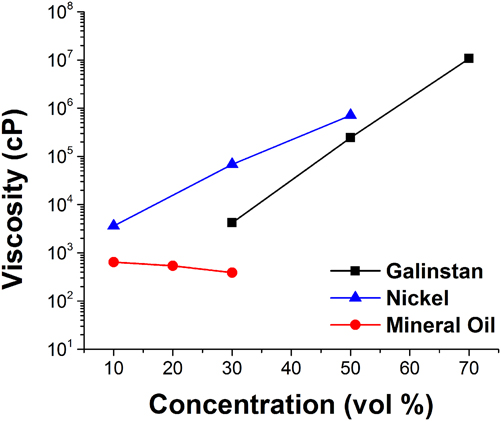
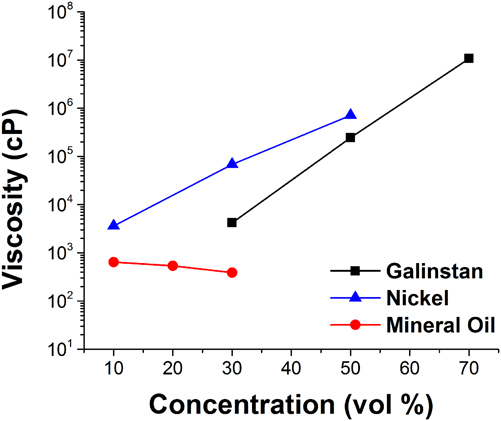
Figure 3 shows the viscosity of dispersions of galinstan, conductive Ni particles, and mineral oil in V41:T11 PDMS with respect to loading. It can be seen that galinstan dispersion viscosity actually increases with increasing concentration similar to the rigid Ni particles. By contrast, dispersions of mineral oil generally obey the rule of mixtures  $\left( {\eta _{{\rm{mineral}}\;{\rm{oil}}}^ * = 33\;{\rm{cP}}} \right)$ resulting in a decreasing viscosity as the concentration increases. However, while galinstan rheologically acts similar to hard spheres when dispersed, it still allows for metal loadings higher than the maximum random packing fraction of monodisperse spheres while exhibiting fluid flow. Galinstan’s similar behavior to rigid particles may be due to the presence of the spontaneously forming oxide shell around each droplet. In order for the droplets to flow like liquids in a liquid matrix, they need to deform significantly, particularly at higher loadings. From our previously published work,Reference Koh, Mrozek and Slipher27 we measured that the modulus of the interface was 10,000× greater with an oxide shell than without. When in a matrix of significantly lower modulus (the highest effective modulus PDMS used in this study had G′ ∼ 160 Pa), it is likely that the rigid oxide shell dominates the droplet flow, thus resulting in hard sphere-like flow behavior in the shear domains studied.
Viscosity of uncured galinstan, nickel, and mineral oil dispersed in V411:T11 PDMS with respect to loading.
B. Cured dispersion rheology
While liquid metal dispersions in uncured PDMS enable us to understand the deformation of galinstan droplets in a low modulus continuous phase, the final stretchable electronic devices will be based on cured PDMS matrices. The rheology of polymer systems with hard sphere fillers has been extensively studied and modeled since the first Einstein equation:
 $${\eta _{\rm{r}}} = {\eta _{\rm{m}}}\left( {1 + 2.5\varphi } \right)\quad ,$$
where ηr is the reduced viscosity, ηm is the matrix viscosity, and φ is the volumetric filler concentration.Reference Guth47 This basic relationship has since been expanded to the dispersion modulus and modified to include terms that describe nondilute systems, interparticle interaction, and nonspherical shapes among other factors.Reference Fu, Feng, Lauke and Mai48 In general, it is expected that the modulus of a filled polymer system increases with solid filler concentration until it reaches the maximum packing fraction above which a continuous material will not be produced (i.e., there will not be enough polymer to fill the spaces between particles resulting in air void incorporation). At these high concentrations, the material is generally no longer soft or stretchable. This is why stretchable devices with hard fillers such as metal particles, carbon nanotubes/nanofibers, and conductive polymer particles are commonly utilized at the lowest possible concentration that provides the desired electrical response.Reference Dickey18 Low concentrations of filler, however, lead to low permittivity values. A filled polymer that is able to remain stretchable at the high filler concentrations that are required for high permittivity is highly desirable.
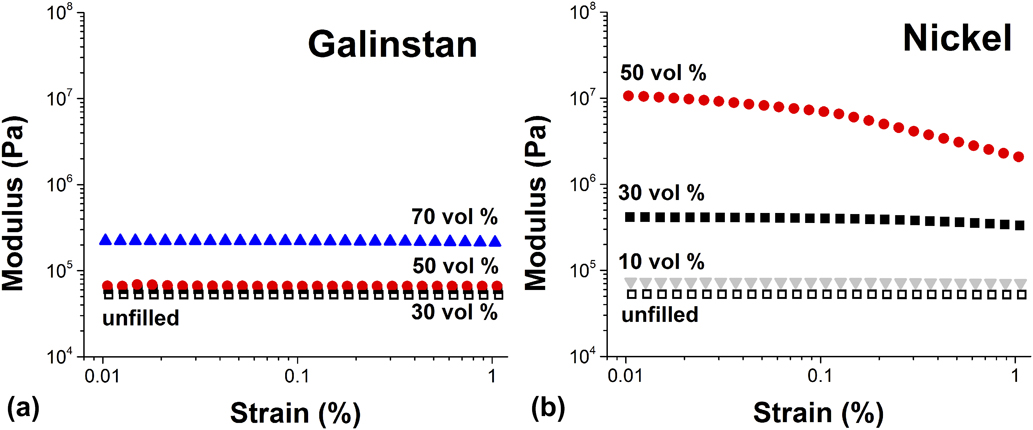
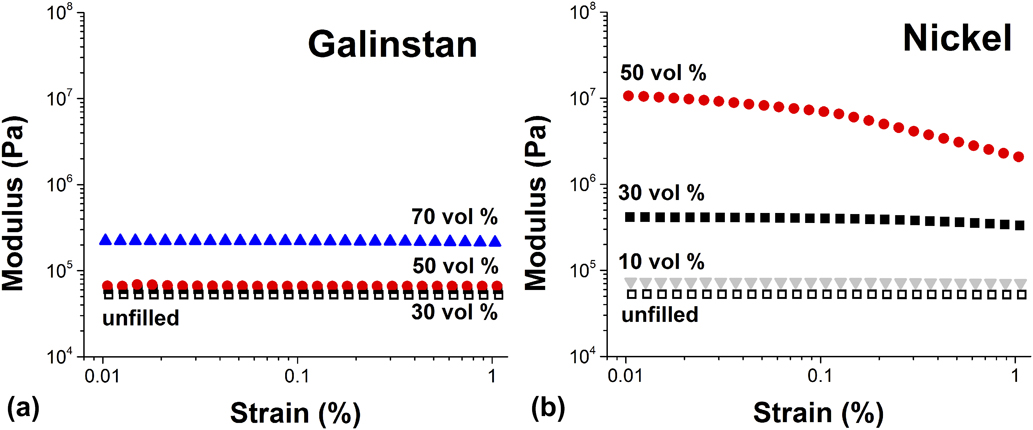
The storage modulus of cured PDMS (V41:T11) filled with 0, 30, 50, and 70 vol% galinstan at 25 °C is shown in Fig. 4(a) (loss modulus data provided in the Supplementary Material). At 50 vol%, there is a less than 50% increase in the storage modulus as compared to the unfilled cured PDMS. At 70 vol%, this increases to a 4× increase in storage modulus over the unfilled cured PDMS. The trends observed in three galinstan dispersions were similar to the unfilled PDMS in both the strain and frequency range tested. These data were compared to dispersions of 10, 30, and 50 vol% of Ni to compare the influence of a more traditional rigid particulate filler in the same matrix [Fig. 4(b), loss modulus data provided in the Supplementary Material]. It is important to note that 70 vol% dispersions of Ni were not possible due to the spherical particle maximum packing fraction demonstrating a significant advantage of a liquid metal filler. It is also clear that Ni particles have a significantly larger impact on the modulus of the filled PDMS than galinstan. At 30 vol% Ni, the storage modulus has increased 7× compared to unfilled PDMS. At 50 vol%, the storage modulus of the Ni dispersions increased to roughly 100 times that of unfilled PDMS. These values indicate a significant increase in the stiffness of the material as compared to the compliant nature of PDMS. There is also a shift to shear thinning behavior at strains above 0.1% for the 50 vol% Ni in PDMS which is not observed in the unfilled cured PDMS or any of the cured galinstan dispersions. These data support using galinstan to produce materials with high metal loadings, higher than those possible with a solid filler, while minimizing the mechanical changes of the host PDMS.
Strain-dependent storage modulus obtained at 1 Hz for various concentrations of (a) galinstan and (b) nickel particles dispersed in V41:T11 PDMS. Frequency-dependent storage modulus and complete loss modulus data are available in the Supplementary Material.
Dispersions of galinstan in PDMS have been previously investigated by Bartlett et al.Reference Bartlett, Fassler, Kazem, Markvicka, Mandal and Majidi17 and Jeong et al.Reference Jeong, Chen, Huo, Gamstedt, Liu, Zhang, Zhang, Hjort and Wu39 The rheological trends seen in both of these studies agree with those shown here where dispersions of galinstan cause an increase in modulus with loading. Bartlett found that their dispersions of galinstan could be modeled using the surface tension-generalized Eshelby theory, which treats galinstan as a soft inclusion rather than either a liquid or a solid if the modulus of galinstan was taken as 320 kPa. This is significantly higher than the modulus we have measured for galinstan of ∼3 kPa (rheology included in the Supplementary Material). This modulus, when included as  $G_i^\prime$ (modulus of inclusion) in Eq. (2),Reference Style, Boltyanskiy, Allen, Jensen, Foote, Wettlaufer and Dufresne49 describes liquid-like behavior. At a galinstan modulus of 80 kPa, Eshelby’s model matches the 30 and 50 vol% data well but still greatly underestimates the modulus at 70 vol%. This is likely due to the increase in oxide presence in the dispersion as the particle sizes decrease and thus particle surface area increases as well as inhomogeneity in the particle size and increasing interaction between particles both factors effectively increasing the modulus. The disparity between established soft inclusion models and the galinstan dispersions, particularly at high loadings where permittivity is expected to be the highest, further highlights how important it is to understand the galinstan interface both in terms of physical properties as well as physiochemical interactions. This further supports the importance of understanding the nature of the oxide shell in the characterization and usage of galinstan in an uncured matrix described previously.
 $$G'\;{\rm{composite}} = G_{{\rm{matrix}}}^\prime {{1 + {2 \over 3}{{G_i^\prime } \over {G'}}} \over {\left( {{2 \over 3} - {5 \over 3}\varphi } \right){{G_i^\prime } \over {G'}} + \left( {1 + {5 \over 3}\varphi } \right)}}\quad .$$
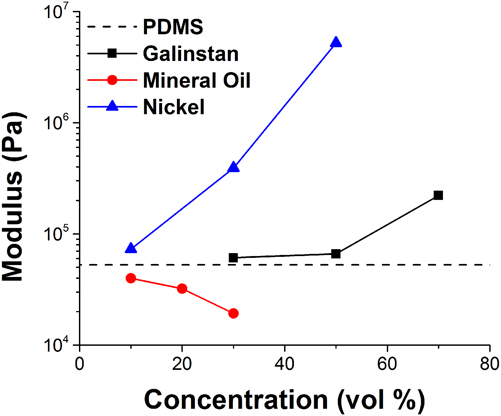
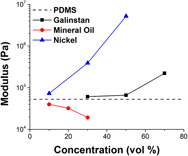
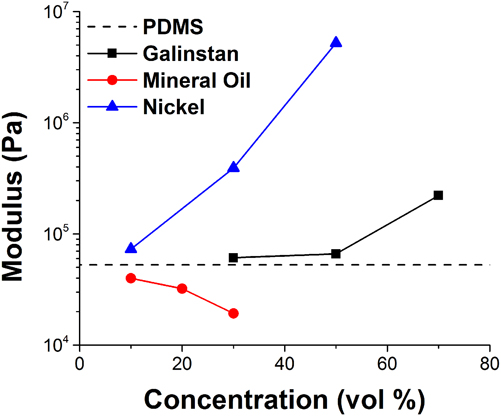
It is instructive, then, to understand how closely the galinstan behavior mirrors a liquid filler while dispersed in a high modulus (cured) matrix. This is particularly interesting because the galinstan flow behavior appeared more like that of a solid filler in the uncured (fluid-like) dispersion. Figure 5 shows the storage modulus trends with respect to loading of galinstan, Ni particles, and mineral oil in V41:T11 PDMS. As can be seen from Fig. 4, the dispersions of galinstan and Ni show an increase in modulus as loading increases but the influence of the Ni particles is significantly greater than the galinstan. Mineral oil, a liquid filler without a rigid shell, shows a decrease in storage modulus with respect to loading. This is what would be expected from a low modulus liquid ( $G_{{\rm{MO}}}^\prime \sim 2\;{\rm{Pa}}$, full dispersion rheology included in the Supplementary Material) embedded in a high modulus matrix according to Eshelby’s theory for soft inclusions.Reference Style, Boltyanskiy, Allen, Jensen, Foote, Wettlaufer and Dufresne49 This is also clearly not the same behavior as the dispersions of galinstan. This supports why the galinstan, a liquid filler encapsulated in a solid oxide shell, shows rheological behavior in between that of a completely solid filler, like nickel, and that of a completely liquid filler, like mineral oil.
Storage modulus of galinstan, nickel, and mineral oil dispersed in cured V41:T11 PDMS with respect to loading. Modulus of cured, unfilled PDMS included for reference. Data taken at 0.1% strain, 1 Hz.
C. Dispersion electrical interrogation
There are three factors that influence the final capacitance of a planar capacitor whose capacitance is given by the following equation:
 $$C = \varepsilon \times {A / t}\quad ,$$
given the device area (A), the dielectric thickness (t), and the permittivity of the dielectric layer (ε). As the former two factors are geometric properties of the device itself, the best way to improve the capacitor material is to improve the permittivity of the dielectric. One method to improve material permittivity is to use highly conductive fillers which can be polarized under an electric field.Reference Dang, Yuan, Zha, Zhou, Li and Hu50 These fillers are typically hard materials such as metals and ceramics and, as previously mentioned, are not optimal at high concentrations for maintaining the desired mechanical performance of the host polymer.Reference Park, Park and Jeong4 Dispersions of galinstan (σ = 3.8 × 10⁶ S/mReference Liu, Katehi and Peroulis51) may be able to overcome the deficiencies of hard filler dielectrics while maintaining high permittivity.
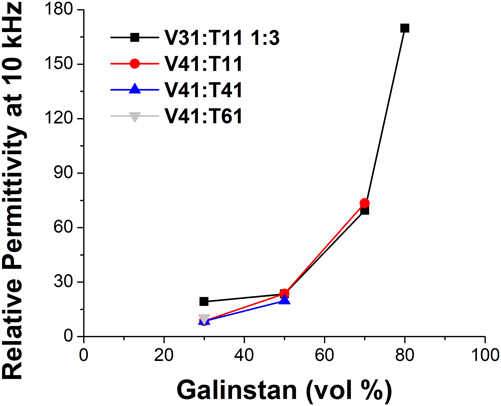
Figure 6 shows the relative permittivity of the dispersions of galinstan in uncured PDMS for loadings up to 80 vol%. The constituent PDMS viscosity had no obvious effect on the dispersion permittivity, which is reasonable since particle size is not expected to have a significant impact on permittivity and all the PDMS formulations had the same permittivity. It is possible that with continually decreasing particle sizes that the overall concentration of oxide as opposed to conductive metal may change this trend, but particles in the dispersions made in this study were not small enough to see any difference. Permittivity values measured up to 50 vol% agree with those measured by Bartlett et al.Reference Bartlett, Fassler, Kazem, Markvicka, Mandal and Majidi17 further emphasizing that particle size and shape are not important factors to material permittivity at off-resonant frequencies. However, permittivity values higher than those previously recorded with galinstan were measured at 70 and 80 vol% where the permittivity was 70 and 170, respectively. These are values similar to those achieved with some metal oxides while being able to remain soft and stretchable.Reference John52 At each metal loading measured, the material viscosity and modulus can be independently tailored based on the constituent PDMS used while achieving the desired permittivity. This level of processing and formulation control will be invaluable for future stretchable dielectric manufacturing.
Relative permittivity of uncured galinstan-in-PDMS dispersions with respect to loading with different PDMS viscosities.
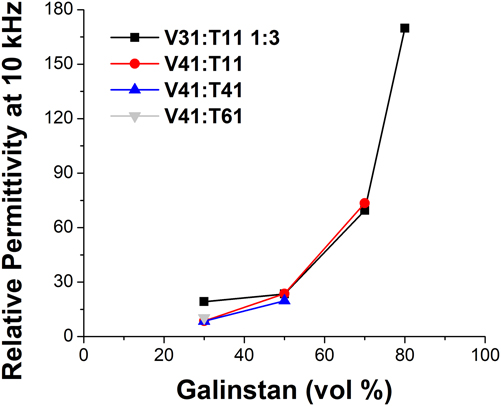
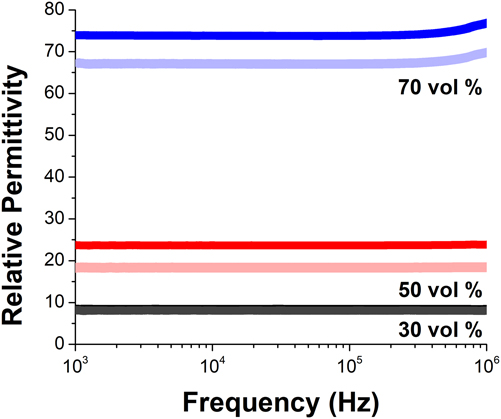
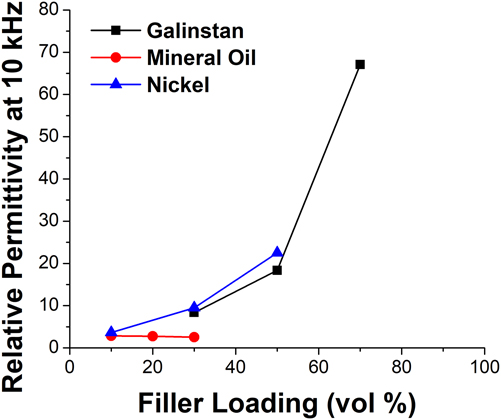
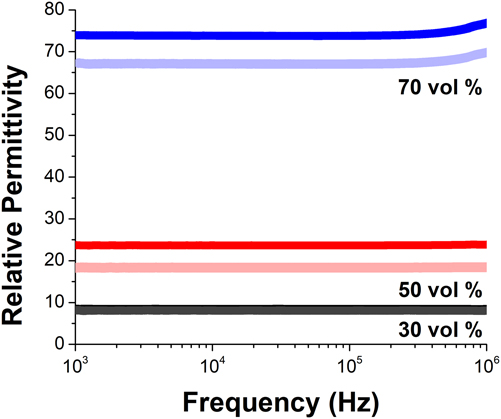
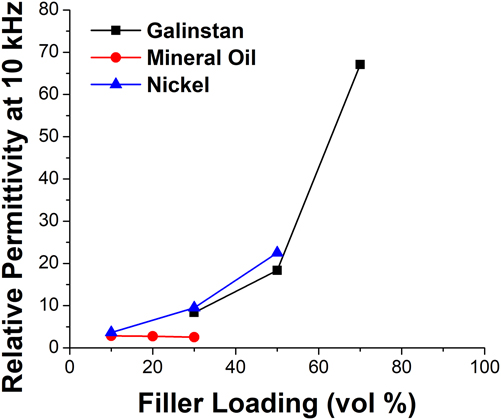
Figure 7 shows the permittivity of cured and uncured galinstan in PDMS dispersions using V41:T11 PDMS across frequencies up to 1 MHz. In this range, 30 and 50 vol% dispersions remain frequency-independent while 70 vol% shows a slight increase in permittivity at high frequencies. Interestingly, a decrease in permittivity was measured for 50 and 70 vol% after curing. The catalyst used for these experiments was platinum-based, so the platinum may have interacted with the liquid metal to decrease permittivity. This suggests that looking at other catalyst systems will be important for the future use of galinstan-dispersion dielectrics. Figure 8 shows the permittivity of galinstan, Ni, and mineral oil cured dispersions at 10 kHz. Ni dispersions, which show no difference in performance before and after curing, show similar permittivity values to the uncured galinstan dispersions. This would be expected as Ni shows similar conductivityReference Farrell and Greig53 to galinstan and permittivity is expected to be largely dependent on loading. Mineral oil dispersions show much lower permittivity as mineral oil is nonconductive.
Relative permittivity of uncured and cured galinstan-in-PDMS dispersions using V41:T11 PDMS in the frequency domain with different PDMS viscosities. Lighter colors indicate cured samples while darker colors indicate uncured samples.
Relative permittivity of cured galinstan, nickel, and mineral oil-in-PDMS dispersions with respect to loading. Nickel and mineral dispersions show little change in permittivity before and after cure.
D. Dispersion morphology and phase inversion
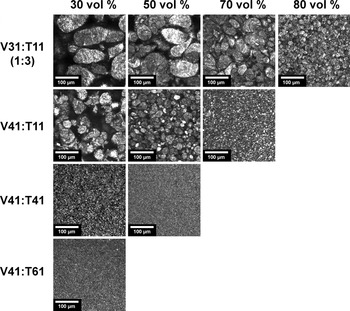
The formation of liquid–liquid dispersions has been well-studied for many systems particularly with respect to the resulting dispersed phase morphology and droplet size. During mixing, the dispersed phase is broken up into large droplets and subsequently refined over time into smaller sizes dependent on the mixing method and power.Reference Sharu, Simon, Cheng, Zank and Bhattacharyya42 It is generally well-understood that droplets will continue to get smaller until some minima is reached dependent on mixing power and interfacial tension. Galinstan-in-PDMS dispersions were all mixed for the same amount of time, so power input to each was the same. After two hours of mixing, no phase separation or particle aggregation was observed for any dispersion, likely due to the presence of the thin oxide shell. Particle settling was observed for 30 vol% dispersions, due to the phase density mismatch. Dispersion morphology/size is also dependent on phase concentration and viscosity ratio. In the galinstan-in-PDMS dispersions made, only the PDMS viscosity was changed (3 × 10² cP at the low end to 2 × 10⁵ cP at the high end). It is expected that at a constant dispersed phase volume (e.g., galinstan), droplet sizes will decrease with increasing continuous phase (e.g., PDMS) viscosity.Reference Qian and McClements54 It is clear from images in Fig. 9 that galinstan-in-PDMS dispersions adhere to this trend. Droplet sizes also decrease with increased galinstan concentration, which is opposite of the expected trends from the literature where droplet sizes typically increase with increased disperse phase concentration.Reference Abismaïl, Canselier, Wilhelm, Delmas and Gourdon55,Reference Floury, Desrumaux and Lardières56 We hypothesize that this is the result of drastically increased emulsion viscosity as galinstan concentration increases, thus impacting droplet size in a similar manner to increased continuous phase viscosity. Additionally, it can be seen from Fig. 9 that lower PDMS viscosity dispersions show significantly more elongated droplets than those with higher viscosity. It is thus evident that droplet size and morphology can be controlled through the choice of PDMS, and thus continuous phase viscosity, in addition to the metal loading.
Confocal microscopy images of galinstan-in-PDMS dispersions.

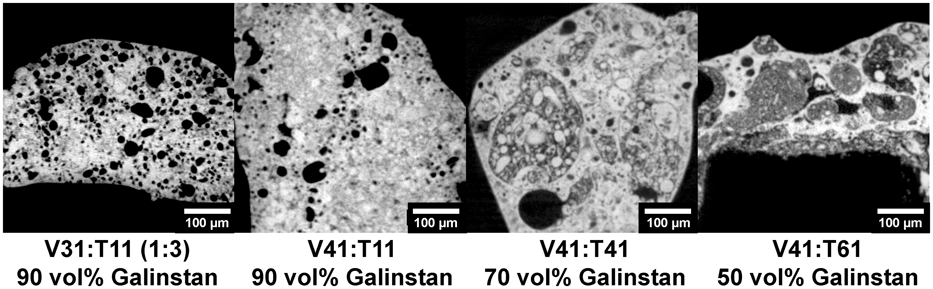
While the discussion up to this point has been concerned with the dispersion characteristics of galinstan-in-PDMS, we also demonstrate an inverted phase emulsion of PDMS-in-galinstan. This is a dispersion where the galinstan became the continuous phase with PDMS as the dispersed phase. Phase inversion is not a novel phenomenon in the oil/water emulsion literature, generally being dependent on factors such as phase concentration, surfactant structure, and temperature.Reference Fernandez, André, Rieger and Kühnle57 However, phase inversion of galinstan (or any liquid metal) dispersions have, to our knowledge, never been presented before. Figure 10 highlights a phase inverted system, PDMS in galinstan, for each PDMS continuous phase viscosity studied at the lowest galinstan concentration consistently obtained. These dispersions, similar to dispersions of nickel in galinstan studied by Daalkhaijav et al.,Reference Daalkhaijav, Yirmibesoglu, Walker and Mengüç58 showed higher viscosity and modulus than that of pure galinstan while remaining conductive. Representative rheology and electrical characterization of the phase inverted systems can be found in the Supplementary Material. These new phase inverted systems have the potential to improve liquid metal printing and device fabrication as the high viscosity allows for precision conductive trace drawing as well as easier microchannel filling in addition to the relative decrease in viscosity as compared to galinstan. It was beyond to scope of the current study to measure the exact phase inversion concentration. However, even as an approximation, it is clear that by changing the PDMS continuous phase viscosity, there is a large change in the galinstan concentration necessary for phase inversion from between 30 and 50 vol% for the highest viscosity PDMS to >80 vol% for the lowest viscosity PDMS.
X-ray CT scan images of PDMS-in-galinstan dispersions.

Phase inversion concentration is generally related to the relative rheological properties of the two mixed phases, primarily storage modulus or viscosity. Predicting the concentration at which phase inversion occurs allows the experimenter to choose, through formulation, the properties of the resulting dispersion. This prediction can be done through the use of Eq. (4) if component rheology and z, an empirical fitting parameter, has been previously determined.
 $${\Phi _{{\rm{2I}}}} = {1 \over {p_{{\rm{eff}}}^{{1 / z}} + 1}}\quad ,$$
where Φ2I is the volume fraction of phase 2 at inversion and p eff is η1/η2 or  ${{G_1^\prime } / {G_2^\prime }}$.Reference Steinmann, Gronski and Friedrich59 Phase 2 can be defined arbitrarily and has been defined in this work as the galinstan. Using either modulus or viscosity data, Eq. (4) gives a z-value around 3 for galinstan/PDMS dispersions, which fits in with the z-values expected from filled blends based on the work of Steinmann et al.Reference Steinmann, Gronski and Friedrich60 With more extensive phase inversion work, this prediction may enable formulators to choose PDMS-continuous or galinstan–continuous blends at a wide variety of phase concentrations and resulting electrical/material properties.
IV. CONCLUSIONS
Galinstan dispersed in a PDMS matrix influenced the viscosity similar to a typical rigid filler in the molten, or uncured state; however, galinstan composites exhibited a reduced influence on the modulus and enabled higher filler loadings (up to 80 vol%) in the cured state relative to a rigid filler. The observed behavior was attributed to the presence of a thin oxide shell on the galinstan. The galinstan droplet size was shown to decrease with increasing PDMS viscosity, consistent with the emulsion literature. However, the droplet size also decreased with increasing metal loading, contrary to the emulsion literature, demonstrating the importance of understanding the overall dispersion viscosity and the influence of the oxide shell. The ability to treat a conductive filler composite as an emulsion enabled the first ever demonstration of phase-inverted, PDMS-in-galinstan dispersions that are conductive and exhibit increased viscosity over pure galinstan. Collectively, this work demonstrates that a single set of constituents can be used to make both energy dissipative (conductive with finite resistance) and energy storage (capacitive with relative permittivity value up to 170) materials by controlling the formulation. It is anticipated that this understanding will facilitate broader implementation of liquid metal composites into stretchable electronic device applications. Future work will focus on understanding the long-term stability of galinstan dispersions and the impact of long-term stability on device performance.
Supplementary Material
To view supplementary material for this article, please visit https://doi.org/10.1557/jmr.2018.209.