I. INTRODUCTION
Chlorite is a common mineral in hydrothermal ore deposits, metamorphic rocks, and retrograde reaction products of igneous rocks (Veblen and Ferry, Reference Veblen and Ferry1983; Bowman et al., Reference Bowman, Perry, Kropp and Kruer1987; Chernosky et al., Reference Chernosky, Berman, Bryndzia and Bailey1988; Laird, Reference Laird and Bailey1988; Xu et al., Reference Xu, Luo and Hu1990; Xu and Veblen, Reference Xu and Veblen1993; Jacquat et al., Reference Jacquat, Voegelin, Villard, Marcus and Kretzchmar2008). Mg and Fe are common elements in trioctahedral chlorite in addition to Si, Al, H, and O (Dunn et al., Reference Dunn, Peacor, Ramik, Su and Rouse1987; Bailey, Reference Bailey1988). However, the elements Mn, Ni, Co, Zn, and Cu are considered as trace elements in chlorite, because they commonly occur in chlorite with very low concentration (Bailey, Reference Bailey1988; Veblen, Reference Veblen and Buseck1992). Unusually, high-concentrated Zn-bearing chlorite (ZnO 28–30 wt%), baileychlore was reported from drill hole at Red Dome mine, located near Chillagoe, Australia (Rule and Radke, Reference Rule and Radke1988). The Zn-chlorite occurs as replacements of altered andesite and skarn clasts (Smith, Reference Smith1985; Torrey et al., Reference Torrey, Karjalainen, Joyce, Erceg and Stevens1986). In this paper, we used X-ray diffraction (XRD), transmission electron microscopy (TEM), and X-ray energy-dispersive spectroscopy (EDS) spectra to better understand the crystal structures and interstratification of baileychlore.
II. SAMPLE AND EXPERIMENTAL METHODS
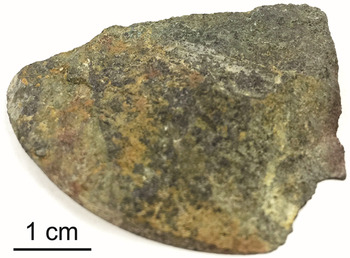
We studied baileychlore samples from a drill hole at Red Dome deposit (Rule and Radke, Reference Rule and Radke1988). The baileychlore in the specimen shows dark green color, which is associated with yellow or brown montmorillonite locally (Figure 1). We picked a dark green grain for powder XRD and TEM analysis. XRD data were collected on a two-dimensional (2D) image-plate detector using a Rigaku Rapid II instrument (MoKα radiation) in the Geoscience Department. The 2D images were converted to produce conventional 2θ vs. intensity patterns using Rigaku's 2DP software. The detailed crystal structure of baileychlore was calculated using the Rietveld refinement method with TOPAS 5 software. A pseudo-Voigt function was used for fitting the peak profiles. TEM samples were prepared by coating distilled water suspensions of crushed baileychlore onto carbon-coated 200-mesh Cu grids. TEM images and selected-area electron diffraction (SAED) analyses were carried out using a Philips CM200-UT microscope operated at 200 kV in the Materials Science Center at the University of Wisconsin – Madison. The chemical composition was analyzed by TEM–EDS spectra using a Si:Li detector (Oxford instruments Link ISIS) with a beam diameter of ~50 nm (spot size 5).
(Colour online) Hand specimen of baileychlore. Dark green part is baileychlore; yellow and brownish parts are montmorillonite.

III. RESULTS AND DISCUSSION
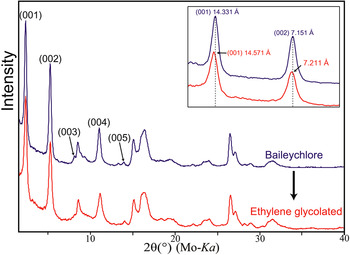
The powder XRD pattern of baileychlore indicates poor crystallinity, with broad 02l and 11l peaks (Figure 2). The shapes of the peaks (streaking toward high angle) at d = 4.6 and ~2.6 Å are suggestive of stacking disorder in adjacent layers (Figure 2). The broad peak at ~2.6 Å is related to the streaking of 20l and 13l reflections resulting from stacking of TOT layers because of opposite octahedral orientations (Xu and Veblen, Reference Xu and Veblen1993). The d-values for the (001) and (002) peaks slightly increased after being ethylene glycolated (Figure 2), which confirms the presence of interstratified smectite layers. Chlorite is a 2:1:1 phyllosilicate that cannot be collapsed or expanded by normal laboratory procedures (Bailey and Brown, Reference Bailey and Brown1962; Bayliss, Reference Bayliss1975). The 7.211 Å of the (002) peak of treated baileychlore indicates the presence of ~10% of randomly interstratified smectite mixed layers in chlorite layers (Reynolds, Reference Reynolds and Bailey1988; Shau et al., Reference Shau, Peacor and Essene1990). Previous differential thermal and thermogravimetric analyses of baileychlore also support the smectite layers within baileychlore, indicated by a loss of water at 120–200 °C (Olives, Reference Olives1985; Rule and Radke, Reference Rule and Radke1988).
(Colour online) XRD patterns of baileychlore (blue) and that of ethylene glycolated sample (red).

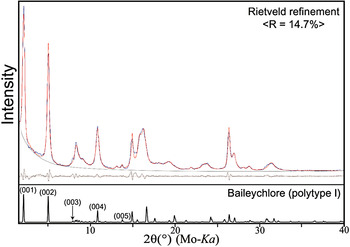
Rietveld refinement analyses were performed to calculate the structural parameters of baileychlore based on space group of C
 $ \bar 1$
with two polytype structures (Figures 3 and 4). For the refinement, we used the previously reported chemical formula of baileychlore (Zn2.50Fe2+
1.20 Al1.17Mg0.76Mn2+
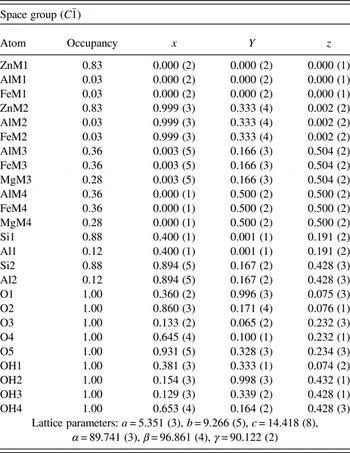
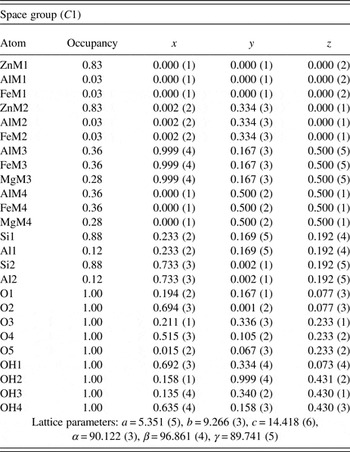
0.01□0.36)[Si3.55Al0.45]O10(OH)8, analyzed by using electron microprobe (Rule and Radke, Reference Rule and Radke1988). Fractional coordinates and occupancies for the structure of baileychlore polytypes I and II are listed in Tables I and II, respectively. We repeatedly refined each atom coordinates and checked the values from staring structures to avoid errors from highly correlated variables after unit-cell parameter refinement. Rule and Radke (Reference Rule and Radke1988) used Ib symmetry for least-squares refinement; however, triclinic C
 $ \bar 1$
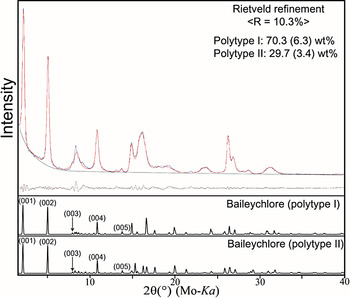
is the more reasonable symmetry because of the semi-random stacking. The calculated unit cell parameters of baileychlore are: a = 5.351(3), b = 9.266(5), c = 14.418(8) Å, α = 89.741(3)°, β = 96.741(4)°, and γ = 90.122(2)°. The calculated density of baileychlore is 3.183 g cm−3, which is analogous to the measured density 3.18(2) g cm−3. The final fitting result of two polytype structures (Figure 4) indicates the presence of domains of type I and II chlorite, which can be considered as an approximation for the partially disordered chlorite. The type II polytype is the stable structure in high-temperature metamorphic rocks (Walker, Reference Walker1993).
(Colour online) Rietveld refinement of XRD pattern of baileychlore using type I polytype. The residual between measured and calculated patterns is illustrated at the upper-right corner of the XRD pattern.

(Colour online) Rietveld refinement of XRD pattern of baileychlore with intergrowths of type I and II domains. The residual between measured and calculated patterns is illustrated at the upper-right corner of the XRD pattern.

Atomic coordinates of baileychlore: type I polytype.

Atomic coordinates of baileychlore: type II polytype.

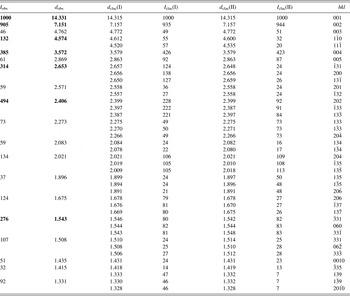
Powder X-ray data for baileychlore with type I and II polytypes.

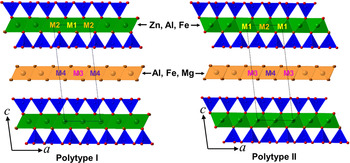
Reitveld refinement provides a composition of (Zn2.49Al0.09Fe2+ 0.09□0.33)0.61− for the octahedral sheet, (Si3.53Al0.47)0.47− for the tetrahedral sheets within the 2:1 layer, and (Al1.08Fe1.08Mg0.84)1.08+ for the interlayer brucite layer. The structural formula suggests the total net negative charge of TOT layers is −1.08. In addition, zinc prefers to enter the octahedral (M1 and M2) sites in the TOT layers (Figure 5). An electron-density projection study also shows that the zinc is stable in the M1 and M2 sites (Rule and Radke, Reference Rule and Radke1988).
(Colour online) Polyhedral models showing crystal structure of baileychlore polytypes (types I and II).

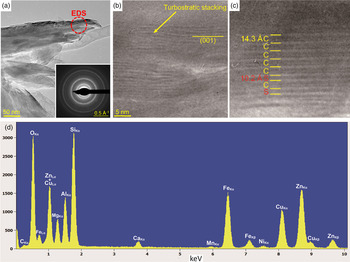
Low-magnification bright-field TEM images and SAED of baileychlore show that it is poorly crystalline [Figure 6(a)]. The small crystal size and highly variable orientation are associated with bending of the crystal (Jiang et al., Reference Jiang, Peacor, Merriman and Roberts1990). The high-resolution TEM (HRTEM) images show only basal (001) lattice fringes [Figures 6(b) and 6(c)]. Figure 6(c) shows the smectite interlayers within baileychlore layers. The ~10 Å thickness of smectite was caused by dehydration in the high-vacuum condition (Lee and Peacor, Reference Lee and Peacor1985). The TEM–EDS spectra show that baileychlore is associated with Zn, Fe, Mg, Ni, and Mn [Figure 6(d)]. The small amount of Ca detected by EDS is not from calcite as in previous report, but from the interstratified smectite layers.
(Colour online) (a) Bright-field TEM image of baileychlore showing the continuous SAED rings, indicating the turbostratic disorder in stacking, (b) HRTEM image showing the turbostratic structure, (c) HRTEM image show smectite “S” layers within baileychlore “C”, and (d) representative X-ray EDS spectra of baileychlore. Cu peaks are from TEM lacey carbon-coated Cu grid that holds the specimen.

SUPPLEMENTARY MATERIAL
The supplementary material for this article can be found at https://doi.org/10.1017/S0885715617000410.
ACKNOWLEDGMENTS
This study was supported by the NASA Astrobiology Institute (N07-5489). The authors thank Audrey C. Rule for preserving the samples in Bailey collection. The authors also acknowledge Bruker AXS Inc. for TOPAS 5 program.