

INTRODUCTION
The Portable Antiquities Scheme (PAS), managed (in England) by the British Museum and (in Wales) by the National Museum Wales, was established in 1997 with the aim of recording archaeological finds made by the public, most found through hobby metal-detecting (that is, outside controlled archaeological survey or excavation).Footnote 1 The data is recorded by locally based archaeologists, known as Finds Liaison Officers (FLOs), interns and volunteers. As of 1 June 2017, when the data for this study was downloaded, 1,184,338 archaeological items within 718,780 finds records had been entered into the PAS database (PASd).Footnote 2 By broad historical period, the medieval (ad 1066–1540) portion of the database is the second largest after the Roman (ad 43–410); the PAS is selective in recording post-medieval finds. Despite important studies elucidating the character of Roman and early medieval (ad 410–1066) finds recorded by the PAS, that have also shed light into patterns that govern the character and organisation of the database as a whole,Footnote 3 this medieval dataset has not previously been comprehensively assessed.
The project ‘Understanding Medieval Commercial Developments through PAS Data’ aimed to characterise the PAS dataset and to test on it a range of analytical digital humanities methods to demonstrate its viability as a powerful and complex source of evidence on medieval material culture. A preliminary survey of the spatial, temporal and object type breakdowns of the medieval material was published near the outset of the project.Footnote 4 Following on from the initial research, this paper now aims to create a deeper understanding of the PAS medieval data, how it informs us of historical activity with a particular focus on local commercial developments, and to explore its spatial relationship with known sites of formal commercial exchange in the Middle Ages: settlements with regular weekly markets. After an introduction to the contents, distribution and biases inherent in the data, the paper seeks to contextualise the finds at the national level among broad patterns of commercial activity and wealth, then to identify relationships between PAS assemblages and commercial centres through ‘object category’ analysis, and finally to examine specific PAS assemblages in their historical landscape context.
English documentary sources dated between the late eleventh and the thirteenth centuries bear witness to the development of a dense national network of hundreds of local market events. While much work has been done on the role of urban centres as catalysts of economic development during the Central Middle Ages, the importance of markets – as well as of informally conducted local tradeFootnote 5 – to individual peasant economies has a somewhat sparser pedigree. Earlier studies of the structure of marketing tended to focus on understanding it at a regional or county scale.Footnote 6 Or, as was argued in an influential article by Richard Britnell, these events could be viewed as serving primarily local needs with limited contribution to the broader currents of trade and commerce.Footnote 7 The participation of peasant households, and their importance to England’s far-flung foreign trade, remained poorly understood until James Masschaele’s work.Footnote 8 Largely basing his thesis on financial sources produced by the royal administration, Masschaele located rural markets within wider urban networks, and demonstrated the rural population’s participation in inter-regional and international trade through these local commercial nodes.Footnote 9 This conceptual shift was followed a few years later by an important digital humanities project carried out by Samantha Letters that, through a careful investigation of documentary and narrative sources, created a Geographic Information System (GIS) database of thousands of medieval market and fair events in England and Wales.Footnote 10 These qualitative and quantitative milestones have now informed a generation of scholarship on medieval economy with further advances made in, for example, situating commercial centres within broader landscapes of national economy through GIS analysis,Footnote 11 as well as tracing their spheres of interaction within the rural hinterlands.Footnote 12
Despite the potential offered by new digital humanities techniques, there has been no substantive attempt to correlate the pattern of market sites with archaeological evidence at a national scale. At the local level, the character and long-term histories of many individual market sites appear impenetrably obscure. This is particularly so for small rural settlements where, though potentially the focus of formal commercial activity for generations, the market may be attested only by a foundation charter and a handful of passing references. In response to these challenges, it is proposed that PAS data offers new and unique opportunities for creating new information at multiple scales of analysis. Its value for studying medieval economic developments lies in its status as possessing a unique combination of material culture complexity, geographical breadth and chronological depth. As will be discussed, on the national level this data – especially when deployed together with other documentary and archaeological datasets – sheds new light on regional differences in commercial development. On a smaller scale, PAS data can produce unprecedented information about small localities. This paper discusses PAS assemblages recovered in the vicinity of three areas dominated by market sites, demonstrating different recovery biases (often specific to the locale) that must be borne in mind when analysing the finds, showcasing approaches applied to the data, and discussing how the finds enrich knowledge of these settlements’ complex histories. Evidence shows that, though there are differences in urban and rural artefact assemblages, the medieval population at large had access to a wide and sophisticated variety of metalwork objects. This supports a picture of close interactions and exchanges between the rural peasant population and commercial centres that has emerged over the preceding two decades.
UNDERSTANDING THE PAS DATASET
The division of PAS finds into ‘object types’, following the FISH (Forum on Information Standards in Heritage) ‘archaeological objects thesaurus’,Footnote 13 provides a way in which researchers can best understand the nature of the material culture recorded. This shows 1,266 different object types in the PASd, demonstrating the rich variety of material culture that is the substantial strength of the dataset. In terms of absolute numbers of finds, however, a relatively small selection dominates. This structural character of the data is present across all chronological periods and is well illustrated by the composition of the medieval dataset. Altogether, the assessed data contained 220,364 medieval objects in 185,290 records, divided among 612 object types. Of these, only seventy-four types had more than 100 finds.
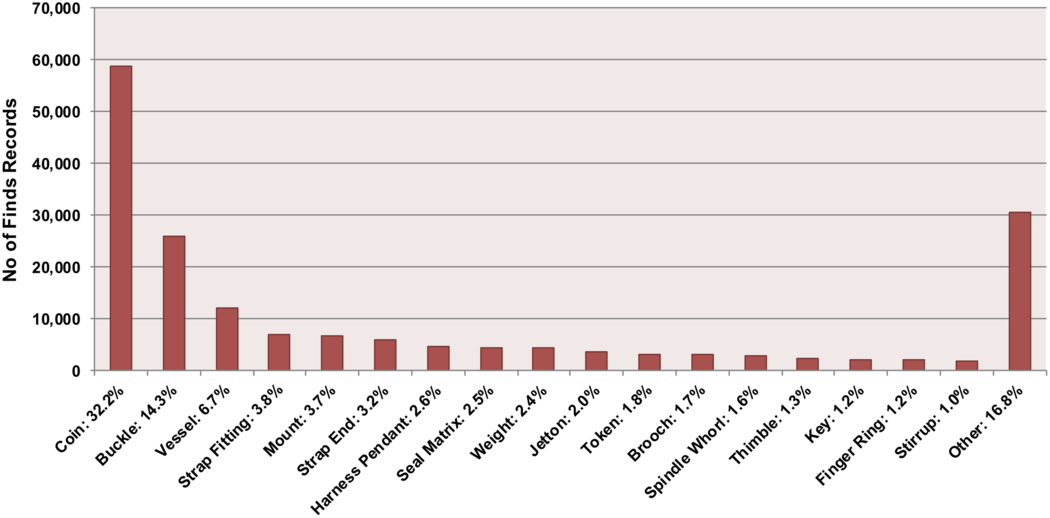
Coins are the single largest category by far (fig 1), representing a third of the PAS medieval dataset. The prevalence of numismatic items no doubt reflects the importance of coin use in the Middle Ages and the ease by which coins can be identified by detectorists as items of archaeological (and undoubtedly monetary) value. A further sixteen object types each contribute more than 1 per cent towards the total, together accounting for 83.6 per cent of all medieval finds. Various depositional, recovery and recording biases that account for the composition of the PASd have been examined by previous studies. Most obviously these finds are overwhelmingly composed of non-ferrous metals – lead, copper alloys and silver being the most common – which generally survive well in the ground. There is a recovery bias against iron objects as most detectorists set their detectors to ignore iron signals to avoid modern metal items, such as farm equipment. A more ambiguous, but no less important factor, is the subjective view of what items finders consider to be important or interesting.Footnote 14 The positive recovery biases affecting coins are likely therefore to contribute to the significant numbers of other numismatica recovered, such as tokens (1.8 per cent) and jettons (2 per cent). Seal matrices (3 per cent) and harness pendants (3 per cent) commonly possess inscriptions and/or pictorial devices identifying their original owners, and therefore are also easily recognised as being of interest. Buckles (15 per cent), finger-rings (1.2 per cent), brooches (2 per cent), strap-ends (3 per cent) and strap-fittings (4 per cent), keys (1.2 per cent) and some mounts (4 per cent) are similarly identifiable as having archaeological value, especially when substantially complete, as are some ornamental or household objects. As a group these items come together to represent typical detector finds. However, in large-scale analysis of multiple finds scatters, this small handful of numerically important object types, combined with the deep object type fragmentation of the rest of the PASd, means that there are real practical challenges in understanding historical deposition patterns based on the recovered items.
Most common (>1 per cent) medieval (1066–1540) object types in the PAS database (objects with findspot data only). Source: PASd.

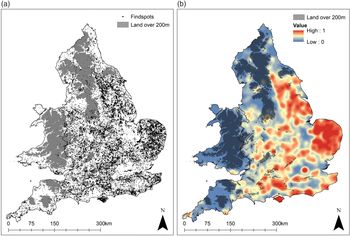
The distribution of these finds is shaped by multiple factors and biases such as topography and the influence of historical geography (fig 2). There is a relative scarcity of finds in regions – such as the Cambridgeshire and Lincolnshire Fenlands, the Weald (of south-east England), the Pennines (dividing the east and west of northern England) and the interior of Wales – that were covered by sparser networks of settlements, in turn reflecting the natural landscape of these places. High finds densities for the medieval period can be associated with regions of known high population density from documentary sources, such as Domesday Book, or from other proxies of human activity, including the distribution of parish churches.Footnote 15
PAS distribution: (a) findspots in England and Wales; (b) kernel density estimate surface showing findspot intensity (bandwidth 5 km). Source: PASd.

Since most finds (92.40 per cent in 2018) were made while using metal-detectors,Footnote 16 detecting practices are of key importance for understanding the PAS finds distribution. In addition to detectorist preferences (for example, of where to search, what to recover, keep and record), spatial constraints powerfully influence the recovery process. Some modern factors are more apparent than others, such as that detecting is impractical in most built-up areas. This manifests both in the impressive lacuna of finds around central London and the intense string through the middle of the modern city representing discoveries made by ‘mudlarks’ (traditionally, people who search the river mud for items of value) and others searching the Thames foreshore. Factors that also guide detecting activity include the availability of the types of terrain and land cover best suited for detecting (normally, cultivated farmland), possible preference to detect near known archaeological sites (including Scheduled Monuments) and how far individual detectorists typically travel for searching (which can be significant in some areas). On the other hand, landowners may restrict this activity on their land. Neither is it permitted on Scheduled Monuments and other protected sites, though the boundaries of these are not always clear on the ground. At a local level, the particular interests of individual detectorists, such as the desire to detect on particular sites of known or suspected historical importance, or which have been previously productive in terms of finds, influence recovery of items. These complex sets of modern factors have a direct relationship with the overall pattern of PAS finds recovery.Footnote 17 It is the unique contribution of metal-detecting to archaeology that most of these finds are from cultivated rural landscapes which were unlikely to be otherwise surveyed or excavated by archaeologists, therefore providing evidence of previously unknown human activity. Most of these finds have been brought to the surface by agriculture, so that their recovery also allows archaeologists to understand sites at risk.Footnote 18
PAS AND THE LANDSCAPE OF MEDIEVAL MARKETS
In order to understand how the finds material reflects historical activity at the national level, the distribution of medieval finds against indicators of commercial activity and wealth has been investigated across the historical landscape of England and Wales as a whole, and within the specific vicinity of commercial centres. This paper attempts to utilise the best qualities of PAS data, which is wide-ranging in terms of being present in the majority of localities in lowland England and Wales, yet patchy and often concentrated on specific fields accessible to detectorists when examined at parish level. Though there is theoretical potential to identify individual marketplaces from local assemblages,Footnote 19 that is not sought here. Rather, the paper examines how the object structure of PAS scatters recovered in the vicinity of medieval commercial centres, as well as settlements in general, can be linked to material culture development and the commercialisation of the medieval society.
The particular focus of this paper lies between the late eleventh and fourteenth centuries, a period that witnessed significant development of the economy.Footnote 20 For individual settlements it resulted in, and was driven by, the flourishing of weekly market events. Many of the most successful and longest-lasting were established in nascent urban centres, but hundreds of markets were founded in the countryside and provided the rural peasantry with crucial access to a growing economy and material wealth. Samantha Letters lists 185 known markets by 1100.Footnote 21 At the eve of the Black Death (1348) the total number of attested or chartered markets had risen to 2,400. By then, the age of market foundations was largely over: only 212 new charters or attestations are recorded between 1349 and 1516.Footnote 22 It should be noted that a large but unspecified number of charter grants of weekly markets was given as tokens of royal patronage. These may have been speculative without a resulting foundation or established for social and political reasons without a significant commercial impact.Footnote 23 A useful comparison is found in the 1690 Index Villaris list of only some 790 market settlements in England and Wales, indicating that a realistic estimate for a pre-industrial network of active markets is unlikely to have greatly exceeded at any one time some thousand events.Footnote 24
A second important economic institution in the Middle Ages was the annual fair, often, if not always, connected to a market franchise. The archaeological imprint of a fair and its impact on the broader material culture of settlements, however, is difficult to determine.Footnote 25 A small handful of great fairs such as those of Boston (Lincolnshire), Bury St Edmunds (Suffolk), St Ives (Cambridgeshire) and Stamford (Lincolnshire) flourished in the late twelfth and thirteenth centuries. These might attract customers from overseas and could run for weeks,Footnote 26 but most fair events lasted for just three days or less.Footnote 27 As a short once-yearly event, a fair’s metalwork signature is likely to be elusive. This is especially so outside the specific boundaries of the fair site itself, which in turn is either rarely known or associated with otherwise archaeologically productive sites such as manors.Footnote 28 This study focuses on settlements with weekly markets as regular events recurring continuously through the year that express a heightened level of commercial activity and formal economic exchange at and near a settlement site.
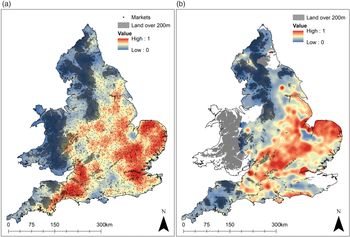
The aggregate patterns of markets can be seen as highlighting, if not the strict reality at a given point in time, then regional potential and interest for commercial exchange (fig 3a). This distribution suggests that many local events were fully connected to wider networks of inter-regional trade. Major concentrations occurred near the intersections of major long-distance transport routes and transhipment points, such as the Thames near London or the junctions of the Icknield Way, Watling Street and the Great North Road in the eastern Midlands.Footnote 29 In various parts of the country, different agricultural and economic regimes prevailed, of course, with an impact on the distribution and character of markets. The Nonae Rolls of 1340−1, a set of tax returns partially based on an assessment of local merchant and market activity, indicate regional variances in the organisation of the smaller non-urban commercial centres. Along with local transport and terrain conditions, the level of diversity in economic production is likely to have been a major contributing factor. This will have influenced production and consumption patterns of peasant households, which were substantially engaged with market activities in towns and villages. Varied terrains and higher degree of agrarian specialisation contributed to marketplace fragmentation in parts of the country, giving rise to larger numbers of individually less important local centres. But in the Midlands a flat landscape and relative uniformity in terms of agricultural production resulted, it has been argued, in a different profile of marketplaces. Here a small number of high-value market towns sufficed to serve as the region’s commercial nexus.Footnote 30
(a) Point density surface of markets attested or chartered by 1334 (bandwidth 20 km). (b) Weighted kernel density surface of movable wealth per tax vill in England assessed in the 1334 lay subsidy, excluding Cheshire, Durham and Kent (bandwidth 5 km). Source: Barry et al Reference Barry, Bartley, Campbell and Glasscockn.d.; Letters Reference Letters2002b. Medieval borders and coastline courtesy of Stuart Brookes.

This data can be compared with other indicators of economic activity. An important source for understanding the distribution of wealth before the Black Death is the 1334 lay subsidy, which assessed tax vills in England by the value of their movable goods (fig 3b).Footnote 31 While the accuracy of the economic landscape the assessment creates should be taken with caution (evasion must be assumed, and it appears to have excluded wool, coin and credit, and therefore downplayed the importance of urban and industrial growth),Footnote 32 the subsidy presents a broadstrokes picture of the disposition of wealth in contemporary rural England.Footnote 33
Figures 3a and 3b contrast a kernel density surface of the distributional intensity of lay subsidy tax vills adjusted by their assessed wealth, and a point density surface based on settlements granted a market charter by 1334.Footnote 34 The kernel density map of tax vills can be thought of as a contoured topography of the regional economy of England, with peaks of relative concentrations of wealth and population (high values in warm colours) and valleys of relative poverty or dispersed settlement patterns (low values in cool colours). By contrast, the point density map can be thought of as a mosaic composed of individual pieces (map cells), where the colour of each relates to the total number of marketplaces laying within a radius of 20 km from it. Consequently, it signals how well each region was situated in relation to multiple, possibly competing, nodes of economic exchange. Combined, this information brings to focus regions of both significant wealth and interest in marketing activity, and highlights the economic predominance of England below an imaginary line from the Severn to the Wash.Footnote 35
COIN FINDS AND ECONOMIC ACTIVITY
Almost one-fifth (19.3 per cent) of all medieval finds in England have been made within 1km of a marketplace or a settlement granted a market charter by 1516, representing only 5.9 per cent of the total land area of the country.Footnote 36 This suggests that the PAS data provides a unique source of integrated, national-scale archaeological evidence on the growth and development of material culture, which can be used to either corroborate or challenge the existing knowledge on medieval economic activity. Yet simply comparing independent datasets, such the distribution of PAS finds and market records, directly against each other is unsatisfactory: inherent regional biases such as the varying level of detecting (highlighted above) and recording activity (that is, whether finds are actually offered for recording) influence the data.
A deeper understanding of the composition and structure of the PAS data is necessary to draw out features relevant to the medieval economy. One way by which this can be done is through a powerful technique that involves calculating a density-ratio – or relative risk surface – of a sub-set of events as contextualised within its parent dataset. Whereas, for example, a standard kernel density ‘intensity’ surface of findspots expresses variance in the distribution of all mapped locations, a relative risk surface can express the regional proportion of findspots belonging to a sub-set (such as a specific object type) against the whole data. Originally developed for epidemiological research, the technique has since found applications in a wide range of disciplines.Footnote 37 In the context of investigating PAS data, it alleviates the problem of cross-regional comparison of finds frequency. For example, finds of medieval spindle whorls are slightly more numerous in Norfolk (339) than in the area covered by the Cheshire, Greater Manchester and Merseyside FLO (298). This is unsurprising, since Norfolk is the most productive region in terms of recorded finds. Yet, in the Cheshire region spindle whorls represent a far higher portion of all medieval finds (14.3 per cent) than in Norfolk (1.1 per cent), which may indicate the increased importance of spinning to the local peasant society.Footnote 38 A relative risk analysis can represent this as a finely grained surface, and allows more precisely located determinations on material culture variation.
Here single finds of coins provide an important dataset for examining both the character of the PAS database and recovering information on economic change. Single coin finds possess several highly relevant virtues: they are numerous (32.3 per cent of all medieval finds), almost uniquely datable,Footnote 39 and inform of patterns of money use and the monetisation of the medieval economy. The precision of dating for single finds of coins is considerably higher than for other PAS finds, which are mostly impossible to date to less than within 100 to 200 years. Fifty-one per cent of medieval coins are dated within ten years of minting, and 83 per cent within fifty; in contrast, only 0.5 per cent of non-numismatic artefacts have been dated within ten years, 26 per cent within fifty and 70 per cent within 300. While analysis must consider the fact that a coin may have remained in circulation for a significant number of years until it was removed by loss, foreign trade or re-minting,Footnote 40 such precision in dating yields invaluable information on money use and economic developments on local, regional and national scales alike.
It has been posited that the absolute numbers of recovered single coin losses reflect medieval population statistics.Footnote 41 At a course-grained national-scale level of analysis, this appears axiomatic, as a more densely settled region could be expected to have had a higher number of coins in circulation. Coins are nevertheless found practically everywhere that other types of finds are made and reported, and on the national scale a distribution map of medieval coin finds is essentially visually identical to one of all medieval finds in the PASd. The great numbers of coin finds in East Anglia may well owe to its high levels of wealth and population. This is unlikely to hold true to the same degree for the western parts of the Isle of Wight, which boasts the highest rates for medieval coin finds anywhere (some fourteen records per km2). Instead, this is substantially owed to a high level of detectorist activity (recovery) and the close relationship the local FLO has with the local detecting community (recording).Footnote 42
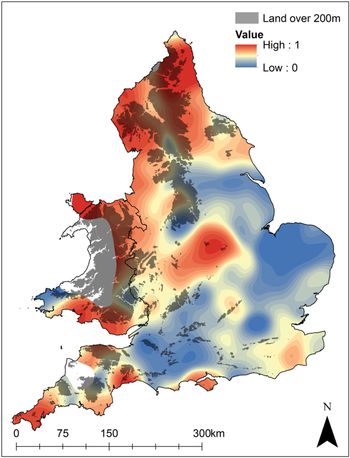
A relative risk surface of coin finds dated ad 1100–1350 against all other PAS finds dated c 1100–c 1400 (fig 4) contextualises coin loss patterns in the Central Middle Ages against regional PAS recovery rates. As with kernel density estimates, the results can be represented as a ‘heat map’ showing regional differences in the relative finds frequency of coins amidst the full population of PAS data. The result reveals that most of the areas that other indicators show were particularly wealthy or commercially active (see fig 3) actually have lower relative coin recovery rates. There are some northerly regions of high ground (such in the Pennines or the North Yorkshire Moors), where very low rates of coin deposition could be expected. But many areas possessing lower numbers of coin finds relative to the rest of the local PAS population are among the wealthiest in the kingdom, including London, Norfolk and parts of the western Midlands.
Relative risk surface of PAS coin finds dated 1100–1350 against all other finds c 1100−c 1400 (r = 15km), showing areas where single coin finds are more (warm colour) or less (cool colours) frequent relative to the overall regional finds intensity. Source: PASd.

It is suggested here that, except in remote and sparsely settled areas, lower levels of coin finds relative to other objects mark more intensive regional production of different types of metal objects. In other words, these are regions with comparatively more complex and richer metalwork material culture. The mechanisms underlying coin deposition and recovery patterns are difficult to comprehensively assess. While the level of money use in local economies may have varied greatly, by the twelfth century the royal administration desired its rents to be paid in silver and this meant coins on the whole circulated widely.Footnote 43 For researchers today, the positive bias for coin recovery means that this uniquely substantial body of recorded material can be used as a control for understanding detecting activity against which the frequency of other finds can be assessed. In its broad structure, especially in the concentration of activity in the South West and East Anglia, the relative risk surface map of high medieval coin finds reflects the distribution of markets and assessed wealth in the fourteenth century. What this may reveal is a picture of the overall production of non-numismatic metalwork culture that is more finely contextualised within the biases of the PASd than a simple distribution map of findspots.
Diachronic approaches similarly provide more nuanced and localised insights into relative regional levels of economic prosperity. As the only large coin database covering England and Wales through the entirety of the Middle Ages, the PAS dataset offers unique opportunities for studying the development of regional coin economies across long periods of time. From the late Anglo-Saxon period until the Black Death, the number of coins minted in England grew substantially, from an estimated seven million silver pennies in 1066, to some 120 million in 1279, and reaching a high of over 500 million in the early decades of the fourteenth century. This reflected economic growth, increase in overseas trade that brought silver into the country, and the growing prevalence of cash transactions.Footnote 44 In the PASd, the increase from 912 recovered coins from the late Anglo-Saxon period (ad 973–1066) to the 9,115 long cross coins minted between the 1247–50 and 1279–81 national re-coinages attests to this great monetary development.Footnote 45
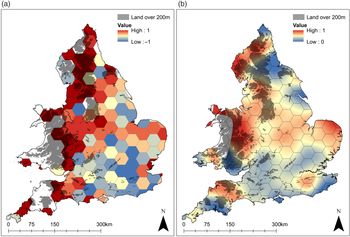
Yet, because of differing levels of detectorist activity, the absolute distribution of finds offers a poor resource for comparing historical change between regions. Issues relating to recovery bias are more manageable if finds are compared not cross-regionally, but diachronically within specified regions. Figure 5a divides England and Wales into hexagonal regions with a maximum north−south diameter of 40km. The percentage of PAS coins that each region contains out of the total for the late Anglo-Saxon period (973–1066) and the Long Cross period (1247–79) is separately calculated, and then the resulting values compared to determine whether there was a relative increase or a decrease per hexagon from the eleventh century to the thirteenth. This comparative assessment reveals that the most significant relative increase was in the northern and western parts of England.
(a) Comparing relative increase (positive) or decrease (negative) in the proportion of coins per hexagonal region out of the total national number between the late Anglo-Saxon (973–1066) and Long Cross (1247–79) coin periods. Darkest red indicates areas where no Anglo-Saxon coins have been found; white indicates either no data or only one coin of either period. (b) Relative risk surface of markets chartered or founded 1200–50 out of all markets by 1250 (bandwidth 25km), showing areas of most new market foundations relative to the number of existing local markets in red. Source: Letters Reference Letters2002b, PASd.

The numismatic data reflects information on the regional intensity of new market foundations or grants made between 1200 and 1250, as shown by a relative risk surface (fig 5b). Correlation is noticeable in northern England and the Welsh borders, where the number of known market events before the thirteenth century had been low. It can be seen in growth in the commercially active north-eastern Norfolk as well as in the relative lack of new markets along the south-eastern coast, where a network of sites had already been in place by the Domesday survey.Footnote 46 The relative increase in number of markets regionally appears to bear a relationship with modern recovery through hobby metal-detecting, and thereby historical circulation and deposition patterns.
RURAL AND URBAN ASSEMBLIES
Previous research on metalwork finds, often working on the basis of local collections, has struggled to differentiate urban and rural assemblages.Footnote 47 A mass statistical analysis of medieval PAS finds recovered in the immediate vicinity of market settlements, however, shows aggregate patterns that separate these from rural scatters. As land is unequally covered by metal-detecting activity, the following technique has been used to understand the density of PAS finds. All medieval PAS finds made in England and recorded with at least a six-figure National Grid Reference (NGR; 155,809 or 70.1 per cent of medieval finds) were taken and a circle with 141m radius (the distance between two opposite corners of a 100m × 100m NGR square) was calculated around each co-ordinate location. Overlapping circles were merged, and spaces excluded from metal-detecting (the sea, modern build-up areas and within the boundaries of protected/restricted sites)Footnote 48 removed from the surface. The resulting area covers 2,788km2 and can be taken as a generous proxy for the landscape area from which medieval finds have been made and reported. The average density of all medieval finds within this space is 55.9 per km2.
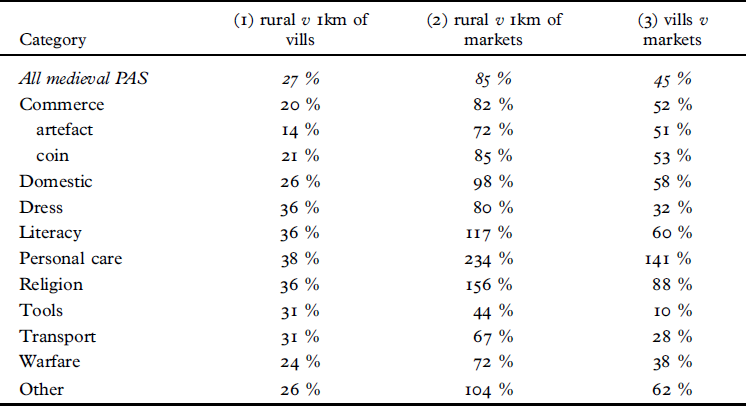
The particular value of PAS data lies in opening up new possibilities for examining trends in different socio-economic environments at a national scale. In order to consider variation in finds density between areas with different levels of habitation, medieval finds in England were divided into three non-overlapping datasets. The first set consists of finds recovered within 1km of known medieval market sites by 1334 (5,292 finds, with an average density of 86.3 finds per km2).Footnote 49 The second consists of finds recovered within 1km of medieval settlements, as indicated by tax vills in 1334 lay subsidy (67,895 finds, or 59.3 per km2).Footnote 50 The third and final set consists of all remaining finds (50,426 finds, or 46.8 per km2). In order to enhance the possible contrast between assemblages recovered near market/urban and non-market sites, finds that fell within 3 km radius of marketplaces active in 1334 were also removed from the two latter sets; while chosen arbitrarily, this figure is approximately the averaged distance between a tax vill and its most immediate neighbours in the 1334 lay subsidy. It is clear that finds frequency of medieval objects increases substantially as one moves from the non-village regions towards settlements (26.9 per cent increase), and even more so as one moves towards market and urban sites (84.5 per cent increase, see table 1). As noted, previous works have established that the gross distribution of small finds reflects estimated population density at a national scale.Footnote 51 Here the medieval PAS data appears also to reflect wealth and economic activity even at more narrowly defined ranges.
Contrasting data from three non-overlapping populations of PAS finds in England: finds recovered within 1km of market/urban sites by 1334 (markets), finds recovered near all other settlements (vills), and all other finds (rural). The table gives the increase in PAS finds frequency per km2 as a percentage figure as one moves from rural areas to non-market settlements (column 1), from rural areas to urban/market sites (column 2), and from non-market settlements to urban/market sites (column 3). Source: Barry et al Reference Barry, Bartley, Campbell and Glasscockn.d.; Letters Reference Letters2002b; PASd.

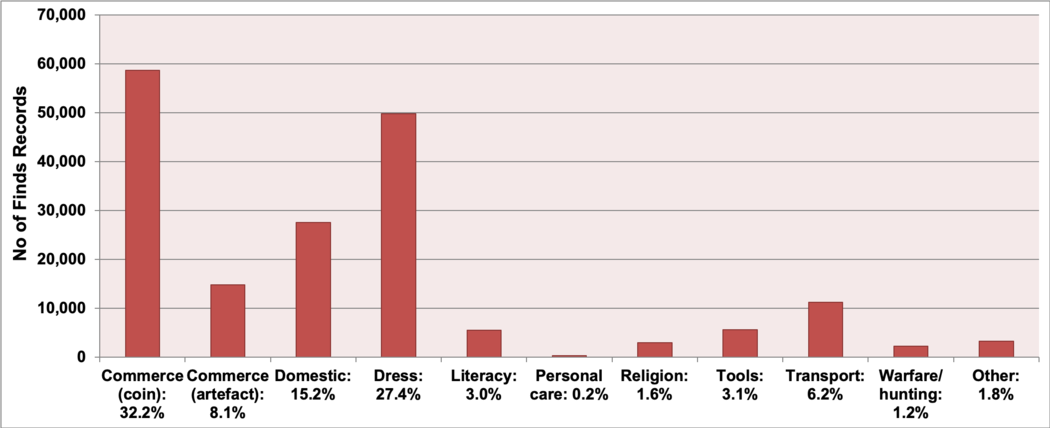
On this basis, distinctions in the composition of PAS assemblages between market and non-market settlements can now be studied, in order to better understand how this body of evidence informs us of differences in the material culture between commercial centres and the broader countryside. The complexity and heterogeneity of the PAS data, however, comprising 612 different medieval object types, creates a challenge for understanding patterns within the database. To enable a meaningful analysis, the finds have been consolidated into nine broad artefact categories (shown in fig 6): (1) commerce (including coins, weights for coins, cloth seals, purse elements, tumbrels, etc); (2) domestic (household furnishings, items associated with food and drink, and pastimes and entertainment, including toys); (3) dress (badges, brooches, buckles, pendants, strap-fittings, etc); (4) literacy (book fittings, seal matrices, writing implements, etc); (5) personal care (combs, chatelaines, mirrors, etc); (6) religion (ampullae, bullae, religious figures, monumental brasses, pilgrim badges, etc); (7) tools (axes, die stamps, moulds, spindle whorls, needles, thimbles, querns, etc); (8) transport (horseshoes and harness fittings, stirrups, etc); (9) warfare (arrowheads, armour, daggers, hunting equipment and sword chapes, etc). Miscellaneous object types with fewer than fifty finds not included above account for a final 1.8 per cent (other). Coins (32.2 per cent) have been further separated from other commerce objects (8.1 per cent) due to their large numbers. These groupings have been tested and appear robust, though invariably some artefact types might fit into more than one category (for example, knives could be used as domestic items, tools and/or weapons).Footnote 52 In general they reflect the main uses of objects, but also might be associated with site types. For example, domestic items are likely to be from habitation sites,Footnote 53 whereas dress accessories are more likely to be lost wherever people might have lived, worked or roamed.
PAS medieval object categories. Source: PASd.

Table 1 gives the variations among the different finds categories between the three spatially determined datasets described above. Each column gives the percentage figure by which the density of finds in the object categories rises as one moves to a more densely settled area. The results of the analysis are therefore interpreted as contrasting the aggregate character of the PAS object categories between non-settled (or non-nucleated rural), settled (vill) and urban/market (market) regions. Given the size of the datasets and the variety of environments they are collected from, too much cannot be read into small differences in the values; but a number of trends do appear. When moving from the deep countryside to village environment (column 1) the higher than average results for dress (36 per cent), literacy (36 per cent), personal care (38 per cent) and religion (37 per cent) objects suggest that they are more likely than others to be used, lost and discarded around settled, possibly nucleated, village environments.
These trends are heightened when moving from rural to urban/commercial sites (column 2). Among the scatters found within 1km of markets, increases in the frequency of finds relating to literacy (117 per cent), personal care (234 per cent) and religion (156 per cent) are particularly high, although this is somewhat inflated by the substantial numbers of these items recovered along the London foreshore. They may be particularly associated with the rich material culture of the metropolis, or the fact that certain finds types (such as lead-alloy badges) survive well in the anaerobic conditions of the Thames mud. Even excluding London finds from the market dataset, these objects are still particularly frequent (respectively 113 per cent, 190 per cent and 145 per cent). Dress objects do not stand out proportionally (80 per cent). This indicates that as a broad category these are not, in proportional terms, especially urban or commercial.
It appears that what differentiates the aggregate urban/market scatters from finds made near all other settlements (column 3) most clearly are objects associated with literacy (mostly seal matrices) and religion (mostly pilgrim souvenirs). The statistically high frequency, though relatively small number (altogether a little over one hundred), of personal care and miscellaneous ‘other’ objects recovered in the vicinity of urban sites perhaps simply attests to their expected greater complexity of metalwork material culture. Conversely, the lower results for dress, tools, transport and warfare suggests that as broad categories they are less stringently associated with specifically urban and formal commercial environments.
It is surprising that commerce objects are not proportionally more frequent near market sites than other object types. The relatively even distribution of coins across the country shows their abundance and use outside towns and nucleated settlements. It is striking that finds frequency of commerce artefacts increases the least (by only half the average) between the ‘rural’ countryside and villages. There is a significant increase only near markets and towns. Jettons and tokens, and elements of the purses that would have contained these, as well as coins, however, account for 57 per cent of these urban finds. The observation that their recovery rate (and by implication their use and deposition) is significant only near markets and towns supports the notion they were used mostly in larger, more populous and economically more complex environments. These national-scale figures indicate both the scope in the use of cash use for transactions, and the limits of other complex forms of transaction.Footnote 54
LOCAL CONTEXTS
To assess the relationship between PAS data and sites of medieval markets, six case study areas were considered for greater analysis, allowing the potential to investigate relationships between artefact types within a landscape context. These were areas falling within 10km of Kingston Deverill (Wiltshire), Wantage (Oxfordshire), Litchfield (Staffordshire), Stamford Bridge (East Yorkshire) and the coastal region between New Romney (Kent) and Winchelsea (Sussex), as well as a comparative dataset of finds made within 10km of the London−Exeter road between the market towns of Stockbridge and Alton and passing through Winchester (Hampshire). These areas were chosen on the basis of having a good quantity and quality of PAS data with a potential correlation with market sites, and varying geographical and topographical locations. Although the finds composition of the six areas will be contrasted, it is apparent that three of them (Kingston Deverill, Wantage and New Romney−Winchelsea) better demonstrate the relationship of PAS data to market sites, and therefore provide more meaningful results. It is these three sites that provide the focus here.
Kingston Deverill (Wiltshire)
While one must be mindful of the biases and inaccuracies inherent in medieval national wealth assessments, the Domesday Book and the 1334 lay subsidy provide helpful snapshots to local landscapes of wealth. In 1086, the manor of Kingston Deverill was valued at £3 10s, with a further £44 11s assessed to the vill of Deverill.Footnote 55 As such, the vill stood out as being particularly wealthy in western Wiltshire, with only six other vills (out of 127) within a 20km radius being assessed higher. In 1334, the value of movable goods there was assessed at £72 and it remained wealthy in the local context, although its ranking had by now fallen to twenty-eight out of 164 nearby vills.Footnote 56 A market had been established at Kingston Deverill before 1382 when the franchise was noted as being owned by Netley Abbey (Hampshire).Footnote 57 The market may have been ancient. In the Early Middle Ages, Kingston Deverill was well connected in terms of transport routes, which will have empowered its prosperity. It was located at an intersection of medieval salt routes and a former Roman road travelling east−west.Footnote 58 This road connected Winchester and the south coast with the Fosse Way, and beyond it Bath and Gloucester, and was still used in the Middle Ages. The former Roman road appears to have crossed through an area north of the settlement (see below), which has been extensively searched by detectorists.Footnote 59 The modern road network, however, is noticeably different. The Ogilby map of 1675 gave no roads through Kingston Deverill; the two main routes in southern Wiltshire passed east−west through Warminster to the north and Shaftesbury to the south.Footnote 60 It is possible that there had been a re-alignment of the regional network of key travel routes in the later medieval period, perhaps in concert with the changing landscape of economic wealth in the region. The PAS data would appear to support this thesis.
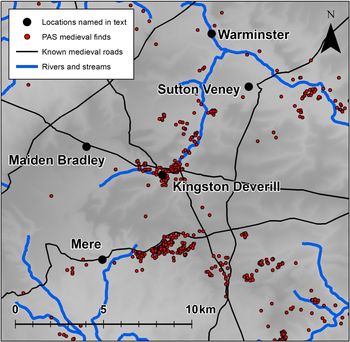
The historic landscape around Kingston Deverill has been explored by two detectorists (Val Macrae and Brian Read). It is important to appreciate the distinction between hobby metal-detecting carried out by local people, who have a direct interest in and appreciation of the historic landscape, and that carried out by significant numbers of people (such as part of a commercial metal-detecting rally) where no particular affinity can be assumed. The 4,990 finds recorded from within 10km of Kingston Deverill (fig 7) are of multi-period date. This is typical in regions of the country with a long settlement history, though they are predominately Roman (3,132 finds) followed by those of medieval date (858). The latter are particularly concentrated in a field area north of modern Kingston Deverill that is associated with the Roman and medieval road. This clustering might only reflect the focus of detecting, but it could represent commercial activity, especially since iron ore and slag have also been recovered. Local enquiries have revealed little more information,Footnote 61 and neither is further evidence revealed through the local Historic Environment Record.
Distribution of medieval PAS finds near Kingston Deverill, Wiltshire. Source: PASd.

Out of the 858 medieval objects found at Kingston Deverill and analysed as part of this study, those associated with commerce are the most common (41 per cent at 355 objects). This is typical of the six areas examined, which (apart from the region around Winchester) show a loss of commercial items slightly above the national average. These finds are mostly coins (312), but also include jettons (21) and tokens, as well as weights and metal purse fittings. The next largest category are dress accessories (33 per cent at 286 finds). This group is very mixed, though a good proportion of finds are buckles (138), followed by strap-ends and strap-fittings (87), brooches (21) and finger-rings (14). Following are domestic objects (14 per cent at 121 records). Most common are keys and padlocks (14), mounts (49) and vessel fragments (46). A significant number of items (29) are associated with transport. All but one of these items are associated with the medieval horse; they include harness gear (20) and stirrup elements (7). Of the fifteen items associated with literacy, all but four are seal matrices. There are only nine religious objects, of which five are pilgrim souvenirs.
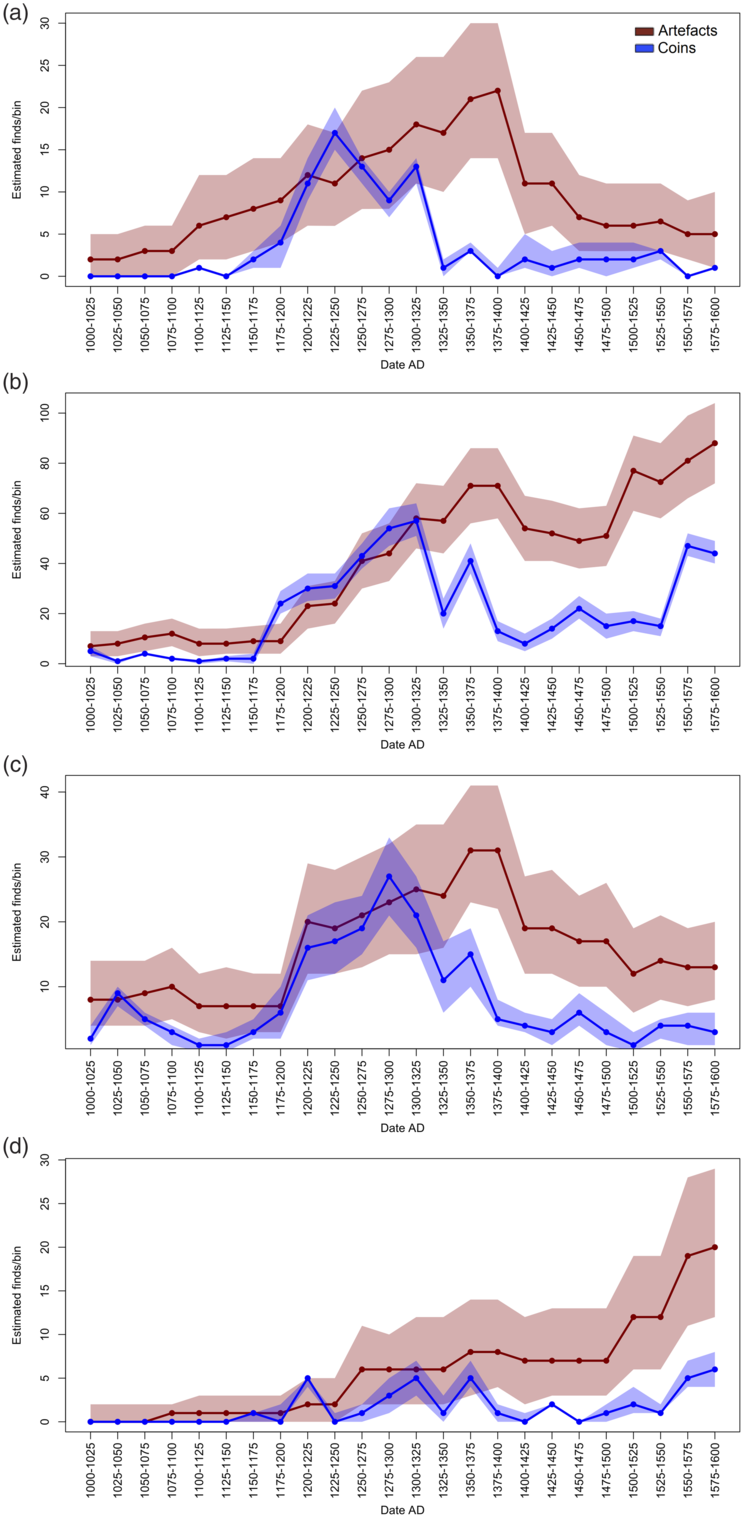
It might be expected that broad trends relating to historical activity could be drawn out from the mass of PAS finds made around a site. Temporal uncertainty inherent in the PASd (simply because most objects are impossible to date as precisely as coins) poses challenges to representing and analysing the finds data. One powerful and straightforward technique for understanding the temporal distribution of such ‘fuzzily’ dated PAS finds is aoristic analysis. This technique has been used (for example) by criminologists for estimating peak offence times (such as, variability in the frequency of thefts in a certain area over the course of a day), and through new digital humanities techniques has been successfully adopted for investigating archaeological and historical datasets. Calculating the aoristic sums of a group of finds makes it possible to model change in the weight of deposition activity.Footnote 62 Due to object dating uncertainty, the results are probabilistic rather than absolute. It is therefore more representative to display a range of probabilities through Monte Carlo simulation that creates an envelope of results – a region within which the real result is likely to fall with a high (95 per cent) degree of confidence.Footnote 63 Such analysis enables us to examine broad patterns in the distribution of finds data across long periods, and indicate how both historical trends and modern biases operate in the PASd.
Narrowing down to within just 1 km of Kingston Deverill, an analysis of single-lost coins indicates that most were deposited in late twelfth to early thirteenth centuries (fig 8a). The majority (thirty-nine out of eighty-three) was found on the productive area north of the settlement. In isolation, local coin finds only indicate how coin loss rises or falls, for which there may be reasons that are not strictly related to the increase or decrease of local commercial exchange. A classic example is changes in the overall level of currency in circulation.Footnote 64 If located within a wider geographical context or compared against assemblages from other sites, however, finds in the study area may inform of local peculiarities. The composition of single-lost coins in the PASd as a whole broadly approximates variation in the size of English silver currency estimated from mint and hoard evidence.Footnote 65 As noted above, this increased until the first half of the fourteenth century, thereafter falling to a quarter of its former size in the second half and not substantially recovering until the early modern period.Footnote 66 Up to mid-thirteenth century Kingston Deverill finds roughly follow this pattern, but then flatline to below the national mean. It is not known if the northern site was abandoned, but coin loss frequency in the whole settlement area declined.
Cumulative ‘probability envelope’ created from 1,000 runs of Monte Carlo simulation based on aoristic sums of non-coin artefact and coin finds in PASd, ad 1000 to 1600 within (a) 1km of Kingston Deverill; (b) 10km of Wantage; (c) 5km of New Romney; (d) the Udimore parish by Winchelsea. The solid line indicates the mean value. Source: PASd.

Other object finds, necessarily dated more imprecisely (as explained above), increase steadily through to the end of the fourteenth century with a drop after 1400. In both instances the major phase of depositions is during the Central Middle Ages and the numbers do not substantially recover in the later period. This stands in clear contrast to the broader regional picture as slightly more post-medieval (1,184) than medieval (1,025) finds have been recovered within a ring of 10−20km out from Kingston Deverill. It is suggested that this decline in the consumption of metalwork objects is situated in the context of competition from nearby economic centres. Between 1267 and 1298 markets were granted to Sutton Vene, Maiden Bradley and Mere, all within just 5−7km of Kingston Deverill to the north, east and south. By 1300 a total of seven other settlements within 10km of Kingston Deverill possessed market rights.Footnote 67 This would reflect a re-arrangement of the regional landscape of transport and travel, which eventually led to the dislocation of Kingston Deverill as a commercial hub and a decline in the quantity of material culture deposited.
Wantage (Oxfordshire)
Commercially more powerful than Kingston Deverill, Wantage prospered as a local centre throughout the Middle Ages. In 1086, manorial wealth at Wantage was valued at £66 5s; in 1334, its movable wealth was assessed at £75 12s 7 d.Footnote 68 Originally a Roman settlement, it became a royal West Saxon vill and was held in royal demesne until 1199.Footnote 69 Its status no doubt laid the foundations of economic growth, fostered by early market and fair events. Wantage had a Sunday market before 1203–4 and a fair before 1212, probably held in October; a second three-day fair, to be held in early July, was granted in 1246. These franchises survived the economic turbulences of the fourteenth century and still existed in the early fifteenth.Footnote 70 Although valued in 1334 approximately the same as Kingston Deverill, Wantage belonged to a more densely occupied and economically prosperous landscape. The fragmentary 1327 and 1332 lay subsidy returns, which list the assessed wealth of individual tax-payers, reveal in western Berkshire a denser concentration of vills with a high wealth per capita ratio than anywhere else.Footnote 71
Favourable agricultural landscape factors, such as the prevalence of meadow, will have underlain regional wealth.Footnote 72 Economic prosperity is likely to have been advanced by significant transport connections. The Icknield Way (or Ridgeway) passes south of Wantage along the edge of the escarpment, making this historically an important east−west cross-country travel intersection. It is at a terminus of a Roman road coming down from Oxford still in use in the nineteenth century. The town is only 12km away from the Thames by Abingdon, and further to the south, on the other side of the Downs, there was an important nexus of cross-country routes including the London−Bath road marked out in the Gough Map of c 1400.Footnote 73
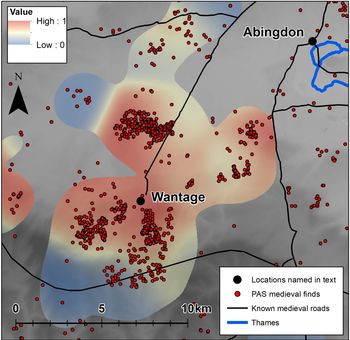
The finds recovery context at Wantage offers a contrast to that at Kingston Deverill. Because of the modern built-up environment around the site, only two dozen medieval finds from within the immediate 1km vicinity of the historic settlement centre have been recorded. As mass analysis of objects adhering closely to the settlement itself is therefore impossible, we consider the broader historical landscape by extending the range to a 10km radius. Here the total number of medieval finds rises to almost 1,350 (fig 9). The largest category of objects is commerce (42 per cent at 568 records). Besides coins (434), there are also considerable numbers of tokens (64), followed by weighing equipment (22), jettons (34), purse elements (11) and cloth seals (3). Items of dress number 356 objects (26 per cent), of which there are represented buckles (195), strap-ends and strap-fittings (77), brooches (25) and finger-rings (23). Of the domestic items (16 per cent at 214 records) there are relatively high numbers of vessel fragments (91) and mounts (79), also keys (20) and spoons (10). Most transport finds (6 per cent at eighty-three records) are associated with the horse, consisting of harness fittings of various types (44), stirrup fittings (22), bridle bits (5) and two horseshoes and two spurs. Also recorded are a number of bells for livestock (8). Nearly all tools (3 per cent at thirty-nine records) are associated with the cloth trade, including thimbles (33), spindle whorls (4) and a single needle. Of the items identified with literacy (2 per cent at twenty-nine records), all but six are seal matrices. Religion accounts for fourteen finds (1 per cent), consisting of ampullae (6) pilgrim badges (4) and three bullae. There are only thirteen weapons (1 per cent), of which ten are bladed weapon parts.
Distribution of medieval PAS finds near Wantage, Oxfordshire, overlain with a relative risk surface comparing major medieval and post-medieval scatters against Roman and Iron Age scatters. Source: PASd.

The metal-detecting data is unusually large and complex because the area has been the focus of metal-detecting rallies: usually one- to three-day events that have attracted many hundreds of individuals.Footnote 74 Of 570 different finders who have recorded their finds, none has recorded more than forty items. Therefore, while the small finds data is rich, it is potentially much less than the actual (now substantially lost) archaeological resource of the area, highlighting the potential damage caused to archaeology by large-scale metal-detecting, even if well organised. Quantity, however, does have a certain quality of its own, and the richly multi-period character of the local PAS data may capture long-term trends. Strong continuity in metalwork material culture across the medieval period is shown by aoristic analysis of the PAS finds. In clear contrast to Kingston Deverill, artefact deposition rate declined only slightly after 1400, and more than recovered in the Later Middle Ages (see fig 8b). Indeed, while the artefact finds pattern follows the PAS national average, post-Black Death change is shallower (an average of 31 per cent as opposed to 38 per cent decline from the high mark to the low by aoristic sum in 25-year bins), similarly echoed in the single coin finds sequence.
Spatially, the main concentration of finds is immediately to the south of Wantage, where the majority are Roman (1,330), followed by post-medieval (657) then medieval (513) and Iron Age (97) finds. A relative risk surface analysis shows that medieval and post-medieval finds are concentrated within 3−4km of Wantage itself, with Iron Age and Roman finds having a wider dispersion pattern that includes a concentration on the higher ground cut through by the Ridgeway. The data is only suggestive, but could indicate a comparatively more concentrated settlement pattern in the medieval period, as well as a local communications network in which the old Ridgeway now played a less important role.
New Romney (Kent) and Winchelsea (Sussex)
The area around New Romney and Winchelsea is of interest because it was to become an important maritime hub in the Middle Ages. Historically, much of the region was covered by the coastal Romney and Walland Marshes. Land reclamation largely took place in the Middle Ages, with the largest settlements clinging to promontories of higher ground above the flood plain. The region was ideally situated for travel over the English Channel coast, with New Romney, Winchelsea and the neighbouring town of Rye being members of the Cinque Ports.Footnote 75 The Rother and Brede rivers were navigable until the mid-fourteenth century,Footnote 76 and the coastal route from Canterbury towards Southampton seen in the Gough Map of c 1400 passed through Appledore, Rye and Winchelsea.Footnote 77
The port settlement of Romenel, now associated with New Romney but possibly incorporating Old Romney further west, was a borough in the Domesday survey of 1086. It is likely to have hosted a market by then, although one is first attested only in 1283–5.Footnote 78 During the fourteenth century, New Romney sustained specialist markets for hemp, butter, poultry and meat.Footnote 79 The early origins of Winchelsea are more obscure, but it had a weekly market before 1200 with a second granted in 1209. Old Winchelsea, which had grown by the thirteenth century into a busy port, was destroyed by incursions of the sea between 1250 and 1288. The precise site of the old town is unknown and may now be under the sea. New Winchelsea was laid out in 1283, acquiring liberties of the former town including its market and three-day May fair.Footnote 80 The region was commercially active. A borough was established in Lydd (Kent) between 1154 and 1158.Footnote 81 Appledore (also in Kent) held an August fair before 1312 and was granted a market and a May fair in 1358. Rye (Sussex), a borough in 1086, held two autumn fairs from the thirteenth century and markets on Wednesdays and Fridays from before 1401.Footnote 82 Despite this economic promise, the heyday of the Cinque Ports was over by the Later Middle Ages. Winchelsea, New Romney and Rye declined in importance during the fourteenth century due to raids from France and the silting up of the coastal estuaries.Footnote 83 All have survived as market towns to the modern times.
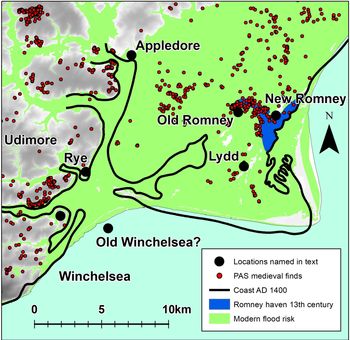
The area encompassing these settlements, here defined as falling within 15km of the coastal intersection of Guestling Hundred and Goldspur Hundred between Winchelsea and New Romney (fig 10), is rich in finds (2,773), most of which are medieval (1,451). Metal finds of all periods made at New Romney by 2009 have been previously discussed by Geoff Egan, who noted that the general character of the assemblages showed both the presence of fishing industry as well as the town’s connections to long-distance exchange.Footnote 84 In contrast, a 2004 assessment of excavated finds made in Winchelsea noted that the mere seventeen coins, tokens and jettons recovered was a surprisingly small number for an important commercial centre, and speculated that this was due to the non-use of metal-detectors and wet-sieving.Footnote 85
Distribution of medieval PAS finds in New Romney−Winchelsea area, showing reconstructed coastline c 1400. Source: EDINA Geology Digimap Service, Long et al Reference Long, Martyn, Plater, Long, Martyn and Plater2007, PASd.

This highlights the importance of the PAS as a complementary source of archaeological data, as almost a half (49 per cent at 712 records) of PAS finds in the broader region are associated with commerce. Coins are common (543), followed by tokens (95) and jettons (29). Also found are a significant number of weights (28), two balances and twelve purse elements. Dress accessories (21 per cent at 309 records) comprise buckles (177) as well as strap-ends and other strap-fittings (46), finger-rings (32) and brooches (29). Included amongst domestic items (13 per cent at 185 records) are vessel parts (96), mounts (41), keys (32) and items of lighting equipment (5). Items related to transport (5 per cent at seventy records) are again associated with the horse, including bridle and harness fittings (37) – of which twenty are harness pendants – and stirrup (22) and spur (6) elements. Of tools (2 per cent at thirty-two records), all but one are thimbles. Fourteen of the religious objects (2 per cent at twenty-four records in total) are ampullae, the rest more various. Included among the items of warfare/hunting (1 per cent at thirteen records) are nine scabbard elements; the other objects are from the bladed part of weapons. Items associated with literacy (6 per cent at eighty-three records) are twice as well represented in the data as the national average. Apart from ten book fittings, all are seal matrices. An effort was made in the autumn of 2001 by one of the authors (Lewis), then the FLO for Kent, to encourage finders to bring such items for recording, resulting in twenty-four new entries. Even discounting this spike (a good example of local recording bias), the high number of seal matrices may reflect their level of historical prevalence and use. A relative risk surface analysis does show these objects are, adjusted to the total finds population, more common in Kent than in any other county.
About 100 finders have recorded medieval finds from the New Romney−Winchelsea area, the most prolific being Alan Charman (384), around Winchelsea and west of Appledore, and Dale Smith (159), immediately around New Romney. In general, most finders are local, and are therefore perhaps more likely to identify with the historical landscape.Footnote 86 The area’s largest medieval scatter (361) lies mostly to the west of New Romney, encompassing an area some 2.5km in radius towards Old Romney. The medieval coin evidence, datable more closely, shows a longer history of deposition activity beginning before the Norman Conquest, and peaking in the thirteenth and fourteenth centuries with no recovery to the high medieval maximum (see fig 8c). By Winchelsea, the main concentration of medieval finds appears immediately to the north-west in the parish of Udimore (342). In contrast to the neighbouring New Romney, the main deposition period here begins only in the latter part of the thirteenth century (see fig 8d). This coincides with the period when New Winchelsea was laid down, and may also reflect increase in human activity brought by farming and land reclamation efforts in the Brede river valley.Footnote 87
Among artefact finds, these very local patterns stand in contrast to those of Kingston Deverill and Wantage. They appear to reflect both the relocation of Winchelsea and the development of its hinterland, as well the loss of New Romney’s haven due to silting by the mid-fifteenth century.Footnote 88 The temporal sequence of 167 single-lost coins dated c 1000–c 1600 at New Romney fits this picture, with a significant decline in numbers from the late-thirteenth century and without growth in the early modern period. The sequence recovered by Winchelsea is more flattened, though this may be due to a less significant sample of only thirty-eight coins. Interestingly, however, non-coin artefact finds at Udimore increase steadily through the Later Middle Ages. Winchelsea remained a regionally important port longer than Romney, but this also shows that PAS finds should not be incautiously taken as a direct proxy of changing levels of the local economic prosperity. The differing temporal patterns may also reflect the character of the landscape. The finds by New Romney are made on low-lying ground prone to flooding and soil movement. Scatters from various sites of historical activity may have therefore been buried beyond recovery by metal-detecting, leaving behind a particularly incomplete picture. Half of the objects near New Romney were recovered west of the modern town, much of which was under water until silting in the thirteenth century, and therefore resulting in a local bias towards later finds. Conversely, the scatter concentrated at Udimore is on high ground, less prone to disturbance from soil movement and consequently likely to yield a fuller chronology of depositions. Historical activity, post-deposition processes and modern constraints all contribute to produce the contents of the PAS database.
CONCLUSION
This paper owes itself to the growing wealth of evidence that the PAS data provides unique archaeological insights on scales ranging from the national to the local level. As the single largest unified archaeological dataset of public finds, the contents of the PASd reflect information on varying levels of past human activity across England and Wales. The finds data describes trends in material culture production and use that are directly relevant to socio-economic history and can successfully be used alongside other repositories of archaeological and historical evidence in ‘big data’ analysis. Different historical and modern biases governing the deposition, recovery and recording of finds must be sensibly accounted for, as shown above. Given that the PAS has been operating for over twenty years, it is often still possible to correspond with heritage professionals and finders who have been involved with data creation – a good example of citizen science. Especially for local studies, this may provide unexpected insights into the landscape that are vital for a nuanced understanding of finds recovery contexts.
The diversity of objects in the PASd naturally presents both opportunities and problems. Here it is suggested consolidating finds by function into broad categories in order to uncover wider patterns. The spatial distribution of medieval PAS finds reflects human activity across the historical landscape, sketching out both tendencies and identifying the characteristics of material culture near urban and commercial centres. Temporal analysis of specific local scatters further informs us on the historical fortunes of their related sites, and demonstrates the value of the PAS data as an independent source for understanding material culture and long-term economic development; one that is particularly significant for the hundreds or thousands of rural settlements that have enjoyed few references in written sources or hosted formal archaeological excavations. More specifically, the study shows that PAS finds can be linked with patterns of commercial activity that can be tested and proven to reflect information gathered from independent data. It is the case that medieval PAS finds are more likely to be found closer to commercial sites, including urban areas, even though the data is mostly gleaned from cultivated land in rural areas.
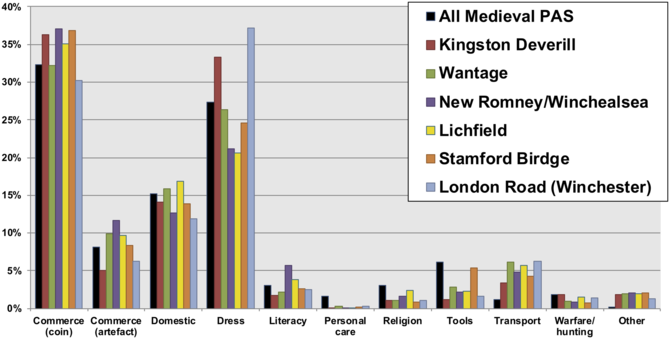
To this end, fig 11 gives the percentage proportions of PAS finds as collected into broad categories in the six case study areas covered by the project. At a first glance there is a surprising degree of similarity between the individual scatters and the PAS parent dataset. This suggests that (in very general terms) the deposition and recovery patterns of different artefact types across long periods of time and in various parts of the country are analogous, usually falling within a margin of some 5 per cent. Although there are differences in the local profile of medieval sites and a clear intensity (in terms of the quantity of items) nearer market and urban areas, it is apparent that across the country people availed to much the same material culture. Indeed, it is worth emphasising that already by the mid-thirteenth century some two-thirds of English vills were within 10km (a day’s easy return journey) of at least one borough and multiple market sites.Footnote 89 While there appears to have been urban−rural delineations with regard to certain object types (such as jettons and badges), the study shows that there is growing evidence that people in the country did have access to the same items used in towns. This was no doubt due to the widespread distribution of commercial sites and the transport networks that joined them.
Proportions of finds by object category in the six case study areas. Source: PASd.

A closer look, however, shows there are distinguishing trends between places and sites at the local level. In terms of commercial items, these areas – hypothesised as areas of commerce – seem to be more productive than the national average (40 per cent, adding coins and other commercial objects together). The New Romney and Winchelsea area has the highest percentage of these finds (49 per cent in total), followed by Stamford Bridge (46 per cent) and Litchfield (45 per cent). Only in the region centred on the overland route between Stockbridge and Alton that travels through Winchester (37 per cent) does this fall below the national average. As this area between Stockbridge and Alton encompasses a broader section of the rural countryside than the other regions, commerce objects – otherwise associated with nearness to settlements – are indeed expected to be less frequently represented. As such, it suggests how the PAS evidence could be significant in terms of profiling sites across the country. Given the difficulties associated with precisely dating most metal artefacts, it is also of note that, if carefully used, coins provide a useful ‘control’ for understanding assemblage chronologies. Moreover, it appears that low levels of coin finds, relative to others, may suggest a more complex and abundant metalwork material culture than previously thought.
The use of PAS data to explore commercial sites shows that some of these places can be more meaningfully explored than others. To some degree this depends on how the data is collected (in terms of detecting practice) and recorded (including information on how completely PAS data represents known local metal-detecting activity); therefore, perhaps those in PAS can become ‘more intelligent’ in how finds are recorded to mitigate against these biases. The contents of the PASd at a specific locale are directly influenced not only by the amount of metal-detecting activity conducted there, but by the form it may have taken: whether conducted by an individual or a small number of dedicated hobbyists with a strong understanding of historical metalwork and the landscape, a larger number of more incidental finders, or, at the other end of the scale, a commercial mass rally. Nonetheless, it is the case that artefact assemblages, and the groupings of these by type and function, helps to profile sites, suggesting how they developed, grew or declined over time. It is, of course, the case that these analytical tools can be applied to other sets of data – using PAS finds or not – and this is what is hoped will be the real legacy of this paper.
ACKNOWLEDGEMENTS
The authors thank Murray Andrews, Stuart Brookes and Rob Webley, who have read and commented on an earlier version of this paper. The authors are also grateful for the comments of the anonymous reviewers. All mistakes remain the authors’.
ABBREVIATIONS AND BIBLIOGRAPHY
Abbreviations
- FLO
-
Finds Liaison Officer
- GIS
-
Geographic Information System
- PAS
-
Portable Antiquities Scheme
- PASd
-
Portable Antiquities Scheme database https://finds.org.uk/database (accessed 7 April 2020)