Introduction
There is increasing evidence that both underweight status (Buchman et al., Reference Buchman, Wilson, Bienias, Shah, Evans and Bennett2005; Atti et al., Reference Atti, Palmer, Volpato, Winblad, De Ronchi and Fratiglioni2008; Burns et al., Reference Burns, Johnson, Watts, Swerdlow and Brooks2010; Anstey et al., Reference Anstey, Cherbuin, Budge and Young2011) and obesity are associated with an increased risk of cognitive decline and development of dementia (Gustafson et al., Reference Gustafson, Rothenberg, Blennow, Steen and Skoog2003; Anstey et al., Reference Anstey, Cherbuin, Budge and Young2011). Obesity may also increase the risk for cerebrovascular disease (Lavie et al., Reference Lavie, Milani and Ventura2009) and consequently lead to Alzheimer's disease and vascular dementia (Gustafson, Reference Gustafson2006).
Brain atrophy precedes the onset of cognitive decline and dementia (Jack et al., Reference Jack2010) and is considered an important preclinical biomarker for underlying factors that may affect dementia risk. Several studies have investigated the relationship between BMI and brain atrophy in normal subjects (Gustafson et al., Reference Gustafson, Lissner, Bengtsson, Bjorkelund and Skoog2004; Ward et al., Reference Ward, Carlsson, Trivedi, Sager and Johnson2005; Taki et al., Reference Taki2008; Burns et al., Reference Burns, Johnson, Watts, Swerdlow and Brooks2010; Raji et al., Reference Raji2010) with mixed findings due to small sample sizes, to differences in BMI distribution across study populations, and to the use of statistical models that constrained the associations to be linear. Indeed, several studies involving mainly severely obese individuals showed inverse associations between BMI and brain volume (Gustafson et al., Reference Gustafson, Lissner, Bengtsson, Bjorkelund and Skoog2004; Ward et al., Reference Ward, Carlsson, Trivedi, Sager and Johnson2005; Taki et al., Reference Taki2008; Raji et al., Reference Raji2010), while other studies involving mainly underweight individuals showed positive associations (Burns et al., Reference Burns, Johnson, Watts, Swerdlow and Brooks2010).
Based on clinical and epidemiological evidence (Gustafson et al., Reference Gustafson, Rothenberg, Blennow, Steen and Skoog2003; Buchman et al., Reference Buchman, Wilson, Bienias, Shah, Evans and Bennett2005; Atti et al., Reference Atti, Palmer, Volpato, Winblad, De Ronchi and Fratiglioni2008; Burns et al., Reference Burns, Johnson, Watts, Swerdlow and Brooks2010; Anstey et al., Reference Anstey, Cherbuin, Budge and Young2011), we hypothesized that the association between BMI and brain atrophy is non-linear with both underweight and severely obese individuals at higher risk of brain atrophy. No study seems to have investigated non-linear associations between BMI and brain atrophy. We thus investigated the association between BMI and brain volume in a large sample of cognitively normal individuals participating in a comprehensive health exam program, with a particular emphasis in identifying non-linear associations between BMI and cortical thickness.
Methods
Subjects
We enrolled Korean men and women who visited the Health Promotion Center at the Samsung Medical Center in Seoul, South Korea, from September 2008 to December 2011 for a medical checkup. As part of the comprehensive exam, participants could opt for a comprehensive neurological and neurocognitive screening package that included a brain magnetic resonance imaging (MRI). Among 1,681 participants who signed up for neurological testing, we excluded 15 participants under 45 years of age and 98 participants with cognitive impairment assessed by combining the findings of an interview with a qualified neurologist and a Mini-Mental State Examination (MMSE) score below the 16th percentile for age-, gender-, and education-matched norms (eTable 1, available as supplementary material attached to the electronic version of this paper at www.journals.cambridge.org/jid_IPG). We also excluded participants with incomplete data on demographics (N = 264), anthropometric measurements (N = 3), smoking or drinking habits (N = 10), history of hypertension (N = 3), or cholesterol or fasting blood sugar levels (N = 44). From the remaining 1,244 participants, we excluded 133 participants who had errors in cortical thickness analysis. The final sample size included 1,111 participants (555 men, 556 women) (eFigure 1, available as supplementary material attached to the electronic version of this paper at www.journals.cambridge.org/jid_IPG). The clinical characteristics of included subjects were generally similar with those of excluded subjects with the exception of systolic blood pressure, hyperlipidemia, history of stroke, and drinking (eTable 2).
This study was approved by the Institutional Review Board of Samsung Medical Center. The requirement for patient consent was waived since we used retrospective de-identified data collected during health exam visits.
Data collection
The examinations were conducted by trained personnel following a standard protocol. The health screening program included questionnaire data, a physical exam, laboratory tests, and a number of functional and imaging tests as previously described (Park et al., Reference Park2010). Questionnaire data included questions on physician-diagnosed disease, medication history, cigarette smoking, and alcohol consumption. Smoking status was categorized into non-smokers, ex-smokers, or current smokers. Alcohol consumption was categorized into non-drinkers and current drinkers. Height and weight were measured and BMI was calculated as weight in kilogram divided by height in meter squared. BMI was categorized into five groups based on the recommendations of the World Health Organization (WHO) for Asian populations: (WHO Expert Consultation, 2004) underweight (<18.5 kg/m2), normal weight (18.5–22.9 kg/m2), overweight (23.0–24.9 kg/m2), mild obesity (25.0–27.4 kg/m2), and moderate to severe obesity (≥27.5 kg/m2).
Blood pressure was measured with an electronic sphygmomanometer after participants had rested for more than 5 min. Hypertension was defined as a history of use of antihypertensive medication, a systolic blood pressure (SBP) ≥140 mmHg, or a diastolic blood pressure (DBP) ≥90 mmHg. Quality control procedures for laboratory parameters in fasting samples were followed in accordance with the Korean Association of Laboratory Quality Control. Diabetes was defined as a history of use of diabetes medication or a fasting blood glucose ≥126 mg/dL.
MRI data
All participants underwent a 3D volumetric brain MRI scan. An Achieva 3.0-Tesla MRI scanner (Philips, Best, the Netherlands) was used to acquire 3D T1 Turbo Field Echo (TFE) MRI data using a sagittal slice thickness of 1.0 mm, over-contiguous slices with 50% overlap and no gap, a repetition time of 9.9 ms, an echo time of 4.6 ms, a flip angle of 8°, and a matrix size of 240 × 240 pixels reconstructed to 480 × 480 over a field of view of 240 mm. Radiologists inspected all MRI data for evidence of brain tumors of any kind, major infarctions (except lacunar infarctions), and hemorrhages (observed as low-intensity areas in T2-weighted images).
Images were processed for cortical thickness measurement by the standard Montreal Neurological Institute (MNI) anatomic pipeline. The native MRI images were registered into a standardized stereotaxic space using a linear transformation (Collins et al., Reference Collins, Neelin, Peters and Evans1994). Non-uniformity artifacts were corrected, and the images were classified as white matter, gray matter, cerebrospinal fluid, or background using an artificial neural net classifier (Sled et al., Reference Sled, Zijdenbos and Evans1998). The surfaces of the inner and outer cortex were automatically extracted using the Constrained Laplacian-Based Automated Segmentation with Proximities (CLASP) algorithm (Kim et al., Reference Kim2005).
Cortical thickness was calculated as the Euclidean distance between the linked vertices of the inner and outer surfaces after applying an inverse transformation matrix to cortical surfaces and reconstructing them in the native space (Kim et al., Reference Kim2005). To compare the thicknesses of corresponding regions across subjects, we used an improved surface registration algorithm and an unbiased iterative group template, showing enhanced anatomic details (Lyttelton et al., Reference Lyttelton, Boucher, Robbins and Evans2007). Using the transformation, thickness information on the vertices was transformed into an unbiased iterative group template.
Statistical analyses
All analyses were performed separately by sex. The mean difference in cortical thickness across BMI categories was analyzed using analysis of variance. We used multiple linear regression to examine the association between BMI categories and cortical thickness adjusting for potential confounders such as age, education, hypertension, diabetes mellitus, hyperlipidemia, previous stroke, cardiovascular disease, smoking status, alcohol drinking status, SBP, DBP, fasting blood sugar, cholesterol, and intracranial volume (ICV). During the analysis, violations of statistical assumptions in linear regression models were assessed.
To explore non-linear relations of BMI with cortical thickness, we used a generalized additive model with penalized cubic regression splines and smoothing parameter selection by restricted maximum likelihood estimation. In the generalized additive model, we included a smoothed function of age and smoothed functions of BMI, education level, hypertension, diabetes mellitus, hyperlipidemia, previous stroke, cardiovascular disease, smoking status, alcohol use, SBP, DBP, fasting blood sugar, total serum cholesterol, and ICV.
Statistical analyses were conducted using SAS v9.3 (SAS Institute, Cary, NC). For generalized additive model analyses, we used the mgcv package in R statistical software (version 2.15.3) (Wood, Reference Wood2011).
Results
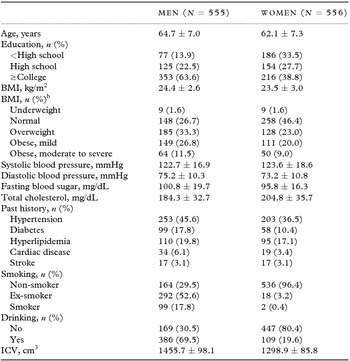
The characteristics of the study population are shown in Table 1. The proportion of women was 50.0%. Mean age (± standard deviation) was 64.7 ± 7.0 in men and 62.1 ± 7.3 in women. The proportion of participants who were underweight, normal weight, overweight, mildly obese, and moderately to severe obese was 1.6%, 26.7%, 33.3%, 26.8%, and 11.5%, respectively, in men, and 1.6%, 46.4%, 23.0%, 20.0%, and 9.0%, respectively, in women. The characteristics of the study population according to BMI groups are shown in eTables 3 and 4.
Characteristics of study participantsa

aValues are means ± standard deviations or number (percentage).
bBMI categories were: underweight, <18.5 kg/m2; normal weight, 18.5–22.9 kg/m2; overweight, 23.0–24.9 kg/m2; mild obesity, 25.0–27.4 kg/m2; moderate to severe obesity, ≥27.5 kg/m2.
Mean cortical thicknesses, including total, frontal, temporal, and occipital regions, varied significantly across BMI categories in men (eTable 1) with mildly obese participants having the highest and underweight having the lowest cortical thickness. In women, mean cortical thicknesses, including total, frontal, parietal, and occipital regions, also varied significantly across BMI categories (eTable 5), but normal weight participants had the highest mean cortical thicknesses (except in the parietal region), and underweight participants the lowest.
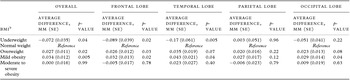
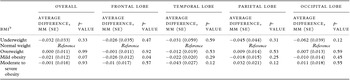
In multiple linear regression analysis after adjusting for potential confounders, the cortical thickness of the frontal and temporal lobes in men was significantly lower in the underweight group and significantly greater in the overweight group compared to the normal weight group (Table 2). In the frontal, temporal, and occipital lobes, mildly obese participants had greater cortical thicknesses than normal weight participants. In women, mildly obese participants showed statistically significant cortical thinning in the frontal lobe compared to normal weight participants (Table 3), but there were no significant differences in cortical thickness between the normal BMI group and other BMI strata.
Association between BMI category and cortical thickness overall and by brain lobe in mena

Abbreviations: BMI, body mass index; SE, standard error.
aMultiple linear regression model included age, education level, presence of each chronic disease (hypertension, diabetes mellitus, hyperlipidemia, stroke, and cardiovascular disease), smoking status (never smoker, ex-smoker, or current smoker), alcohol use (yes or no), systolic blood pressure, diastolic blood pressure, fasting blood sugar, total serum cholesterol, and intracranial volume (ICV).
bUnderweight (BMI <18.59 kg/m2), normal weight (BMI 18.5–22.9 kg/m2), overweight (BMI 23.0–24.9 kg/m2), mild obesity (BMI 25.0–27.4 kg/m2), and moderate to severe obesity (BMI ≥27.5 kg/m2).
Association between BMI category and cortical thickness of each brain lobe in womena

Abbreviations: BMI, body mass index; SE, standard error.
aMultiple linear regression analysis was performed after adjusting for age, education, hypertension, diabetes mellitus, hyperlipidemia, previous stroke, previous cardiovascular disease, smoking status, alcohol use, systolic blood pressure, diastolic blood pressure, fasting blood sugar level, cholesterol level, and intracranial volume (ICV).
bUnderweight (BMI <18.5 kg/m2), normal weight (BMI 18.5–22.9 kg/m2), overweight (BMI 23.0–24.9 kg/m2), mild obesity (BMI 25.0–27.4 kg/m2), and moderate to severe obesity (BMI ≥27.5 kg/m2).
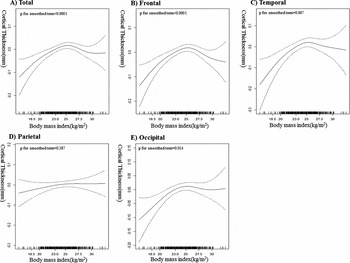
In generalized additive model after adjusting for potential confounders, we found an inverted U-shaped relationship between BMI and cortical thickness in each brain region, with the exception of the parietal lobe among men (Figure 1). Among women, the non-linear relationships between BMI and cortical thickness in each brain region were not statistically significant.
Non-linear relationship between body mass index and cortical thickness in men. The generalized additive model included a smoothed function of age and smooth functions of body mass index, education level, hypertension, diabetes mellitus, hyperlipidemia, previous stroke, cardiovascular disease, smoking status, alcohol use, systolic blood pressure, diastolic blood pressure, fasting blood sugar, total serum cholesterol, and intracranial volume were included.

Discussion
In this study, we hypothesized that the association between BMI and brain atrophy is non-linear with both underweight and severely obese individuals at higher risk of brain atrophy. However, we found that, relative to male normal weight participants, underweight male participants had lower cortical thicknesses, while overweight and mildly obese male participants had greater cortical thicknesses. Our findings suggest that underweight status might be an important risk factor for pathological changes in the brain, while overweight or mild obesity status is associated with increased cortical thickness in cognitively normal men. Among women, the differences in cortical thickness across BMI categories were small and not statistically significant.
Contrary to previous studies (Gustafson et al., Reference Gustafson, Lissner, Bengtsson, Bjorkelund and Skoog2004; Ward et al., Reference Ward, Carlsson, Trivedi, Sager and Johnson2005; Taki et al., Reference Taki2008; Raji et al., Reference Raji2010), we found an inverse relationship between underweight status and cortical thickness in men. Although relatively few participants in our study were underweight, the association was evident both in categorical analyses and in non-linear regression analyses. Our findings are consistent with a few neuroimaging studies (Burns et al., Reference Burns, Johnson, Watts, Swerdlow and Brooks2010) and with previous epidemiological studies, which showed that underweight status was associated with an increased risk of cognitive decline or of developing dementia (Buchman et al., Reference Buchman, Wilson, Bienias, Shah, Evans and Bennett2005; Atti et al., Reference Atti, Palmer, Volpato, Winblad, De Ronchi and Fratiglioni2008; Burns et al., Reference Burns, Johnson, Watts, Swerdlow and Brooks2010; Anstey et al., Reference Anstey, Cherbuin, Budge and Young2011).
Several underlying mechanisms may explain the association between low BMI and brain atrophy that we found in men. First, weight loss or low BMI might reflect early Alzheimer's disease (AD) changes. That is, AD could initially affect the medial temporal region (Braak and Braak, Reference Braak and Braak1997) responsible for appetite or feeding behaviors, as well as memory (Macchi, Reference Macchi, Squire and Gainotti1989). Previous studies have shown that weight loss precedes the development of AD dementia by several years. Indeed, pathology studies have reported that a lower BMI is associated with greater prevalence of AD pathological findings in cognitively normal individuals (Buchman et al., Reference Buchman, Schneider, Wilson, Bienias and Bennett2006; Vidoni et al., Reference Vidoni, Townley, Honea and Burns2011). Second, low BMI may reflect a state of malnutrition for essential brain nutrients, such as vitamin B6, vitamin B12, vitamin C, vitamin E, β-carotene, and folate, which may lead to cerebrovascular disease (Boushey et al., Reference Boushey, Beresford, Omenn and Motulsky1995; Gonzalez-Gross et al., Reference Gonzalez-Gross, Marcos and Pietrzik2001) and AD changes (Thomas et al., Reference Thomas, Thomas, McLendon, Sutton and Mullan1996) through increased oxidative stress (Thomas et al., Reference Thomas, Thomas, McLendon, Sutton and Mullan1996). Subjects with cardiovascular disease or AD tend to have lower levels of these essential nutrients compared to normal individuals (Clarke et al., Reference Clarke, Smith, Jobst, Refsum, Sutton and Ueland1998; Gonzalez-Gross et al., Reference Gonzalez-Gross, Marcos and Pietrzik2001). Third, low BMI may be related to frailty that refers to a general health status characterized by increased vulnerability to stressors because of impairment in physiological reserve. A recent study showed that frailty was associated with incident dementia (Gray et al., Reference Gray2013). Finally, weight loss may affect brain atrophy through metabolic, inflammatory, and hormonal changes. Indeed, a low BMI may increase IL-6, TNF-α, and cortisol levels and consequently contribute to the development of several neuropathologies (Singh and Guthikonda, Reference Singh and Guthikonda1997), brain atrophy (de Leon et al., Reference de Leon1988), and cognitive impairment (Weiner et al., Reference Weiner, Vobach, Olsson, Svetlik and Risser1997).
In the present study, there were no significant differences in cortical thickness between men of normal weight and those with moderate to severe obesity, although non-linear regression analysis showed a trend for an inverse relationship between severe obesity and cortical thickness. Our findings are partially inconsistent with prior volumetric studies showing that a high BMI is associated with global volume loss (Gustafson et al., Reference Gustafson, Lissner, Bengtsson, Bjorkelund and Skoog2004; Ward et al., Reference Ward, Carlsson, Trivedi, Sager and Johnson2005; Taki et al., Reference Taki2008; Raji et al., Reference Raji2010). The discrepancies between our study and previous studies may be explained by the small number of severely obese participants in our study that may have limited our ability to assess the association between severe obesity and cortical thickness.
We also found that overweight or mild obesity was associated with increased cortical thickness among men, even in cognitively normal participants. Given that cortical thickness is an important biomarker predicting dementia (Jack et al., Reference Jack2010), our conclusion challenges the prevailing concept that overweight or mild obesity might be an important risk factor for dementia (Gustafson et al., Reference Gustafson, Rothenberg, Blennow, Steen and Skoog2003; Anstey et al., Reference Anstey, Cherbuin, Budge and Young2011). Previous studies based on patients with AD dementia have shown inconsistent results. On the one hand, overweight individuals or those with mild obesity had brain atrophy (Gustafson, Reference Gustafson2006; Lavie et al., Reference Lavie, Milani and Ventura2009). On the other hand, overweight individuals or those with mild obesity had greater brain volumes than those of normal weight (Atti et al., Reference Atti, Palmer, Volpato, Winblad, De Ronchi and Fratiglioni2008). To our knowledge, this is the first study showing that overweight or mild obesity status was positively associated with cortical thickness among men, even in cognitively normal participants. In fact, we hypothesized that obese men had cortical thinning compared to normal weight because of several reasons. First, obesity might cause cortical atrophy through the development of vascular risk factors. Second, the amount of adipose tissue in the body can modify the metabolism of beta-amyloid, increasing the risk for Alzheimer disease (AD). Previous studies suggested that obesity was associated with decreased leptin (Greco et al., Reference Greco, Sarkar, Johnston and Tezapsidis2009) and increased inflammatory markers such as interleukin-6 (IL-6) and tumor necrosis factor-alpha (TNF-α) (Uslu et al., Reference Uslu2012). These markers are also reported to be associated with regulation of amyloid plaques (Greco et al., Reference Greco, Sarkar, Johnston and Tezapsidis2009; Uslu et al., Reference Uslu2012).
There is controversy on the contribution of overweight or mild obesity to shorter life span (Kim et al., Reference Kim, Lee, Jung, Yu, Lee and Roh2012; Azimi et al., Reference Azimi2013), and a recent meta-analysis has shown that overweight status was associated with the lowest risk of all-cause mortality in general populations. A previous study showed that AD biomarkers were inversely correlated with BMI in cognitively normal individuals (Vidoni et al., Reference Vidoni, Townley, Honea and Burns2011), while another study showed that BMI was positively correlated with mesial temporal cortex volume in patients with AD, with participants having a BMI >25 having the highest mesial temporal cortex volumes. Additional epidemiological studies suggest that overweight and obesity, especially in late life, are associated with lower dementia risk (Atti et al., Reference Atti, Palmer, Volpato, Winblad, De Ronchi and Fratiglioni2008).
The mechanisms by which overweight or mild obesity might be positively associated with cortical thickness, even in cognitively normal men, remain to be elucidated. Obesity is a strong factor for hypertension, diabetes, and metabolic syndrome (Lavie et al., Reference Lavie, Milani and Ventura2009). Therefore, obese individuals may tend to access healthcare earlier and benefit from preventive treatments (Azimi et al., Reference Azimi2013). Second, since BMI is an imperfect measure of underlying obesity, a BMI in overweight and mildly obese individuals may reflect increased muscle mass, which is associated with better fitness and exercise capacity, improvement in metabolic profiles, and probably increased cortical thickness (Goldberg et al., Reference Goldberg, Busby-Whitehead, Katzel, Krauss, Lumpkin and Hagberg2000; O’Donovan et al., Reference O’Donovan2005). Third, peripheral adiposity might be beneficial for cortical thickness through the secretion of adiponectin, which has anti-inflammatory, insulin-sensitizing, and anti-atherogenic effects (Schenkeveld et al., Reference Schenkeveld2012), or via leptin, which increases hippocampal plasticity (Harvey et al., Reference Harvey, Solovyova and Irving2006) and inhibits cell death (Morrison, Reference Morrison2009). Indeed, a previous study showed that AD patients had lower adiponectin levels than normal controls, and low adiponectin levels are associated with cognitive impairment (Teixeira et al., Reference Teixeira2013). Finally, the greater metabolic reservoir of obese individuals may overcome the increased energy needs of catastrophic events (frailty or preclinical stage of dementia), whereas underweight or normal weight individuals may more quickly exhaust readily available energy reservoirs (Kim et al., Reference Kim, Lee, Jung, Yu, Lee and Roh2012). Due to the cross-sectional nature of our study, we could not distinguish among these different mechanisms.
We did not find a significant relationship between BMI and cortical thickness in women. A Japanese study also showed that there were global losses and regional alterations in gray matter volume only in obese men (Taki et al., Reference Taki2008). Even though the reason for the gender difference is unclear, several mechanisms may be involved in these BMI-related abnormalities in brain morphology. The gender differences in the relationship between obesity and cortical thinning might be due to the different distribution of fat according to gender. Males have been reported to have a higher portion of visceral fat than females (Enzi et al., Reference Enzi, Gasparo, Biondetti, Fiore, Semisa and Zurlo1986; Kotani et al., Reference Kotani1994). Visceral fat is associated more with metabolic syndrome than is subcutaneous fat (Kopelman, Reference Kopelman2000), which is associated with cortical thinning. Thus, cortical thinning in male subjects is related to obesity. On the contrary, the gender effect on the relationship between underweight and cortical thinning might be due to the differences in hormonal changes. Both estrogen and testosterone have neuroprotective functions (Amantea et al., Reference Amantea, Russo, Bagetta and Corasaniti2005; Hogervorst et al., Reference Hogervorst, Bandelow and Moffat2005) regulating IL-6 (Girasole et al., Reference Girasole1992; Maggio et al., Reference Maggio2005) and oxidative damage (Behl et al., Reference Behl1997) that are mediators between underweight and cortical thinning. With age, testosterone in men and estrogen in women decreased, but adipose tissue and skin in female release estrogen (Simpson et al., Reference Simpson1994). In contrast, there is no substitution of lack of testosterone in male subjects. Thus, the cortical thinning in male subjects is also susceptible to underweight. Finally, it might be related to sex differences in the distribution of smoking and alcohol consumption, although these factors were adjusted in the analyses.
The strengths of our study included the large sample size, the use of high-quality methods to acquire and process cortical thickness measurements, and the availability of a wide panel of clinical and laboratory parameters on study participants derived from the health screening exams.
Several limitations, however, also need to be considered. First, while we could establish a relationship between BMI and cortical thickness in men, it was impossible to establish causation due to the cross-sectional nature of our study. Specifically, we could not discard reverse causation, even though we adjusted for underlying illnesses that predispose to cortical thinning. Prospective studies with repeated measures of BMI and cortical thickness are needed to better understand this association. Second, although BMI is an easy-to-use and popular measure of adiposity, it does not differentiate between body fat and lean mass, and may be an imperfect marker of adiposity particularly in elderly participants. Further studies using more detailed measures of adiposity are needed to confirm our results. Third, we utilized BMI criteria for residents of the Asian Pacific region (WHO Expert Consultation, 2004). Because the BMI distribution in our study population is lower than that in Western populations, direct comparison of our result with other studies is complicated. Fourth, the number of subjects with underweight was small. Therefore, the effects of underweight on cortical thinning should be cautiously interpretated. Finally, our subjects were recruited from participants in a comprehensive preventive health exam not covered by national medical insurance. Our participants were cognitively normal but interested in dementia prevention, and this may also limit the generalizability of this study to other populations.
In spite of these limitations, our findings indicate that BMI may be associated with cortical thickness in men, with underweight participants having lower cortical thickness and with overweight and moderately obese participants having higher cortical thickness compared to normal weight participants. These findings, and the implications of this association for the development of cognitive decline and dementia, need to be confirmed in large longitudinal studies including repeated measures of adiposity and of cortical thickness.
Conflict of interest
None
Description of authors’ roles
H. Kim conducted the initial analyses and wrote the initial draft. S.K. Cho, S. Jeon, and J.-M. Lee conducted the critical analysis. S.W. Seo and C. Kim strengthened the organization of the papers and the interpretation of findings. D.L. Na, H.J. Kim, G.H. Kim, H. Cho, B.S. Ye, Y. Noh, C.W. Yoon, and E. Guallar gave critical revision of the manuscript for important intellectual content. M. Kang, H.-Y. Shin, S. Park, J. Lee, and J. W. Hwang helped to collect data. All authors approved the final version of the paper to be published.
Supplementary material
To view supplementary material for this article, please visit http://dx.doi.org/10.1017/S1041610214001744.
Acknowledgments
This study was supported by the Basic Research Program through the National Research Foundation of Korea (NRF) funded by the Ministry of Education (NRF-2013R1A1A2065365), by the Korean Healthcare Technology R&D Project Ministry for Health & Welfare Affairs (HI10C2020 & HIC120713), by the KOSEF NRL program grant (MEST; 2011-0028333), by the Samsung Medical Center (CRL-108011&CRS110-14-1), and by the Converging Research Center Program through the Ministry of Science, ICT and Future Planning, South Korea (2013K000338).