1. Introduction
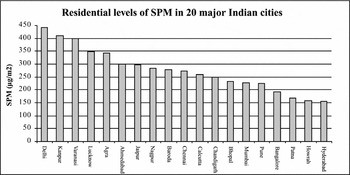
Air quality in urban India has deteriorated rapidly over the last few years. Particulate matter in air has reached an alarming high. A study by USAID in 2001 found that in “14 of India's 20 largest cities, citizens breathe air the government deems ‘dangerous’. Six cities endure levels of airborne particulates at least three times the World Health Organization (WHO) standards. A thriving industrial base and rapid economic growth – about 5 per cent a year – account for much of the severe pollution, which costs India an estimated $9.7 billion a year in environmental damage” (USAID, 2001: 1). The ambient levels of Suspended Particulate Matter (SPM) in most of the urban areas are above 150 μg/m3, which far exceeds the WHO ambient standards of 50 μg/m3 (CPCB, 2000b). WHO has set more stringent standards for India than those for other countries. Figure 1 shows that all the major cities emit SPM above the limits set by WHO. The capital city of India, Delhi, has SPM levels about eight times the standard set by the WHO. Even the least-polluting city has SPM levels at three times the standard set by the WHO.
SPM levels of the major cities in India

Coal-based thermal power plants are considered to be one of the chief industrial emitters of SPM in India. The thermal power plants use a low-grade coal, which is high in ash. High-ash coal has low Useful Heat Value (UHV), hence it is required in large quantity to produce a fixed level of output. This burning of high-ash coal produces large amounts of particulate matter. Electro-static Precipitators (ESPs) along with a baghouse are considered to be globally accepted technologies to abate the emissions of particulate matter. The Central Pollution Control Board (CPCB) in India mandates that the Indian coal-based power plants have ESPs installed. However, the low sulfur content of the coal, along with the abrasive nature of the high-ash domestic coal, results in low performance levels of these ESPs. Low performance leads to a dynamic process of environmental degradation.
The World Bank is funding various research studies to evaluate the efficacy of installing baghouses as alternatives to ESPs to control pollution in the power plants. A baghouse, which is even more expensive than an ESP, is not sensitive to the ash content of the coal. In this study we explore other options available to the power plants to abate the emissions of particulate matter, other than just merely substituting a baghouse for an ESP.
Given this backdrop, the objective of this paper is to find the optimal switching points for power plants to switch to a cost-effective technology to abate particulate emissions. The question asked is what type of policies will induce the power plants to invest in a high-efficiency boiler or invest in pollution-control equipment or switch to low-ash coal, over the next 40 year period. A comparison of policies will give us the optimal point to switch to the cost-efficient technology. Given the heterogeneity of each power plant, the date of adoption will be different for different power plants. The plants shift to the most energy-efficient technology such that they can reduce emissions to the standard set by the WHO.
In this paper we construct an optimal switching point model that considers the dynamic process of installing another cost-efficient technology to reduce particulate emissions over a period of 40 years, and the policy that will induce the power plants to adopt it. Regulation in the form of an emissions standard, an emissions tax, an ash tax, or a coal tax provides an incentive for the power plants to abate. We have simulated various tax rates to determine the dates when the plants will shift to low-ash coal as each plant has a unique pattern of coal usage. In order to investigate the policy issues above, we need to keep in mind the following points. First, the analysis is undertaken at the firm level. As it is difficult to obtain ambient air quality at the firm level, we use an emissions standard. Our sample has power plants located either in the major cities or very close to major urban cities where the air quality is very poor. As plants are heterogeneous, the abatement structure will be different for all plants.
There have been few studies on the carbon emissions of the Indian power plants. Khanna and Zilberman (Reference Khanna and Zilberman1999a,Reference Khanna and Zilbermanb, Reference Khanna and Zilberman2001) studied the adoption of energy-efficient technologies in power plants in India as a means to reduce carbon emissions. They analyzed alternative policy measures designed to induce firms to adopt these technologies. Their application was on the coal-based electricity-generating sector in India, where existing policy distortions are hindering the adoption of energy-efficient technologies, which in turn has increased carbon emissions from the power sector. They concluded that introducing washed coal and eliminating the tariff on imported coal would reduce emissions by 6 per cent and increase output (power) by 9 per cent. They suggested a range of incentive-based policy instruments for abating emissions other than an emissions tax, which is the existing policy for emission control. This is an important conclusion, especially for a developing country such as India, where control of emissions cannot feasibly be done by curtailing production of electricity or by spending scarce capital resources on expensive advanced technologies. We have used alternative forms of taxation to study the best policy instrument available to the policy makers to abate particulate emissions.
In an article about the nexus between carbon emissions and thermal power (Bhattacharya, Reference Bhattacharya1994), the author agrees that there is a wide variation among thermal power units in terms of pollution generation. However, generally power plants with inefficient units that employ old technologies of coal combustion and power generation are the ones that emit the most. As efficiency depends on the heat cycle used, modifying the boiler can lead to improvement. To improve environmental performance, the other option suggested by the author is substituting other low carbon fuels for coal or using washed coal. Smouse et al. (Reference Smouse, Peters, Reed and Krishnan1994) have argued that coal cleaning can solve the technological and environmental problems of thermal power plants.
There have also been a number of papers that have dealt with optimal time for investment in pollution abatement. The option value of work model (Stock and Wise, Reference Stock and Wise1990) was used as the basic framework in the optimal switching point model for the power plants in this study. Stock and Wise's paper deals with the decisions of the older employees, whose options are either to continue to work or to retire. The option value approach is often used in environmental economics dealing with pollution control. This paper, using a similar framework, studies the choices of power plants to continue operating the technology they have or to adopt a better pollution control technology. Conrad (Reference Conrad1997) studied the optimal timing of policies which would help stop global warming. He used the option value or stopping rule model to calculate the damage to the environment and the policies to be adopted to clean the air. Huhtala and Laukkanen (Reference Huhtala and Laukkanen2004) determined the conditions under which an investment in wastewater treatment can take place and what would be the optimal time to invest. They showed how environmental damage affects the optimal timing of investment. They used an optimal control model in a dynamic framework to determine how resources should be allocated to control pollution. Khanna et al. (Reference Khanna, Isik and Winter-Nelson2000) studied the implications of investment in farms on nitrogen pollution control and environmental policy. Fischer et al. (Reference Fischer, Withagen and Toman2004) considered the investment in cleaner technologies over time to mitigate the dynamic process of environmental degradation. The key question in their debate, similar to this paper, is the optimal timing of investment in cleaner technologies. They focused on the optimal path of various taxation policies and the socially efficient technology transitions.
In this study the socially efficient options are given by the emissions standards. Incorporating different rates of tax helps us determine the switching point of the plants for these optimal choices. We focus on the simulated tax rates and how they affect the switching points for these technologies. Section 2 describes the optimal switching point model. Section 3 describes the data and the estimation procedure. Section 4 shows the policy runs, describing in detail the emissions standard, an emissions tax, an ash tax, and a coal tax for a representative firm and then aggregates the results across 40 firms. Section 5 concludes with policy recommendations.
2. Model specification
In this study we consider an optimal switching point model. At present the power plants operate on a low-efficiency boiler with an installed ESP as the pollution control equipment. In this section we model the different options available to the plants and the policies that will induce them to adopt the energy-efficient technology. We first explore the options available, then we use a linear programming model to factor in the options.
The plants can either (a) keep operating with the low-efficiency boiler and an ESP, as is the current scenario, or they can (b) switch to a baghouse from an ESP keeping the low-efficiency boiler, or (c) switch to a high-efficiency boiler keeping the ESP, or (d) switch to both a high-efficiency boiler and a baghouse. The model considers the least-cost way of switching options.
The model is a double cost-minimization problem where the plants switch to the cost-efficient technology over a period of the next 40 years. Our time period (t) is defined between 2003 and 2042. So first we define the usual constraints required for cost minimization. Then we fit those constraints to our objective function, where the solution gives us the optimal switching dates for each plant.
Production Constraint: In our model the output is given by ȳ measured in kilowatt-hours per day, which is fixed over time. Generation of electricity requires a variable input coal (x i), given in kilowatt-hours per ton. Each plant has a choice of four types of coal, where i = domestic (d), washed (w), imported (m) or blended coal. The generation efficiency for boilers is given by effj, where j = l for the existing low-efficiency technology and j = h for the high-efficiency boilers. The plants are heterogeneous in their existing generation efficiency and their installed capacity. βij represents the electricity per unit of coal types i for a given type of boiler j. βil is given for each plant. βih is then calculated using the relative efficiencies. If we let  , then βih = βil * r.
The boilers depreciate over the years depending on the types of coal used. The boilers depreciate at a faster rate if they use high-ash domestic coal than if they use washed or imported coal. The depreciation rate of the boilers is given by zi(t), which is time dependent. The existing boilers had a starting efficiency of 36 per cent. As the power plants differ in age, each plant in 2003 has a different efficiency level. If the existing boilers operate at eff l in the year 2003, given that they use only domestic coal with an ash content ad, then the depreciation rate is calculated as
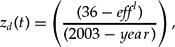
where year is the year of establishment. The parametric values for eff l and eff h for a representative firm are given in table 1. If they use washed coal, the depreciation rate is given by,  . The depreciation rate of boilers using imported coal is given by
 .
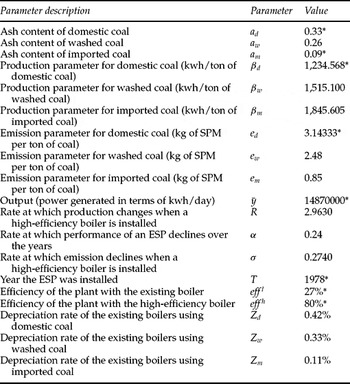
Plant-specific parametric values for a representative firm (Badarpur)

Note: *Denotes published data.
Let ī be the optimal switching time for the plants to go for a high-efficiency boiler, given 2003 ≤ ī ≤ 2042. Therefore for a low-efficiency boiler the production constraints are Σi βil *(1 − { ī − 2003} z i (t))x i (t) ≥ ȳ. Similarly, for a high-efficiency boiler the production constraint is rΣiz i βih *(1 − { t − ī} z i (t))x i (t) ≥ ȳ, where 2003 ≤ t ≤ 2042. The depreciation parameter and the coal choices depend upon the year of operation, t.
Ash constraint
The optimal switching point is also constrained by the burning capacity of the low-efficiency boilers. The firms have an option to use different types of coal with varied ash content. However, blending is constrained by the existing boilers used by the thermal power plants. These boilers were generally built to burn coal with an ash content of 30 per cent. So, we introduce an ash constraint into our model. Let ai be the ash content of the coal type i. As am< aw< ad, imported coal is of the highest quality. The ash constraint ensures that the ash content of the blended, washed, or imported coal does not exceed 30 per cent. The grade E and F domestic coal used in the Indian coal-based power plants has ash content greater than 30 per cent. The ash constraint is only required when the low-efficiency boilers are used with the blended coal. We can thus write the ash constraint as Σia ix i ≥ 0.3 Σix i.
The optimal switching date depends upon the age of the power plants. Older power plants produce particulate emissions at a higher rate. The particulate emissions in turn depend upon the ash content of the coal, boiler types, and the type of pollution control equipment installed.
Emission constraint
Let  be the optimal switching time for the plants to shift to a baghouse, given
 . ρ is the yearly rate of depreciation for an ESP and zj is the yearly rate of depreciation for a j type boiler. The use of low-ash coal, high-efficiency boilers and/or well-maintained pollution control equipment by a power plant, lowers the emissions per unit of coal and shifts the switching point to a later date. Let e ji(t), given in kilogram per ton, denote the particulate emissions generated daily by a plant using coal quality i with a j type of boiler in the time period t. The base case emission per unit of domestic coal is given for a plant with a low-efficiency boiler and an installed ESP. e li(t) is the amount emitted when efficiency of the boiler is eff l. However, only 80 per cent of the total ash generated is carried with the flue gas to the stack to be emitted (Central Pollution Control Board, 2000a). Therefore, for every ton of coal fed into the boiler with a i ash content, only eff l per cent is used to produce electricity and the remaining (1 − eff l) per cent becomes ash, out of which 80 per cent goes to the stack to be emitted. Hence particulate matter that goes out to the stacks to be emitted per ton of coal from the low-efficiency boiler is a i * (1 − eff l) * 0.8. Likewise, emissions from the high-efficiency boiler would be a i * (1 − eff h) * 0.8. There are two reasons for the lower emissions. First, the new boilers have high-efficiency and thus require less coal per unit of output. Second, these boilers can burn low-ash, high UHV coal. The above relationships imply that, if
 , then e ih (t) = e il (t) * σ.The emissions for a low-efficiency boiler with an ESP installed can thus be written as Σie i (t) * { 1 + (ī − 2003)ρ } x i and Σie i (t)* σ { 1 + (t − 2003)ρ } x i for a high-efficiency boiler with an ESP.
If the plants choose to install pollution control equipment, they have to choose between an ESP and a baghouse. The base-case emission is given by eli(t). Let eespi(t)(=eli(t)) denote present emissions with an already installed ESP and let ebhi(t) denote emissions with a baghouse installed. ESPs are designed to work at 99.9 per cent efficiency. However, the problem with an ESP is that with the low sulfur content of the Indian coal, the performance of the ESP declines over the years if it is not maintained properly. On the other hand, performance of the baghouse is not sensitive to the sulfur content of the coal. Therefore over the years its efficiency is not affected. Assuming that the performance of the ESP declines over the years at a rate ρ each year, then 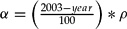 , where (1−α) is the rate of efficiency of an ESP. The current year is 2003 and year is the year of installation of an ESP. Therefore (2003-year) denotes the age of an ESP. On the other hand, baghouses perform at 99 per cent efficiency continually. Hence,
 , which implies
 , where
 .
If a baghouse is installed, then emissions (E) depends on the type of boiler in use. For low-efficiency boilers, emissions are  . For high-efficiency boilers, emissions are
 .
Emissions vary from plant to plant, since they depend upon each plant's type of coal, the total amount of coal used, and the efficiency of the boilers. Therefore the switching point varies from plant to plant. The plants are price takers in the input market. The price per ton of coal denoted by pi is given exogenously. The prices of the different coal types reflect their relative qualities. As imported coal is of the highest quality, pm > pw > pd.
Objective function
We now consider the decision-making process of each plant. Each plant chooses its coal quantity, its boiler type, and its pollution control equipment, all over a period of 40 years. As required by the Central Pollution Control Board, India, all power plants already have an ESP installed. Therefore the cost of installing an ESP is a sunk cost. The plants have to incur an additional fixed cost, BC, to install the high-efficiency boilers. They also have to incur a fixed cost of FCbh if a baghouse is installed. Both these fixed costs are amortized.
Cjk(t) defines the minimum cost of power generation at time t when the power plant uses j kind of boiler with k type of pollution control equipment, where k= ESP or baghouse. The model below gives the optimal switching point for both a high-efficiency boiler and a baghouse. This is the basic model used for the study. The problem is set up in a way such that at any point in time, any of the options are available to the power plants. There are four different options available along with the choice of low-ash coal. They are low-efficiency boiler with an ESP, with a baghouse and the same options with a high-efficiency boiler. The options over which cost is minimized are given by Clesp(t), Clbh(t), Chesp(t), and Chbh(t).
The model is described with an emissions standard. The same model is used for various policy runs by varying the policy type. For example instead of an emissions standard, we can have an emissions tax. The first cost minimization is over each technological option, i.e. Clesp(t), Clbh(t), Chesp(t), and Chbh(t) respectively, where the decision variables are the coal choices. The second cost minimization is done over the time periods across technological options, where the choice variables are the optimal switching points.
Given a period of 40 years, the optimal switching point model is used to find the optimal point for the power plants to shift to low-ash coal, high-efficiency boiler, or a baghouse in the least-cost way. The decision variables are xi,  , and ī. The plant chooses the coal type and the optimal times to switch technologies. As the power plants differ in age, efficiency and size and the choice variables are plant dependent, the decision variables are also age, efficiency, and size dependent.
The model describes the constraints and the choices in detail when the policy in question is an emissions tax. As noted above, a basic model of cost minimization is used in this study. The constraints include a production constraint, an ash constraint, and an emissions equation or an emissions constraint.
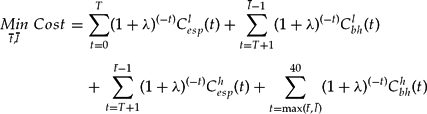
where
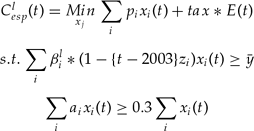
and
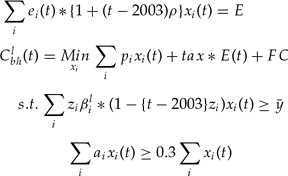
and
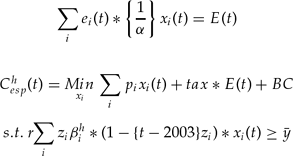
and

where:
λ = discount rate;
 = switching point for baghouse;
- = switching point for boilers
T = the last year that power plant operates on the low – efficiency boiler and ESP
E = total emissions
We can also have a regulation in the form of an emissions standard. The other forms of regulation considered include a tax on the ash content of the coal (τ a ix i) or a tax on the total amount of coal used (τ x i). The imposition of regulation is intended to create an incentive for the plants to adopt a cost-efficient and emission-reducing technology. The aggregate impact of regulation can be determined by aggregating the effect of these policies across plants. By varying the tax rate or the emissions standard, we can get different optimal switching points for the plants.
3. Data and estimation procedure
Environmental data are scarce, especially for India. Therefore, the major hurdle in undertaking an empirical study on industrial pollution control in India is the unavailability of emission data. The key to finding the optimal switching point for technologies was to construct a data set that could be used to apply the choice problem as described. The empirical analysis in this paper is based on 40 coal-based power plants. Plant-specific data were required in order to run the linear programming model. The linear programming runs were made using the GAMS software. A study by Mittal and Sharma (Reference Mittal and Sharma2001) in association with the Ohio Super Computer (OSC) Center has a database with some data on Indian coal-based power plants, including their coal usage and power generation in terms of kilowatt-hours per day and also their daily emissions from coal burning for the base case only. The published data also include installed capacity. Plant-specific data for the coal grade and the ash content of each of these are also given, along with their efficiency levels.
The Indian power sector depends heavily on domestic coal of grade E/F, whose Useful Heating Value (UHV) range is around 2400–4200 kcal/kg, with an average of 3000 kcal/kg. TERI (TEDDY, 2000) publishes a yearbook which includes the prices of domestic coal, washed coal, and imported coal. Data on various grades of Indian coal, washed coal, and imported coal, their ash content along with their UHV, are available from the CPCB (2000a) newsletter Parivesh. Based on these reports the heating value of imported coal is at 6500 kcal/kg and its price is given as $38 per ton. Domestic coal, on the other hand, costs only $12 per ton. Coal washing reduces ash by 7–8 per cent and removes the sulfur from the coal. Washed coal costs about $20. The price data for equipment are available from the World Bank's Handbook on Pollution Prevention and Abatement and from the IEA (2000), which has information on the price of electrostatic precipitators, baghouse filters, and high-efficiency boilers. OSC also has data on coal per unit of electricity, which can be used to calculate electricity per unit of coal, which is relevant for this study. As for the data, they only publish the data on SPM emission for the base case, which is a low-efficiency boiler with an installed ESP. Therefore the entire data set had to be built upon the base case. CPCB (2000b) also publishes data on the ambient SPM standards that the industries have to meet.
The data on the generation efficiency level of operation along with the UHV of each type of coal are used to calculate the parameter estimates of electricity per unit of coal and the emission per unit for each coal type. The above data, along with the data on the efficiency of the new boilers, are used to calculate the production and the emission parameters for the high-efficiency boilers.
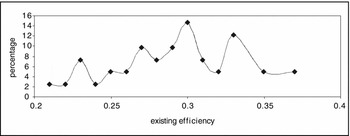
The power plants differ considerably in their age, installed capacity, and plant efficiency. The age of these plants varies between 1 and 37 years, with the average age being 15.16 years; 24 per cent of these plants are over 20 years old and 10 per cent of these are less than five years old. Their size varies between 30 and 2340 MW and their generation also varies considerably. The heterogeneity in their efficiency is shown in figure 2. The most-efficient power plant operates at 37 per cent efficiency. Approximately 50 per cent of these plants operate below 30 per cent efficiency. Given these varied efficiencies, the cost-effective decisions regarding coal quality and technology choice will vary. Figure 2 describes their heterogeneity.
Frequency distribution of plant efficiency of the power plants

4. Policy runs
In the following section we describe the plant level results for a representative plant (Badarpur). This medium-sized plant was established in 1978. Being such an old plant, the plant efficiency is only 27 per cent. It is located about 12.5 miles from the capital city of New Delhi. Hence, emissions from this plant adversely affect the air quality of the capital city. For instance, the particulate levels of New Delhi are found to be at critical levels by the National Ambient Air Quality Monitoring (NAAQM) station. For example, most of the major cities in India have concentrations of particulate matter that are three times the WHO standards (figure 1). Let us assume for simplicity's sake that these plants should reduce emissions by at least two-thirds of their total emissions. We do various policy runs in order to achieve an emission reduction of at least 66 per cent and higher.
The optimal switching point model is used to calculate the cost of an emissions standard or tax policy for a sample firm. Table 1 describes the parametric values for the sample firm on the basis of which the runs are done.
Linear programming techniques are used to find the optimal time to invest in the boiler or new pollution control equipment such as a baghouse. For each of these technological choices, the plant also chooses from alternative types of coal. The plant can use: high-ash (i) domestic coal, or low-ash (ii) washed coal, or (iii) imported coal, or (iv) a blend of low-ash and high-ash coal. The model as described above is linear. A simple linear programming model is used to find the optimal switching points. The runs are done using the GAMS program. As SPM is a local pollutant, a typical plant-level cost minimization is undertaken for a period of 40 years.
Emissions standard
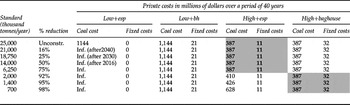
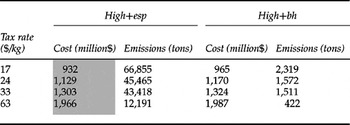
We now consider the imposition of an emissions standard, where we let the stringency of the standard (ē) vary. The emission (ē) is given in terms of tonnes per year. Table 2 describes the results with varying emissions standards. Unconstrained emission levels of the power plants are at about 25,000 tonnes a year. The results from the runs show that even at this unconstrained level of emissions when no policy is in place, it is still cost efficient to use a high-efficiency boiler and an ESP. It is always the cheapest option when the emissions standards are quite lax. However, when the standard becomes very stringent the option of a high-efficiency boiler with a baghouse becomes the cheapest option. Imposing an emissions standard causes the firm to switch to a high-efficiency boiler immediately. Therefore the optimal switching point model shows that the optimal time to switch to a boiler is immediate.
Emissions standard

Note: Inf-infeasible option. The shaded numbers indicate least-cost option.
Given the production constraint, in order to generate a certain level of electricity, a high-efficiency boiler will consume the same amount and type of coal irrespective of the pollution control equipment installed. Similarly, for a low-efficiency boiler, coal consumption is the same irrespective of pollution control equipment. Plants with low-efficiency boilers generally use domestic coal. If the emissions standard is very high, the plants using low-efficiency boilers shift to washed coal or a blend of low-ash and high-ash coal. Low-efficiency boilers cannot burn low-ash washed or imported coal because by design they can only burn coal with at least 30 per cent ash content. On the other hand plants using high-efficiency boilers are not constrained by the ash content of the coal. Therefore, they can use low-ash coal when the standards become stringent. In any case, both the coal type and amount of coal used is the same, depending on the boiler type, irrespective of whether the plant has an ESP or a baghouse installed. Hence the coal cost for boilers of similar efficiency is the same at given levels of emissions.
It can be easily seen from table 2 that the choice of pollution control equipment depends on whether the emission constraints are binding or not. Here the social costs are the addition of production costs and the fixed costs of equipment and/or boiler. The production costs include input costs, which are the coal costs. The plants choose low-ash coal to abate particulate emissions.
In the beginning when the standard is very low and the emissions constraint is not binding, the least-cost option is the high-efficiency boiler with an ESP as the pollution control equipment. As the emissions standard becomes binding, the plants gradually shift from high-ash domestic coal to low-ash washed coal and eventually to imported coal in order to lower emissions. Therefore, the plants prefer using imported coal with an ash content of about 9 per cent when the emissions standard becomes very stringent. The switching point to low-ash coal varies from firm to firm. A standard, which requires an emission reduction, causes power plants to shift to high-efficiency boilers and install baghouses. The option consisting of a high-efficiency boiler and the ESP is the cheapest option till an emission reduction of 90 per cent, as shown in table 2.
Table 2 shows that as the standard becomes more stringent, the plants using low-efficiency boilers either have to shut down or shift to using high-efficiency boilers. In this policy choice, the optimal switching time for plants is almost immediate. As the power plants shift to high-efficiency boilers, emissions drop by at least 90 per cent immediately. The point to be emphasized here is the win–win nature of the investment in high-efficiency boilers.
The empirical evidence from the analysis shows that the low-efficiency boilers are never the cost-effective option, even when there is no regulation or tax policy in place. These existing boilers are old and hence require the burning of huge quantities of coal, which in turn leads to very high particulate emissions. The additional fixed costs of any other options are offset by the high coal costs. So, even without any regulation, the existing technology is very expensive. Therefore, we have considered the optimal switching point model where the first switch takes place for the boilers almost immediately and the next switch is for the choice of pollution control equipment. Again, these results are common for each plant in our sample. The only difference is the level of the emissions standard, which is binding for each plant. A binding emission constraint would always lead to the plants switching to a high-efficiency boiler and a baghouse. For the power generating industry as a whole, the old boilers existing today consume large amounts of high-ash domestic coal. The pollution control equipment in the form of an ESP also performs poorly. As a result the emission of particulate matter is above what is required to achieve the CPCB standard and much above the WHO standard.
Installing new pollution control equipment in the form of a baghouse, while keeping the low-efficiency boiler, would lead to an emission decrease of 96 per cent with a cost increase of 2 per cent. On the other hand, switching to a high-efficiency boiler while keeping the pollution control equipment the same, i.e. an ESP, there is not only an emission decrease of about 90 per cent, but also an additional cost decrease of about 65 per cent. The reason for a cost decrease with the installation of a high-efficiency boiler comes from lower coal usage. With an efficient boiler the plants cut down on their domestic coal usage. This reduction in costs due to lower coal usage is enough to offset any increase in costs due to installation of a higher-efficiency boiler. Therefore an immediate investment in a high-efficiency boiler is the most cost-efficient choice.
Therefore, it is important for the pollution control board to regulate the emissions such that the power plants immediately adopt the high-efficiency boiler. These boilers reduce coal usage to a great extent. This automatically reduces emissions. The baghouse is low maintenance and performance is not affected by the low sulfur content of the Indian coal.
One point to be noted here is that the pattern of abatement is done in discrete levels. This lumpiness comes from two factors. First it is because of the linearity of the model. Second, it is due to the limited number of available processes. The step-like changes are a result of the linear objective function and linear constraints. The above explanation is true for all the firms in the optimal switching point model.
The resulting choices from the emissions standards case give us socially efficient results. It shows that India benefits by switching to a new boiler immediately. The results from the runs using an emissions standard give us the least-cost way of investing in a new technology for meeting any particular emission reduction goal. The best way for the pollution control board to induce these choices for the industry is to impose a tax. Theoretically an emissions tax gives us the socially least-cost way of achieving given levels of emission reduction. Now we would like to see which tax policy can induce similar results, which are closest to the socially optimal choices. Keeping these goals as the benchmark, we analyze an emissions tax, an ash tax, and a coal tax.
Emissions tax
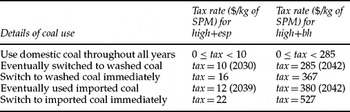
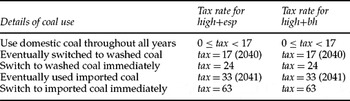
In this case the firms are taxed on their total emissions. Imposition of the emissions tax leads to gradual compliance, as opposed to an emissions standard, which leads to an immediate compliance. The linear programming runs are done on simulated tax rates to determine the optimal switching point and the pattern of coal usage for each of the options. In this case too, any positive tax rate causes the power plants to switch to the high-efficiency boiler immediately. However the switch to a baghouse from an ESP and the switch to low-ash coal depend on the tax rate. Table 3 describes the tax rates and the corresponding coal quality switches.
Coal usage under an emissions tax

Note: The numbers in parentheses indicate the year.
In the beginning, there is no change in the coal choices and the plant uses domestic coal till the tax rate of $9/kg. If the tax rate increases by a dollar, i.e. to $10/kg of emissions, the power plants abate by switching to low-ash coal. The firms abate by using low-ash washed coal from the year 2030 when the pollution control board charges a high tax rate of $10/kg. When tax rate equals $12/kg, the plant abates by using all washed coal till 2038 and then switches to all imported coal from 2039 onwards. It is only when the tax rate equals $16/kg that the power plants abate by switching to all washed coal immediately. They start using all imported coal immediately when the tax rate is $22/kg. Even though a tax rate of $12/kg of SPM is very high given the Indian scenario, any rate lower than that does not induce any abatement by the firms. Therefore, this high tax rate shows that power plants may switch to a high-efficiency boiler immediately but may not switch to low-ash coals or even a baghouse unless and until the tax rate is as high as $12/kg.
As the tax rate increases the plants abate emissions by using low-ash coal, which leads to lower emissions. Over a period of 40 years we can see that at a higher tax rate the plant will eventually switch to washed coal in the future in the year 2030. Tightening the tax rate causes the power plants to switch to better quality coal. An increase in the tax rate further causes the plant to switch to washed coal immediately from year 2003.
For the plants that have already switched to a baghouse, low emissions tax does not induce any pattern of abatement. This is because with an installed baghouse, emissions are already lower by nearly 90 per cent of their original emissions. Therefore, the tax payments are not high enough to affect the decision to abate by using a different coal type. At a very high tax rate of $285/kg, the plants first use washed coal in 2042. They keep shifting the optimal switching date earlier until a tax rate of $367 is imposed. This makes them switch to washed coal earlier. When the tax rate equals $380 the power plants first use imported coal in 2042 and they gradually shift to imported coal in 2003 at a tax rate of $527. This shows that plants can switch to any one of the options and reduce emissions to a large extent and thus have very low tax payments.
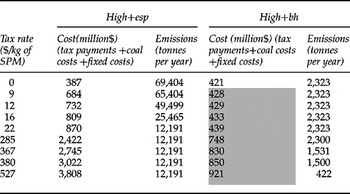
The important thing to note here is the least-cost option when an emissions tax is imposed. When the tax rate is positive, the least-cost option is the high-efficiency boiler and the ESP. As soon as any regulation or policy is in place – for example, any emissions tax above $9/kg – the cheapest option is the high-efficiency boiler and a baghouse. However, even when there is no policy in place, the high-efficiency boilers have the same coal usage, irrespective of the pollution control equipment. Therefore the coal costs are the same. The difference in costs lies in the fixed costs of the baghouse. Since an ESP's performance is declining over the years, the emission from an ESP is much higher than the emission from a baghouse. Therefore, with an emissions tax, the savings from the baghouse option more than offsets the fixed costs. Hence, with any tax rate above the $9 limit, the option with a baghouse is the cheaper option. However, the decrease in emissions by installing an expensive baghouse is not worth the effort, as installing a high-efficiency boiler reduces emissions by nearly 90 per cent for most of the power plants. Therefore any additional reduction has a marginal gain.
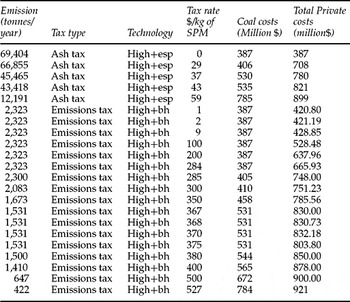
Table 4 shows the total private costs of the high-efficiency boilers at each level of tax. Private costs for firms equal the summation of coal costs, fixed costs, and the tax payments.
Total private costs under an emissions tax

Theoretically an emissions tax results in similar choices to an emissions standard. Empirically in this study an emissions tax also results in a similar abatement pattern as an emissions standard. However, the important difference here is the gradual compliance. A regulation in the form of a standard results in immediate compliance. The firms do make efficient choices under an emissions tax. In order to achieve certain fixed levels of emissions, the costs in the form of coal costs and fixed costs are the same for both the emissions standard and the emissions tax. The difference in costs lies in the tax payments. Therefore, in terms of social costs of abatement an emissions tax is as efficient as a standard. The only difference is in the optimal switching points.
With an emissions tax, firms gradually shift to low-ash coal as the tax increases, as opposed to a standard where compliance is immediate as the standard becomes stringent. The important point to note here is that we have considered higher tax rates to show that the option of switching to a baghouse is very expensive and the gains from pollution reduction are not that high when the plants have already switched to high-efficiency boilers. Next we consider the imposition of an ash tax.
Ash tax
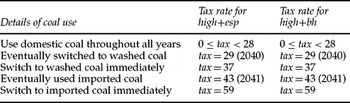
An ash tax is imposed on the ash content of the coal. Table 5 gives the details of the coal type used at simulated tax rates. At a tax rate of $29, the power plants using high-efficiency boilers shift to washed coal in 2040. They will adopt washed coal earlier as the tax rate increases. Plants will adopt washed coal immediately in 2003 when the tax rate is $37. Imported coal is first used in 2041 at a much higher rate of $43. It is only when the tax rate is $59 that the plants adopt imported coal in 2003. The important point to be noted here is that at any given tax rate the coal usage is the same for the high-efficiency boilers with an ESP or a baghouse, because boilers define coal usage. They are independent of the pollution control equipment. Therefore the total tax paid is the same. However since the baghouse has an additional installation cost, that makes the technology with a baghouse costlier than the ESP option by the amount of the installation cost.
Coal usage of an ash tax

The coal usage in the power plants depends on the efficiency of the boiler, that is the production parameter given in terms of electricity per unit of coal. Therefore, both the options that are considered here include the high-efficiency boiler, hence coal usage is the same. The difference is in the emissions. One technology has an ESP and the other has a baghouse. The ESP is already installed in every power plant that is considered in this study. Therefore there is no additional cost of installation. However, a baghouse has an additional fixed cost of installation. Hence, even though the coal usage is the same, the baghouse option is more expensive.
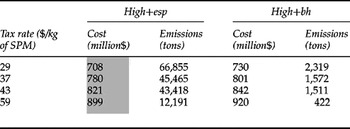
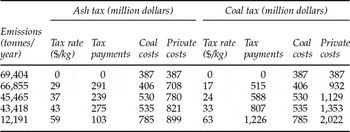
Table 6 gives the total private cost when the taxation policy is to levy an ash tax. As is evident, at each tax rate the difference in cost between the two options is about $21 million, which is the cost of installing a baghouse. The least-cost option under an ash tax is the high-efficiency boiler with an ESP. Even with higher tax rates, the cost-effective option is still the same. The amount of coal used when the power plants go for all imported or all washed is the same whether they use a baghouse or an ESP. The resulting costs of the least-cost option under an ash tax is actually higher than any costs under an emissions tax for any positive tax rate.
Total private costs under an ash tax

Coal tax
In this case, plants are taxed on the total amount of coal used. Table 7 describes the details of coal usage under a coal tax. As seen in the table, a zero tax rate has the same impact as a zero emissions tax. At a tax rate of $17/kg, the power plants using a high-efficiency boiler will shift to washed coal in 2040. A gradual increase of the tax rate until it reaches $24 makes the power plants switch to washed coal in 2003. Between the tax rates of $33 and $63 the power plants will shift to imported coal from 2041 to 2003. Similar to the ash tax, different tax rates induce the plant to abate in a similar fashion, whether they are using an ESP or a baghouse. This tax is levied on coal usage. The amount of coal used is the same for both the options under various coal tax rates. Therefore, the cheapest option under this taxation policy is always the high-efficiency boiler with an ESP. The difference in cost between the two options is the amount of fixed costs used to install a baghouse. The optimal switching point model is set in such away that the ash tax and the coal tax models affect the coal choice in a similar fashion. If the coal tax is given as τ x i, then the ash tax is given as a i (τ x i), where 0.09 ≤ ai ≤ 0.49.
Coal usage under a coal tax

Under similar levels of emissions, an ash tax levies tax on a certain percentage of the coal – that is the ash percentage of the coal, which may be about 35 per cent or 26 per cent or 9 per cent of the total coal amount – and a coal tax levies tax on the total amount of coal usage. Therefore, these two types of tax policies basically mimic each other. In theory, these types of tax policies should have been different, but in this case they do not give different results. Here, the ash tax payments are always a certain percentage of the coal tax payments. When we compare similar levels of emissions across tables 6 and 8, we can see that an ash tax is always cheaper than the coal tax. Even though the tax rate is higher for an ash tax for each level of emissions, it is not large enough to offset the difference in tax payment. Therefore, when choosing between an ash tax and a coal tax that yield the same emissions, the firms always prefer an ash tax as it results in lower tax payments. In the next section, we compare across an emissions tax, an ash tax and a coal tax.
Total private costs under a coal tax

Comparison between the taxation policies
We do a comparison of all the taxation policies in order to find the most efficient policy, which induces a given level of abatement at the lowest possible cost, given the Indian scenario. We first compare the ash tax and coal tax as they induce similar patterns of abatement. The reason as mentioned before is the way these taxes are imposed. Both these taxes depend upon the quantity of coal used. Hence, imposition of these taxes affects the coal usage, inducing the power plants to use a lesser quantity of coal by either using better quality coal or by using a high-efficiency boiler or both. For both the ash tax and the coal tax, we found that the high-efficiency boiler with an ESP is the cheapest option at each tax rate. Table 9 compares the costs across each of these policies. Given a certain emission level, the firms always prefer an ash tax to a coal tax. The reason as mentioned before is the way these taxes are levied. A coal tax imposes a tax on the total amount and an ash tax is imposed on the percentage of ash content of this coal amount. As each level of emission is brought about by the same pattern of coal usage, an ash tax is always the least expensive option even though coals costs are the same.
Comparison of costs across coal tax and ash tax for a high-efficiency boiler and an ESP

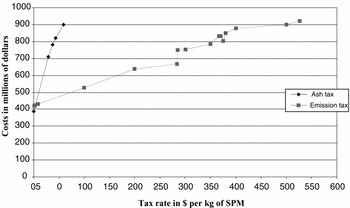
We now compare an emissions tax and an ash tax to figure out the cheapest option. For an emissions tax the cheapest option is the high-efficiency boiler and a baghouse and the cheapest option for an ash tax is the high-efficiency boiler with an ESP. Even though the options are different we can compare the ash tax and an emissions tax from table 10. At zero tax rate the cheapest option is the high-efficiency boiler with an ESP. As there is no regulation, the firms have no incentive to invest in pollution control equipment. Once the pollution control board imposes a tax, the plants have to choose between options. If we compare the ash tax and the emissions tax, we find that an emissions tax induces an investment in better pollution control equipment in the form of a baghouse. The baghouse not only leads to much lower emissions but it also results in lower tax payments and lower coal costs. An ash tax may be easier to monitor as it is easy to quantify the ash content of the coal. However, an emissions tax results in lower emissions at much lower costs. Figure 3 graphically compares an ash tax and an emissions tax across various tax rates. At any given emission level, an ash tax gives cheaper results than a coal tax. If we compare the ash tax and emissions tax, the latter always costs less to the firm.
Comparison between an ash tax and an emissions tax at each emission level

Comparison across an ash tax and an emissions tax with cost as a function of the tax rate

As considered in the model, we have two switching points. One is for the boiler and the other is for the equipment. The above policy runs have shown that the switch to a high-efficiency boiler is almost immediate. The second switch depends entirely upon the policy in place.
If we consider first an emissions standard, then the switch to a baghouse depends on plant-specific standards. If the emission constraint is binding for a high-efficiency boiler with an ESP, then the switch to a baghouse is immediate as that is the socially optimal choice. However, if the constraint does not bind, then the switch never occurs. A uniform regulation across plants will yield different results regarding the switch. The switch is immediate for plants whose emissions are constrained and the switch never occurs for plants that have unconstrained emissions.
The tax policies, on the other hand, induce the switch irrespective of any plant. For example, with an emissions tax, the switch to a baghouse is almost simultaneous with a switch in boilers. With an ash tax or coal tax in place, the investment in a baghouse is not cost effective. An ash tax or a coal tax is imposed on the coal usage. Therefore any investment in pollution control equipment, including a baghouse, is unnecessary. These results are true for all plants.
This analysis for the representative firm is reiterated for all firms. The difference lies in the optimal switching point and the tax rates that induce the switch. The next section aggregates these results across firms.
Aggregate analysis
The previous section summarized the results across tax policies for a firm. As we have seen empirically, the emissions tax is the most efficient. However the pattern of abatement is the same under any kind of tax policy. High tax rates or high emissions standards lead to abatement in a discrete pattern. As we have considered immediate switching to a high-efficiency boiler as the cost-effective option, the power plants further abate by adopting low-ash coal. The total coal costs under standard regulation that makes the power plant adopt low-ash coal immediately are the same for any other tax policy that induces the same switch.
In a period of 40 years, the plants adopt low-ash coal in different time periods, depending on the tax type, tax rate, and most importantly the plant efficiencies. We aggregate across firms to find the optimal switching point for firms with their coal usage pattern. Each plant has a unique coal usage pattern. By aggregating, we take into account the heterogeneity of the firms. This gives us the way each plant handles regulation.
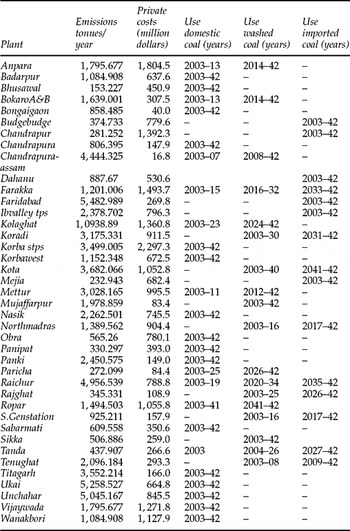
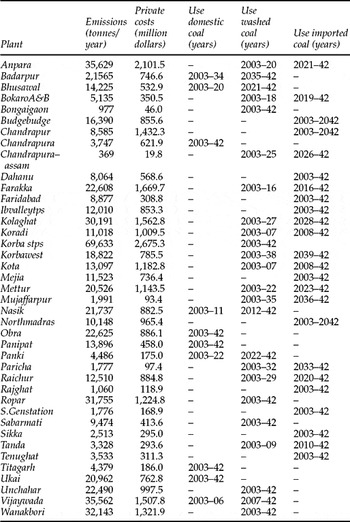
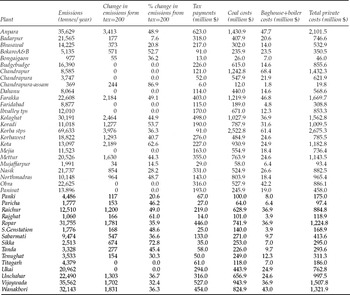
The simulation is done for tax rates of $200 and $300/kg. The results from the linear programming runs for each firm are summarized and described in tables 11 and 13. It describes the pattern of abatement when the emissions taxes are at $200/kg of SPM. As can be seen across these two tables, some firms adopt washed coal and some adopt imported coal to lower emissions. At a tax rate of $300/kg of SPM, those firms previously using domestic coal shift to washed coal to abate, some use imported coal and some still use domestic coal. Increasing the tax rate affects the time of the coal type switch. The faster the boiler depreciates, the earlier the date of the switch. As the tax rates increase, the firms abate by first switching to washed coal, and even higher tax rates cause them to shift to imported coal. There are two power plants whose existing usage consists of very low quality coal where the ash content exceeds 40 per cent. As a result, even after washing the coal, the ash content is still above 30 per cent. Therefore for these plants with a high-efficiency boiler, the abatement is done directly by using imported coal without using washed coal.
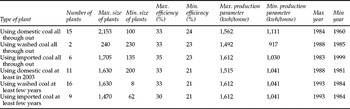
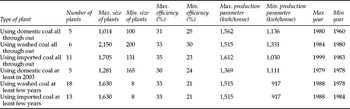
Tables 15 and 16 show that even though the pattern of abatement is the same, there is significant variability across firms in the time they switch to different types of coal and the tax rates at which they switch. In general, even though the results are qualitatively similar for all plants, the emission levels are different for different plants. As a result, the shift in technology and switch of coal types occurs at different levels of emissions.
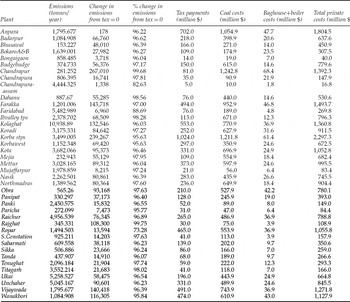
Table 12 describes the coal costs, tax payments, and fixed costs of abatement at a tax rate of $200/kg along with the change in emissions. When there is no tax policy in place the firms find the high-efficiency boiler plus the ESP to be the cheapest option. Any non-zero imposition of tax makes the high-efficiency boiler plus the baghouse the least-cost option. Therefore the change in emissions reflects the reduction in emissions from moving an ESP to a baghouse. At this tax rate, there is nearly 96 per cent reduction in emissions on average with a cost increase of less than 50 per cent. On the other hand, a change from a tax rate of $200/kg to $300/kg leads to a decrease in emissions by 35 per cent with a cost increase of less than 15 per cent on the aggregate as described by table 14.
Table 15 describes the variability among the power plants in terms of optimal switching points. This table shows variability in terms of the size, age, and efficiencies of the power plants as they abate by adopting low-ash coal. As the tax rate increases, a number of power plants switch to washed coal and imported coal. The average age, size and efficiencies of the plant also change along with the switching points. Table 15 describes the changes from a tax increase. There are some power plants already using all imported coal right from 2003 at tax rate of $200/kg. On the other hand, some power plants do not abate at all at this tax rate. Others use washed coal, not right from the beginning, but from somewhere between 2003 and 2042. The plants that use high-ash coal at this tax rate are the most polluting plants with very low plant efficiency. Some plants start abating at a tax rate between the range of $200 and $300 and some do not abate even at a tax rate of $300/kg. Evident from these two tables is the fact that as policy becomes stricter, the number of plants abating increases.
An emissions tax induces efficient allocation of abatement across firms, even when all the firms are different and some firms abate more than the others. This is because some firms have higher plant efficiencies than others. So a flat tax rate of $200/kg induces some firms to abate by using high-quality low-ash coal and induces others to operate as before the tax imposition. Some firms abate, not immediately, but somewhere along the line of 40 years. Overall, depending on the plants efficiencies, there is the right allocation of abatement. In this study there is a discrete method of abatement. Therefore, a regulation that requires 25 per cent emission reduction by all plants would not lead to an efficient allocation of abatement. These discrete changes cause some power plants to reduce emissions by more than 25 per cent. As a result the total reduction in emission is much more than the required percentage. A uniform regulation causes the polluting and not-so-polluting firms to be treated equally. Therefore, it may happen that the polluting power plants, even after abatement, pollute much more per unit than the less polluting firms. This acts like a disincentive to firms who seriously abate. As we can see from table 11, each power plant has differing levels of emissions. Therefore, any emissions standard of say 2000 kg of SPM per ton of coal would cause only 15 power plants to abate. The remaining 25 plants, even though they may be highly polluting, emit particulates below 2000kg/ton of coal, hence they do not abate. Even though an emissions tax means higher private costs with lower social costs because of high tax payments, this tax will be preferred to a regulation.
Emissions tax rate $200/kg of SPM

Cost breakup and change in emissions at emissions tax rate $200/kg

Emissions tax rate $300/kg of SPM

Cost breakup and change in emissions at emissions tax rate $300/kg

Variability of firms at emissions tax rate $200/kg

Variability of firms at emissions tax rate of $300/kg

6. Conclusion
The policy implications of this study show the win–win nature of a new boiler. The emission reduction from installing a new boiler on an average is about 90 per cent. For some power plants it is even more. As we have seen earlier, Indian cities emit particulate matter on an average about three times the WHO standards. Therefore, the plants need to reduce their emissions by about two-thirds, which is about 66 per cent of their total current emissions. An installation of a boiler reduces emissions on an average by 90 per cent, which is much more than required by the WHO standard. Therefore an additional installation of a baghouse, even though it reduces emissions, is not only costly but also redundant in order to achieve the WHO standards. As the goal is to reach the WHO standards, any expenditure to control emissions beyond that has no essential contribution.
The policies that are considered include an emissions standard, an emissions tax, an ash tax, and a coal tax. Generally, the first-best policy that can induce them to adopt the least-cost technology is an emissions standard and an emissions tax. The emissions standards have to be firm-specific as firms differ, whereas the emissions tax can be a flat tax across plants. The ash tax and the coal tax are generally considered second-best policies. The policy simulations show that the way the emissions tax induces abatement leads to not only lower emissions but also lower costs. This emissions tax gives the first-best outcome even though an ash tax is much easier and cheaper to monitor. Among all types of taxes considered, the coal tax is the costliest policy. The ash tax and the coal tax induce similar patterns of abatement because of the structure of the tax. However, an ash tax is generally considered to be more cost-effective than the coal tax, as it is a better proxy for emissions.
Theoretically and empirically an emissions tax did give us efficient results. The question however is whether we require that additional investment in a baghouse. Installing a boiler will itself reduce emissions by nearly 90 per cent for almost all firms. An ash tax or a coal tax induces immediate investment in boilers. However, these taxes do not make the investment in a baghouse necessary. Also, they are easier to monitor.
In the aggregate, the policy runs reflect the heterogeneity of the firms in their size, age, and boiler depreciation. For varying tax rates, we find that the plants switch to low-ash coal at different time periods. This is because each plant has a different depreciation rate for the boilers. The lower the efficiency of the boiler, the earlier is the coal type switch by the plants. For some extremely polluting firms, a lower tax rate can induce them to switch to low-ash coal at an earlier date. On the other hand, the less polluting plants switch coal types both at a higher tax rate and at a later time period.
Despite the cost effectiveness of a high-efficiency boiler, the power plants have yet to adopt it. This is mainly due to the lack of information. Another important factor is that projects that are being funded by the World Bank are more towards determining the benefits of baghouse installation versus the ESP, rather than the installation of a boiler.
On the policy implication side, it is important for the pollution control board to experiment with other kinds of market-based instruments such as the trading permits which have met with huge success elsewhere. As the study by Russell and Vaughn (Reference Russell and Vaughn2003) implies, a market-based instrument could successfully reduce emissions without incurring huge monitoring costs. India is an up-and-coming industrial economy with many small firms. A marketable permit could efficiently allocate abatement across firms without the firms incurring additional tax payments. The power plants have scarce profits if any at all. To charge a tax would cause them to be even further financially strapped. As seen in the study, an emissions tax does give efficient results. However, a marketable permit can make the same efficient allocation without the high cost to the firms.
The main issue encountered while doing this study is the limited data set. This study only does a cost analysis. Due to scarcity of data, we couldn't do a cost–benefit analysis. Secondly, the linearity of the model has driven some of the results of this study. A non-linear production constraint may have led to different, more solid results. For future research, this study can include all other power plants in India to bring in more variability. A cost–benefit analysis done on this study can make the results more robust.
I am deeply indebted to Kathleen Segerson, without whose help this paper wouldn't have been possible. I also thank Bruce Larson for his constant guidance and invaluable suggestions. I am also grateful to Tom Miceli for his support.