This paper is the first formal report of an ongoing sociophonetic study of dialect focusing in the Pacific Northwestern United States (or PNW, hereafter). Research results are described for a 25-speaker intergenerational sample drawn from the native-born population of metropolitan Seattle. The goals of the larger project, of which this report is part, are twofold. The first is to investigate the English spoken in the Pacific Northwest (PNWE hereafter), 200 years after the introduction of nonindigenous speakers to the region. This study fills a gap in dialectological research by describing the contemporary vowel system(s) of the region, starting with the city of Seattle. Second, this research aims to characterize linguistic variation and change over time in this dialect contact setting. This paper addresses the first goal.
To date, few sociolinguistic studies have focused on the American Pacific Northwest. Most of the existing research into PNWE was conducted by Carroll Reed, author of the Linguistic Atlas of the Pacific Northwest (or LAPNW, Reed, Reference Reed1965). Reed likened Washington speech to that of southern Illinois and Iowa and argued that it is not a mere extension of northern California's dialect: it shows a preference for Northern words, and has a lower percentage of Southern-Midland terms than Californian English does. Phonologically, PNWE shows loss of the cot~caught distinction and lax [ʊ] in root-class words.Footnote 1 Crucially for the purposes of the current research, Reed specifically noted the raising of /æ/ to [eɪ] in hang-class words (Reference Reed1952:187). The LAPNW supplies information for 51 subjects (the smallest number of informants of any of the Linguistic Atlas Projects). Its valuable records include narrow International Phonetic Alphabet transcriptions for a set of lexical forms elicited by Reed that may be used for contemporary comparative work.Footnote 2
The Phonological Atlas of North American English (commonly abbreviated ANAE, Labov, Ash, & Boberg, Reference Labov, Ash and Boberg2006) places Seattle in the Pacific Northwest subregion of the larger American West. The ANAE includes data from 16 speakers from the four northwestern states of Washington, Oregon, Utah, and Idaho. The ANAE specifically states that there is no reason to distinguish a PNWE variety on the basis of phonology. Based on the findings of the Telephone Survey Project (or TELSUR) and other studies, Labov (Reference Labov and Eckert1991) divided North America into three major dialect regions, defined by their participation, or lack thereof, in the Northern Cities Shift and the Southern Shift. The third dialect region, in which Seattle is included, is defined by its lack of participation in either of these vowel shifts. This loosely-circumscribed dialect region includes Canada, the Midlands and the entire American West, and its primary distinguishing features are the merger of cot /a/ and caught /ɔ/, and fronting of /uw/ (Gordon, Reference Gordon, Schneider, Burridge, Kortmann, Mesthrie and Upton2004).
Because of the lack of published details about the contemporary features of PNWE, it was considered critical to begin with descriptive work that might serve as a foundation for subsequent research. Thus, the starting point selected for this study was the speech of European Americans born and raised in metropolitan Seattle, although the project database includes speakers from other corners of Washington state, and both white and nonwhite ethnicities. This paper begins with a brief history of Seattle. The focus of the pages that follow will be to provide descriptive details of the vowel system. The final sections mainly explore raising of low-mid and low-front vowels /ε/ and /æ/ before voiced velar stops (here, the focus is on /g/), which is a pattern found to be in widespread use in the metropolitan Seattle area.
A BRIEF OVERVIEW OF SEATTLE HISTORY
This research project began in 2005, the bicentennial anniversary of the November 15, 1805, arrival to the Pacific Ocean of Captains Meriwether Lewis (1774–1809) and William Clark (1770–1838). Their detailed survey, documenting the plants, animals, geography, and inhabitants of the region, made it possible for Thomas Jefferson to more than double the size of the United States during his presidency. Forty-six years later, a group of 22 European Americans became the first trans-American settlers to permanently establish homesteads in what is now the West Seattle neighborhood of Alki Beach (Meany, Reference Meany1946; Sale, Reference Sale1976; Taylor, Reference Taylor2003). The leader of the party was Arthur Denny of Illinois. His group was followed over the next several months by settlers from Ohio and New England. The presence of New Englanders was so salient that the Duwamish people generally referred to European American settlers as “Bostons” (a fact also reported by Wolfram & Schilling-Estes, Reference Wolfram and Schilling-Estes1998). Some travelers arrived via coastal routes from California and Vancouver, Washington. The best information available, therefore, indicates that the most likely locations of origin for the earliest Caucasian speakers to the region include southern Illinois, Ohio, Indiana, and Massachusetts (Reed, Reference Reed1952; Sale, Reference Sale1976; Taylor, Reference Taylor2003).Footnote 3 During the Klondike gold rush of the early 1890s, Seattle established itself as a supply center for the Alaska and Yukon Territories. New transnational migrants, eager to join in the hunt for gold, came from Illinois, Indiana, Ohio, and Missouri (Lee, Reference Lee1957; Lemieux, Reference Lemieux2005). Drawn by commerce and work on the Northern Pacific Railroad, the Chinese became the earliest Asian community in Seattle. By the 1930s, Seattle's Chinatown and Japan Town were the largest in the U.S. West. When, during World War II, Japanese Americans were removed in large numbers to inland internment camps under President Roosevelt's Executive Order 9066, some of the vacated homes became occupied by Filipinos and African Americans arriving in the region (Mumford, Reference Mumford1980). Seattle's Yesler Terrace, founded in 1941, became the nation's first racially integrated public housing development. Thus, while the period from roughly 1851 to 1940 was characterized by transnational migration into Seattle, the period from 1950 to 1970 was more centrally associated with the growth of nonwhite minority groups and diversification of Seattle neighborhoods. Some were initially attracted to manufacturing jobs generated during the Second World War as government orders for new aircraft increased and Seattle's Boeing Corporation responded. Some arrived for military duty. After the war ended, a brief period of stagnation in manufacturing occurred. However, shortly thereafter, Boeing rose to again play a central role in the local economy, as the focus of airplane manufacturing shifted to passenger aircraft. The African American and Asian American middle classes grew. Their members moved from working-class neighborhoods in the international district into ethnically diverse neighborhoods elsewhere. Seattle was host to the 1962 World's Fair and grew as a center of the arts and visionary thinking. The protests, poetry, and music of “Beats,” “Fringies,” and “Grunge” artists figured prominently in the American counterculture movement. The next major phase in local history dates to the establishment of the Microsoft Corporation in 1975. Seattle, to this day, is known for the vitality of its technology and biotechnology sectors, and for the green-collar jobs that signify the city's unique reputation for environmental consciousness. Historians associate this time with both continued transcoastal migration and an increase in local self-identification (Sale, Reference Sale1976; Taylor, Reference Taylor2003). Local pride is evident in neighborhoods such as Ballard, where many families consider themselves to be “true” Seattle natives, distinct from transplants who came to the region for tech jobs.
These three broad historic phases (representing sociocultural shifts from transnational migration, to interethnic mixing, to regional identification), and the community change they represent, are reflected in the sampling procedure used in this project. This has been to sample the age continuum emically, using periods of time that are potentially important to dialect formation (Eckert, Reference Eckert and Coulmas1998:155; Trudgill, Reference Trudgill2004:23). The PNW is still young enough to include the second generation of non-first-nations indigenes. The oldest speakers in the present sample are of this generation. It is rare, in dialect research, to be able to audio-record speakers born this soon after initial dialect contact. Following Trudgill (Reference Trudgill1986), many sociolinguists understand three generations to suffice for dialect focusing to occur. Continued study of this community over time will enable tracking of the linguistic evolution in the PNW. It is hoped that this will contribute to sociolinguists' understanding of dialect contact, more generally. Beginning with a detailed investigation of the vowel system is hoped to lay a valuable foundation for this larger enterprise.
RESEARCH QUESTIONS
A close sociophonetic investigation of Seattle English, 200 years after initial introduction of nonindigenous speakers, seems timely and appropriate for the reasons just outlined. The research questions taken up in this paper are as follows: What are the phonetic features of the vowel system(s) of metro Seattle speakers? The main goal of the paper is descriptive, that is, to provide a detailed instrumental examination of the phonetic locations of phonological forms. An exploration of patterns of variation across the three generations will provide the groundwork for future research exploring dialect change.
The dataset can also help to establish similarities and differences between the contemporary vowels of Seattle speakers and those forms noted by Reed as potentially distinctive in the region, as have already been described. Thus, a secondary research question asked is: Is there evidence of advancement in any of the changes to which Reed alluded in the 1950s? Here, the hypothesis is that the apparent-time view afforded by the present dataset will reflect a progression in raising of /æ/ (originally noted by Reed, Reference Reed1952, Reference Reed1961). Reed gave little detail regarding the extent of community-wide raising present in his day. The data reported here paint a detailed picture of the landscape of variation in the contemporary period. Representation of the full vowel system is critical for establishing the positions of changing forms within the larger system, and for enabling future investigation of their movements. A view of the full system turns out to be important not just for the /æ/ vowel (noticed by Reed), but for /ε/ as well.
METHODS
Speakers
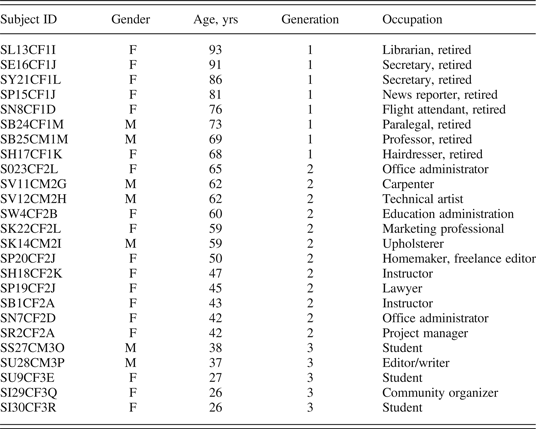
Twenty-five Anglo-American Seattle indigenes were the focus of this study. Speakers' ages ranged from 26 to 93 years at time of initial recording. As already described, this apparent-time sample was designed to encompass three generations, representing a wide swath of Seattle history, divided using the emic approach to age described previously. The oldest generation was born between 1900 and 1950 (representing the second generation of Caucasians born in the PNW).Footnote 4 The middle-aged speakers were born between 1951 and 1970. The youngest speakers were born between 1976 and 1986. These generational cohorts will be referred to as: Oldest (Gen 1), Middle (Gen 2), and Youngest (Gen 3). All speakers discussed in this paper were born and raised in predominantly middle-class to lower-middle-class Seattle neighborhoods in central King County (including, Ballard, Ravenna, Wedgwood, the University District, Bothell, Sand Point, and Lake Forest Park). None lived outside of the PNW at any time during the period from birth to age 13 (the critical period for language acquisition). With the exception of one speaker who self-identified as working class (Speaker SU9CF3E, who was a University of Washington student at the time of the recording), all subjects self-identified as middle class. English was the language of each household represented. All respondents had completed high school. Levels of advanced schooling varied—from business school certificates to doctoral degrees. No subject reported speech or hearing difficulties. Table 1 lists all subjects included, by gender, age, generational cohort, and occupation. Subjects were recruited through online, print, and radio media, as well as by word-of-mouth.
Seattle speakers, by gender, age, generational cohort, and occupation

Note: F, female; M, male.
Data from two tasks—a reading passage and a word list—comprising about 17,000 vowel tokens, are the focus of the present investigation. This corpus represents a subset of the data gathered for the larger study. The present research, which is focused on system description and change in apparent time, examined the effects of phonetic environment, gender, and generation.
Materials
All phonemes in the vowel system were included in the study (iy, i, ey, e, ae, o, ah, oh, ʌ, u, uw, ay, oy, aw, ow), plus the rhotic classes (ihr, r, aer, ohr, uwr). As mentioned previously, the central focus was on the front periphery, particularly the historic word classes (ae, e, ey). For clarity in the discussion that follows, this set and its members will hereafter be referred to as (æ, ε, ey). Vowels were embedded in real words (no nonsense words were used). These words were collected in the carrier frame, Write __ today. A set of targets was elicited in the phonetically neutral environment H_D (heed, hid, hayed, head, had, etc.). But because it is critical in sociolinguistic research to represent forms in key conditioning environments, vowels in additional phonetic contexts were targeted to allow inspection of features that might aid in diagnosing dialect differences. These forms included variables mentioned in preliminary studies of PNWE (e.g., roof; viz. Conn, Reference Conn2002; Ingle, Wright, & Wassink, Reference Ingle, Wright and Wassink2005; Reed, Reference Reed1952), as well as forms that allow comparison to other important changes investigated in North American English (including the California, Northern Cities, and Southern Shifts). In all, the word list contained 250 targets. Speakers read the word list three times, yielding approximately 750 items. The reading passage was an adaptation of Aesop's fable, “The Cat and the Mice,” modified to provide 58 tokens matching those collected in the word list.
Recording sessions were conducted in the field, typically in subjects' homes. Most lasted 1.5 to 3 hours. Subjects participated in unscripted conversation with a familiar (friend or a family member) in order to offset the observer's paradox. Experimental tasks were then completed individually (including semantic differentials, the reading passage, and word list). Recording was accomplished using an M-Audio Microtrack 24/96 Compact Flash Recorder, paired with an Audio Technica 3031 microphone. Recordings were made using a 44.1-kHz sampling rate (downsampled to 11.025 kHz).
A combination of procedures was used for aggregating vowel data prior to analysis. The earliest project recordings were segmented by hand using Praat software (Boersma & Weenink, Reference Boersma and Weenink2005), then automatically measured using a Praat script. Later recordings were automatically segmented using the Penn Phonetics Laboratory Forced Aligner (P2FA, the command-line implementation of FAVE) (Yuan & Liberman, Reference Yuan and Liberman2008).Footnote 5
DATA ANALYSIS
Tokens were coded for historic word class and subjected to auditory and acoustic analyses. First, each vowel was impressionistically transcribed (to register raising, lowering, or monophthongal or diphthongal quality). Then, as a first step in the acoustic analysis, two overall measures (f0 and duration) were taken for each vowel. A 300-msec analysis window was used for hand-setting and correction of onset and offset markers. Then, a multiple-point measurement technique was applied to each vowel. F1 to F3 were measured at three temporal locations (20%, 50%, and 80%). Spectral analysis was accomplished over a 0- to 5500-Hz range with a 25-msec analysis window and a dynamic range of 30 dB. Four- or 5-pole linear predictive coding analysis was used, as appropriate for each speaker. Spectral measures were subjected to Nearey-1 normalization, a speaker-extrinsic method that performs uniform scaling, enabling cross-gender comparison (Adank, Smits, & van Hout, Reference Adank, Smits and van Hout2004; Nearey, Reference Nearey1977; Watt, Kendall, & Fabricius, Reference Watt, Kendall, Fabricius, DiPaolo and Yaeger Dror2010). Plotting of vowel data was accomplished in R using phonR (McCloy, Reference McCloy2013). Inferential statistical testing was also completed using R (R Core Development Team, 2012).
Euclidean distance data were calculated for phonological diphthongs (DiPaolo, Yaeger-Dror, & Wassink, Reference DiPaolo, Yaeger-Dror, Wassink, DiPaolo and Yaeger-Dror2010). These were used to register extent of change over the duration of a vowel in the first two vowel formants (ΔF1, ΔF2) as an indication of diphthongization. In this study, a conservative approach was taken to representation of vowel trajectory; one intended to minimize the influences of flanking consonants by using 20% and 80% measurement points as “onset” and “offset,” respectively. The spectral overlap assessment metric, or SOAM, was used to address questions of merger (Wassink, Reference Wassink1999, Reference Wassink2006; cf. Hall-Lew & Nycz, Reference Hall-Lew and Nycz2013) with VOIS3D graphical representation. In the SOAM method, normalized formant and duration values for two vowel distributions are used to generate best-fit ellipses or ellipsoids in either a two- or a three-dimensional geometric space (F1 × F2 or F1 × F2 × duration). Midpoint values are used here as a reasonable gross representation of the target of the vowel (see DiPaolo et al., Reference DiPaolo, Yaeger-Dror, Wassink, DiPaolo and Yaeger-Dror2010, for discussion). Extent of overlap is output as an overlap fraction (Ω), ranging from 0 to 1. The value Ω = .75 or higher was used as a conservative cutoff indicating complete overlap, reflecting numerically the notion that the distributions' areas overlap almost entirely in both height and backness simultaneously, Ω = .5 to .75 for partial overlap (distribution centers are close, but tail areas show some separation), and Ω = 0 to .25 for no overlap.Footnote 6 SOAM 2D was used in this study.
Because SOAM considers overlap in both F1 and F2 simultaneously, overlap may be more effectively assessed than techniques that express overlap in terms of a single dimension at a time (for discussion, see DiPaolo & Faber, Reference DiPaolo and Faber1990). For example, one traditional method used is simply to consider mean F1 (and then mean F2 separately), supported by visual inspection of a scatterplot. This method is useful for visualization, but cannot quantify merger in any but the clearest cases. Another technique considered was the EQ measure, actually designed for establishing fronting or raising (Benson, Fox, & Balkman, Reference Benson, Fox and Balkman2011; Labov et al., Reference Labov, Ash and Boberg2006), in which the position of one vowel is established using a second vowel as a reference point (e.g., F1 /æ/ < F1 /ε/). Height and backness differences are classed into four quadrants of a graph. The statistic reported is the percentage of the moving vowel's tokens falling into each quadrant. This measure returns results based on the respondent's own vowel system, which avoids problems associated with attempting between-speaker comparisons using raw Hertz (see DiPaolo et al., Reference DiPaolo, Yaeger-Dror, Wassink, DiPaolo and Yaeger-Dror2010). This measure is easy to calculate and highlights both predominating and minor patterns within and across speakers. However, the overall view afforded across affected quadrants can be difficult to interpret. Location within a quadrant can be important (e.g., to distinguish minimal from extreme fronting). And, because the reference vowel is represented only in terms of its F1 × F2 mean, consideration of the extent of overlap in the tail areas of the distributions must be accomplished separately. This is a critical desideratum for assessing merger.
RESULTS
An overview of the Seattle vowel space
The presentation of results begins with a characterization of the Seattle data that is broad enough to represent the vowel system's major phonetic features, yet deep enough to explore the sociolinguistic variation observed. The arrangement of all vowels in the system is established first, so that later, the positions of vowels involved in raising may be evaluated. Throughout, the findings of this investigation are considered in light of relevant results reported in earlier research (including Conn, Reference Conn2002; Ingle et al., Reference Ingle, Wright and Wassink2005; Labov et al., Reference Labov, Ash and Boberg2006; Reed, Reference Reed1952).
A note is in order. The elicitation materials were designed to include all variables described by Reed (Reference Reed1952) to allow for maximal comparability to the oldest extant historical descriptions of the PNWE. However, during the early stages of research, unanticipated, systematic, sociolinguistic variation was discovered in one set of front vowels (ε, æ, and ey) in prevelar contexts. The prevelar environment was not targeted initially for study because it was not mentioned by Reed (Reference Reed1952). The elicitation protocols were subsequently modified, and supplemental data was collected for as many speakers as possible.
Figure 1 shows the overall distribution of vowel space for the Seattle sample, partitioned by gender. Mean formant values are presented in Appendix A. Vowel polygons for males and females were graphed separately so that gross differences in configuration of the vowel space due to gender might become apparent. It is well known that females and males often show different degrees of participation in language change. Therefore, it was important to explore the potential effects of gender. The Nearey-1 normalization technique used here is sometimes preferred in sociophonetic studies because it suppresses much of the variation due to nonlinguistic factors (such as sex-related or biological variation), while preserving “desirable” variation of interest to sociolinguists—differences due to linguistic and social factors (DiPaolo et al., Reference DiPaolo, Yaeger-Dror and Foulkes2005; Watt et al., Reference Watt, Kendall, Fabricius, DiPaolo and Yaeger Dror2010; also see Chambers, Reference Chambers2008, for a discussion of gender- vs. sex-based variability). Differentiation due to gender, as a social construct, is important to retain. Therefore, a method was selected that was powerful, but not too powerful, in suppressing variation. The figure shows that the basic sizes and shapes of Seattle males' and females' vowel polygons are similar. However, the fact that the males' system is centered at a lower-frequency grand mean signifies that some of the variation due to the biological tendency for males to have a lower fundamental frequency has likely been preserved. One key difference emerges from this preliminary view—a different location for males' and females' low-back vowels. The following discussion begins with this and three other key sociolinguistic variables, to locate Seattle preliminarily with regard to features of key importance to the West and to Seattle, on the basis of earlier research.
Seattle vowels (monophthongs, (ey) and (ow)), female and male speakers.
Low-back merger (o, oh)
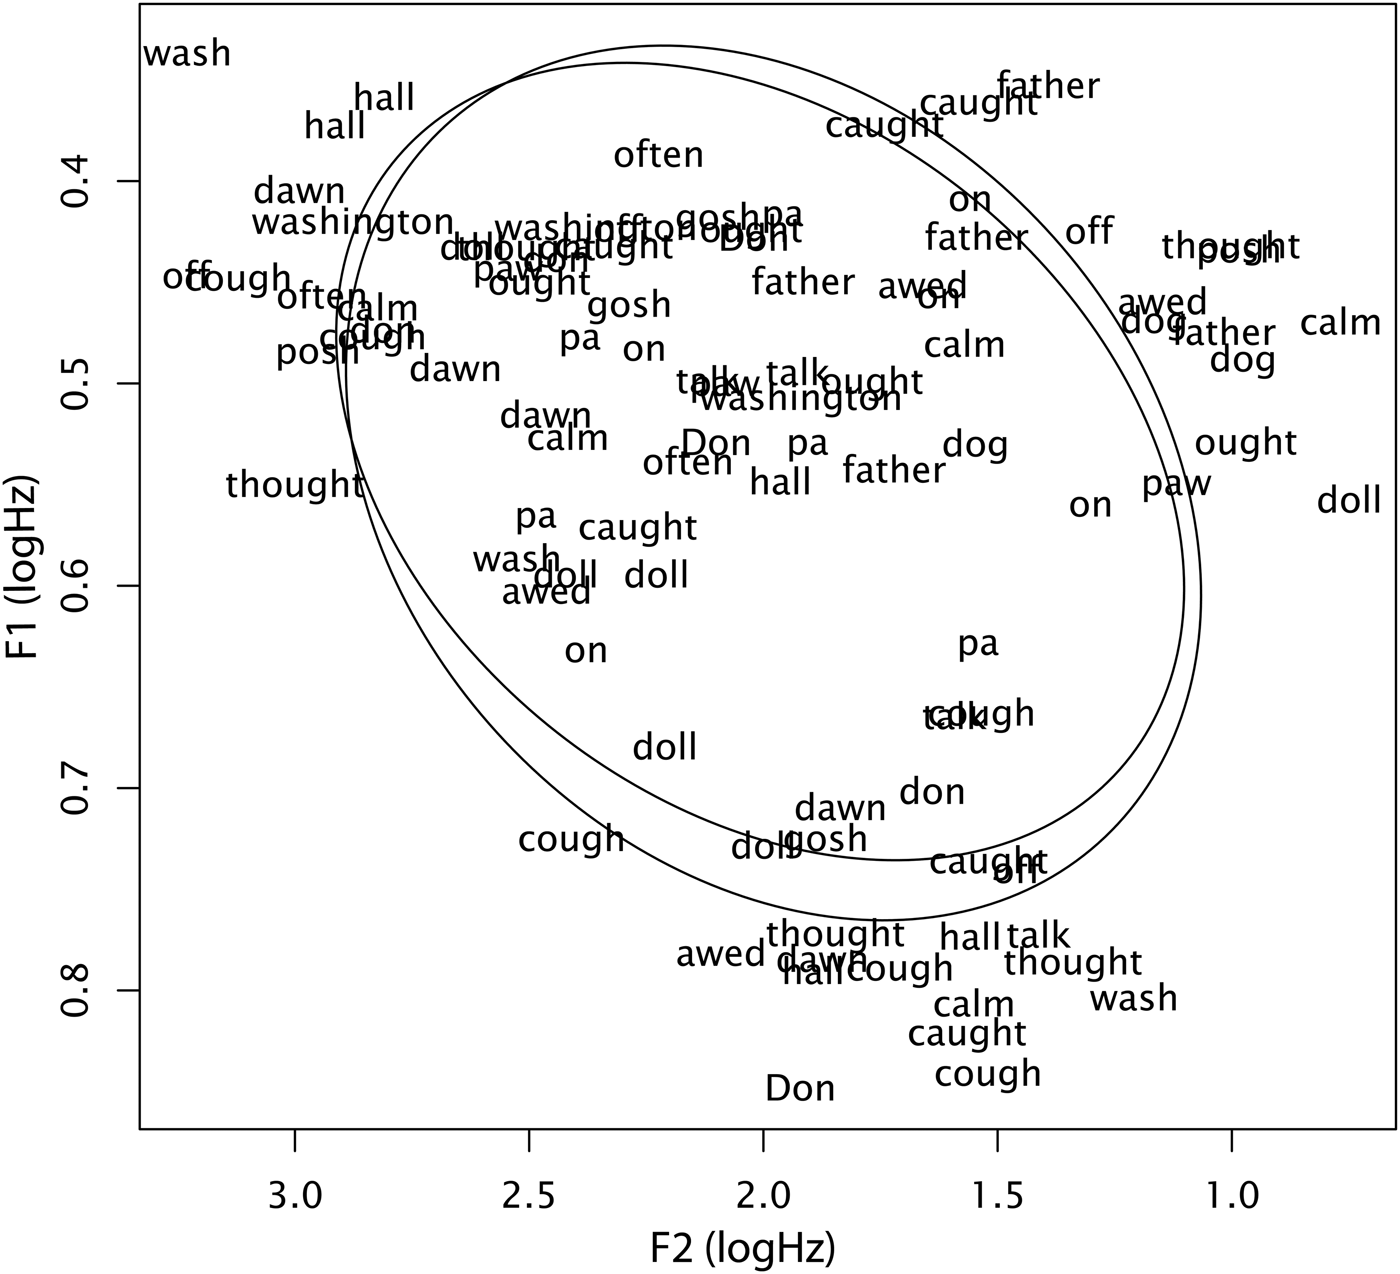
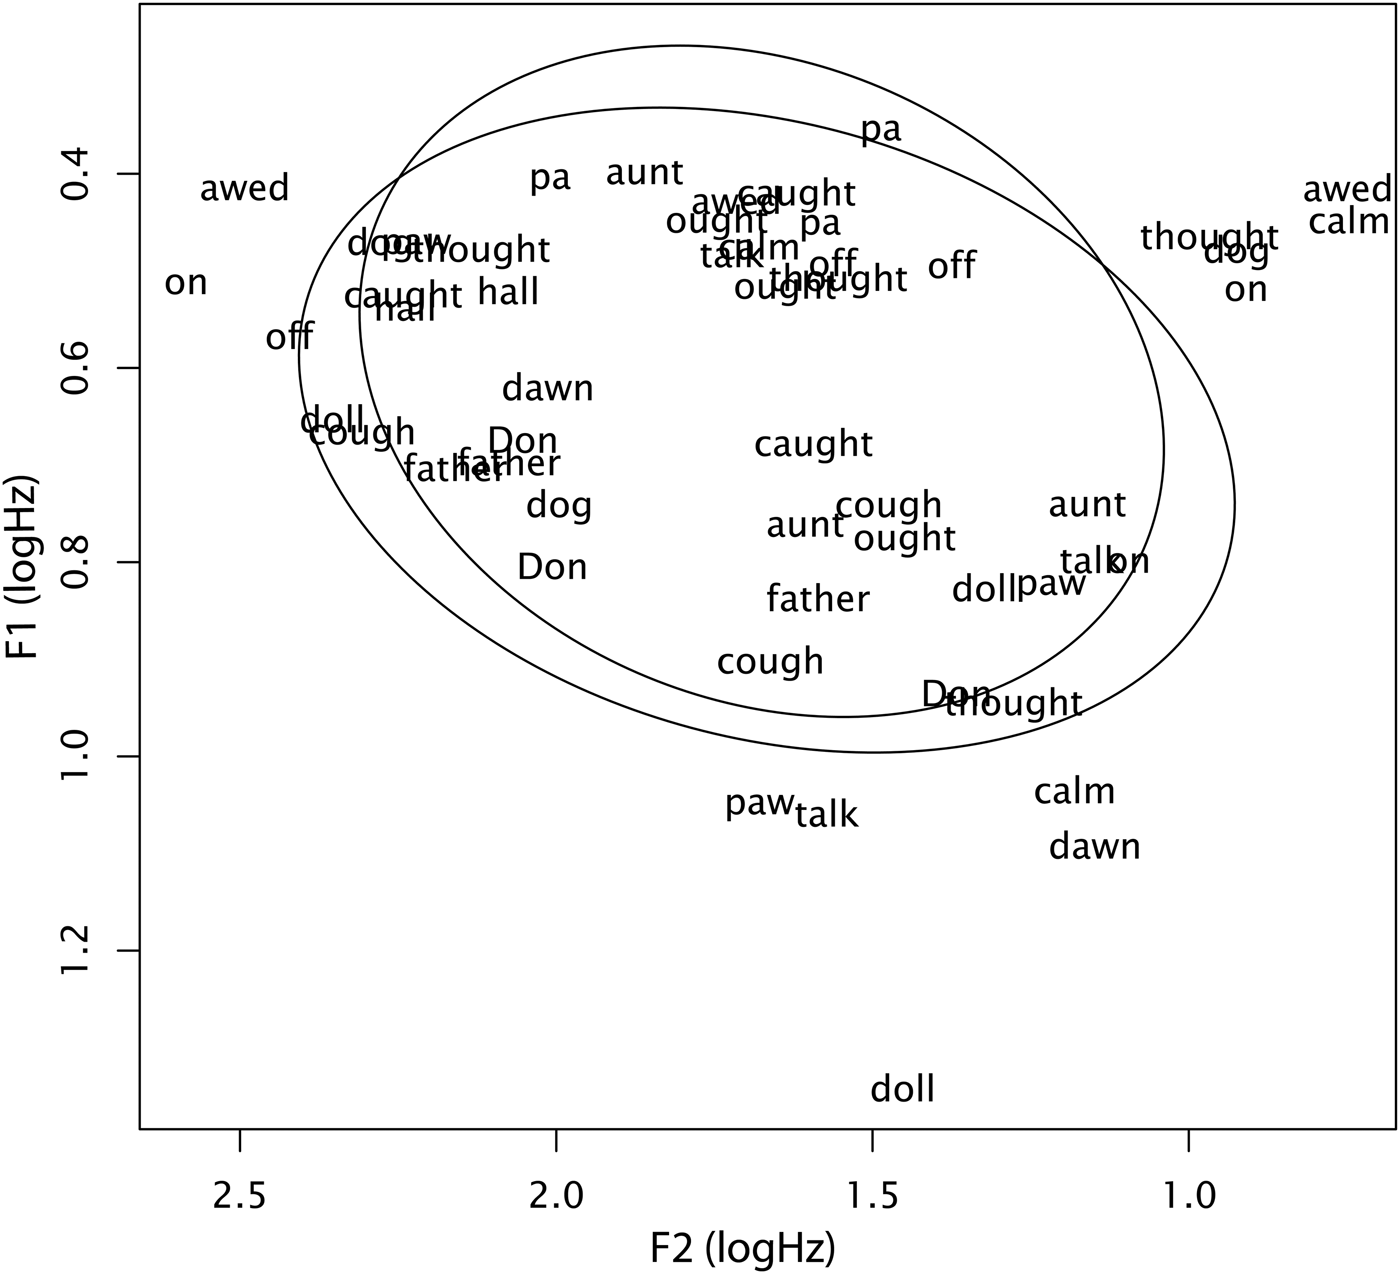
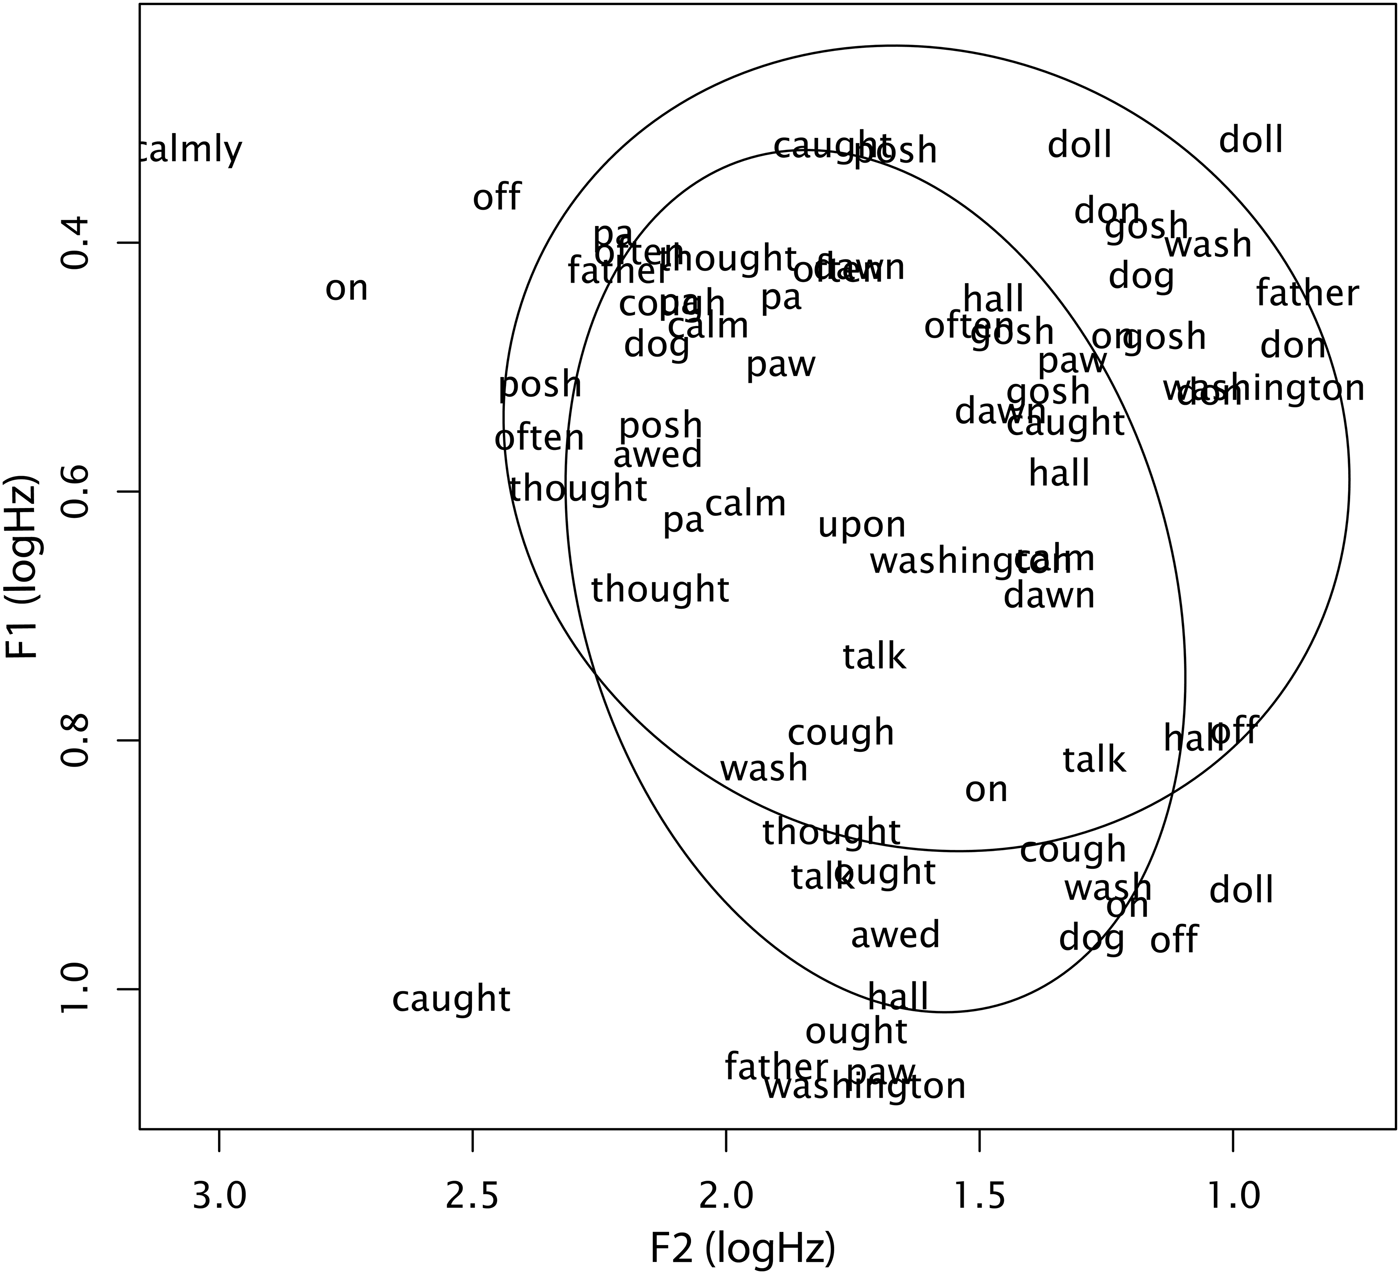
Figures 2, 3, and 4 show that all three generations are quite advanced in the cot /a/–caught /ɔ/ merger, as was expected. Even in the oldest generation, merger is the predominating pattern (see Figure 2). A scatterplot with words displayed as point labels shows that even for the oldest speaker shown here, Speaker 17, all three repetitions of dawn are immediately adjacent to her repetitions of Don. The actual phonetic values of these forms span the full interior area of the ellipse.
cot /a/ and caught /ɔ/ data for a Seattle speaker of the Oldest generation cohort: Speaker 17 (Female, Gen 1).
cot /a/ and caught /ɔ/ data for a Seattle speaker of the Middle generation cohort: Speaker 1 (Female, Gen 2).
cot /a/ and caught /ɔ/ data for a Seattle speaker of the Youngest generation cohort: Speaker 30 (Female, Gen 3).
Some comments are in order regarding the location of the merged vowel. Auditory inspection of data plotted in Figure 1 for all speakers indicates that the phonetic quality of the target of merger varies over a wide phonetic region, from raised [ ], to a fairly fronted [ɔ], to [ɑ]. Gender partly accounts for observed differences.
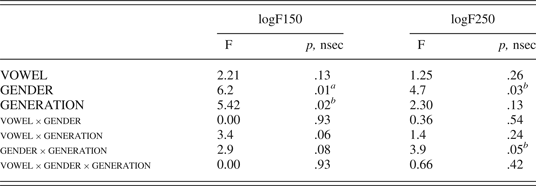
Males and females treat the merger differently. The merged target falls among []~[ɔ] for most males, but is backed and lowered toward [ɑ] for most females. In fact, the appearance of cot versus caught separation by females in Figure 1 belies the fact that many females' vowel distributions overlap extensively, as mentioned in the discussion of Figure 2. Nonetheless, gender differences did emerge as statistically significant. Nonparametric multifactorial analysis of variance (ANOVA) with gender and generation as social factors, and normalized values of F1 or F2 as the continuous outcome variable in two separate sets of tests, confirms the significance of the gender difference (see Table 2), as well as an effect of age. Males are more likely to use a form that is more fronted in their system and females to use one that is more backed. The gender × generation interaction for F2 signifies that Seattle females reduce the F2 difference between vowels as age decreases. Males of all generations and younger females tend to have an [ɔ] that is proximal in height and fronting to [a] in their system. Taken together, these results reveal that the females were somewhat more conservative in separating [ɔ] and [ɑ] in production. Vowel height results must be interpreted with caution. This is because some of the height variation may reflect physiology-based differences that were not suppressed by normalization. Reed (Reference Reed1952:187) commented that most of the people he interviewed apparently had no low-back vowel at all. In the current dataset, male speakers most closely match such a pattern. However, Reed's data were not accompanied by narrow phonetic transcriptions (or by acoustic measurements), so this assertion cannot be confirmed. He reported, however, that for some of his speakers, a mixed set of words from the cot /a/ and caught /ɔ/ classes including all,loss,off,dog,chocolate, and washing were realized with “[a],” although this pattern was subject to a great deal of between-speaker variation. At any rate, it is difficult to know exactly what phonetic values Reed heard, and whether certain words tended to be more fronted than others, which would predict a lexical effect. No lexical effect emerges in the present investigation. It must be noted that hypercorrection was found in some, particularly younger female, speakers. This may help to account for the gender effect. Inspection of Figure 4 reveals that for Gen 3 Speaker 30, caught /ɔ/ class forms were sometimes produced lower in the system than cot /a/ forms. These may be spelling pronunciations, such as are commonly found in citation tasks. Or, it may be that she has a mental representation in which the word classes are inverted. Confusion about word class memberships, or so-called flip-flop, is not uncommon in cases of (near-) merger (Hall-Lew, Reference Hall-Lew2013; Labov, Reference Labov1994). Recent work on Oregonian English describes similar findings (Becker, Aden, & Best, Reference Becker, Aden and Best2014) in a neighboring area.
Multifactorial ANOVA modeling the influence of gender and age on normalized midpoint F1 and F2 of vowels produced in cot /ɑ/ vs. caught /ɔ/
Notes: ap≤.01.
bp-value obtains significance at the .05 level.
Fronting of back vowels (uw, u, ow)
Fronting of back vowels (uw), (u), (ow) has been identified as a feature of the California Vowel Shift (Eckert, Reference Eckert2005; Hagiwara, Reference Hagiwara1997; Kennedy & Grama, Reference Kennedy and Grama2012). It is considered a change occurring across other U.S. varieties (Hall-Lew, forthcoming; Labov et al., Reference Labov, Ash and Boberg2006), including nearby Portland (Becker et al., Reference Becker, Aden and Best2014; Ward, Reference Ward2003). Labov et al. (Reference Labov, Ash and Boberg2006) indicated that the West generally shows (uw), but not (ow)-fronting. (ow)-fronting is also an important variable dividing Northern and Southern Midland varieties of English. The acoustic plots of Youngest Seattleites' (uw) show extreme fronting, which is confirmed by the auditory analysis. Several of the speakers whose cot-caught data were included in Figures 2 to 4 display considerable (uw)-fronting. Speakers in the Seattle sample show little fronting of (ow). Auditory analysis confirms that (ow) is backed, similar to what is regarded as standard in American English. This would appear to differentiate this vowel from Oregon and California variants.
Mid-vowel monophthongization (bait, boat)
Ingle et al. (Reference Ingle, Wright and Wassink2005) found both (ey) and (ow) to show nearly no offgliding, which has been reported for this region before (Foster & Hoffman, Reference Foster and Hoffman1966; Luthin, Reference Luthin, Denning, Inkelas, McNair-Knox and Rickford1987), but not instrumentally substantiated. As was mentioned earlier, these vowels' trajectories are very static. Lack of an offglide makes these vowels, which are treated as historically diphthongal in U.S. English, stand out. Thus, it is interesting that these forms are phonetically the most steady-state in the system. Although they are monophthongal, their durations tend to be extremely long, making them more durationally similar to diphthongs than monophthongs ((ey): 270 to 300 msec in open syllables, 150 to 200 msec in closed ones; (ow): 150 to 200 msec in closed syllables, 129 to 299 msec in open ones; cf. averages in Appendix A). Objective demonstration of the absence of an offglide for this vowel is possible using modern techniques. Euclidean distance data indicate the magnitude of the slope of the trajectory of each formant; the larger the value, the longer the trajectory through F1 × F2 space (i.e., the more change in F1 or F2). Formant trajectory vectors for (ey) and (ow) were very short, indicating very little spectral movement from vowel onset to offset for either formant: (ey): ΔF1= −1.8 Hz/msec, ΔF2 = 5 Hz/msec; (ow): ΔF1 = .2 Hz/msec, ΔF2 = .0 Hz/msec. By comparison, corresponding vectors for the diphthongal vowel (aw) were much longer: (aw): ΔF1 = −6.9 Hz/msec, ΔF2 = −24.1 Hz/msec.Footnote 7 These confirm that a steady-state-like quality is typical in Seattle English for (ey, ow), making them quite different than these speakers' own truly diphthongal vowels.
Vowels before (r)
Foster and Hoffman (Reference Foster and Hoffman1966) noted that in words such as forest, horrid, orange, and warrant, [o] rather than [ɔ] or [a] was the most typical variant for their Seattle-area speakers. Furthermore, [o] was the predominant variant in (ohr) horse and hoarse (ɔhr)-class words, as well as in (uhr) moor-class words. The present findings are consistent with these earlier published reports. Auditory analysis confirms [o] to be the predominating vowel quality produced for each of these classes. These results also concur with respect to the occurrence of [ɝ] in hurry, worry, and courage. (ihr) beard, (ehr) bared, and (ahr) barred have nuclei near those of their non-pre-rhotic counterparts. Finally, these findings also concur with those of Reed (Reference Reed1952), who reported that speakers merged the three classes Mary, marry, and merry to [meərij] with a high-mid or a raised lower-mid variant of [ ] [mərij] with an offglide.
Having focused on those forms described in earlier dialectological and sociolinguistic literature as diagnostic features of PNWE or the West more generally, the presentation now turns briefly to the remaining members of the vowel system.
(iy) beat
As expected, this vowel is typically realized as General American [ij] or [iː] and is absolutely stable in the system, showing little interspeaker variation. Auditory analysis reveals that gliding is minimal, and there appears to be no significant phonetic variation associated with preceding or following consonantal context.
(i) bit
Not surprisingly, the predominant phonetic quality of this vowel was [ɪ], indicating a stable, traditional spectral location. (But, see Scanlon & Wassink, Reference Scanlon and Wassink2010, for discussion of a sample of African American Seattle speakers from Yesler Terrace, for whom there is proximity between this vowel and (ε) in prenasal contexts, the so-called pin-pen merger).
(æ) bat, (ε) bet
In what was arguably the most surprising research result of the study, the investigation of (æ) has turned out to require joint focus on two other vowels in the system, (ε) and (ey). The Seattle speakers showed widespread raising of (æ) and (ε), but restricted to prevelar environments, bag and beg. Nonprevelar forms typically showed the positions in acoustic space that are expected for General American English (see Figure 1), namely low-front for (æ), and low-mid for (ε). Speakers mainly differed in degree of raising of (æg)- and (εg)-class words.
Given that an initial literature review did not predict raising of (ε), study materials were not designed to allow study of (ey), (æ), and (ε) in entirely comparable following environments. It is possible, however, to examine data for a small sampling of forms that were included in the initial analysis.
F1 × F2 plots for one female representative from each of the three generations of Seattle speakers are shown in Figures 5, 6, and 7. For most speakers (both male and female), (æg) targets are extremely raised. A typical pattern is that of the oldest generation female whose data are plotted in Figure 5, in which bag tokens fall within the distribution of the larger (ε) class, making bag rhyme with beg (and auditory analysis suggests that some tokens of (æg) can sound raised as high as (ey)). Meanwhile, the prevelar subset of the (ε) class itself (labeled “ehg” in the figure), overlaps the (ey) category, making beg rhyme with bake. For some speakers of both genders, (εg) targets fall entirely within the distribution of (ey), as is illustrated in Figure 6 for a Middle-generation female speaker.Footnote 8 It was quite common for speakers to produce tag and bag as [tεːg] and [bεːg], respectively, while legs and peg surface as [leːgz] and [peːg] or [lːgz] and [pːg]. There was no raising in nonprevelar words, such as dead. (æg)-raising represents the clearest gender-related difference. Wassink, Squizzero, Scanlon, Schirra, and Conn (Reference Wassink, Squizzero, Scanlon, Schirra and Conn2009) reported that male speakers were more likely to raise both (æg) to [eːg] and (εg) to [e:g] or [ːg], while females were more likely to just raise (εg) to [e:g] or [ːg]. The vowel overlap data explored, in the section discussing merger, elucidates this pattern further. In terms of age, (æg)- and (εg)-raising are evident in speakers of all ages in the sample, even the oldest. For some speakers, such as the one presented in Figure 7, (æg) forms show a great deal of variability, reflected in the large size of the associated ellipse. Because vowel trajectory was found to be important to characterizing Seattle prevelar raising, further results for the (eyg, εg, æg) set will be considered in the following section.
(ey, εg, æg) for a female from the Older generation of Seattle speakers: Speaker 8 (Female, Gen 1). (εg): blue, (æg): pink.
(ey, εg, æg) for a female from the Middle generation of Seattle speakers: Speaker 1 (Female, Gen 2). (εg): blue, (æg): pink.
(ey, εg, æg) for a female from the Younger generation of Seattle speakers: Speaker 29 (Female, Gen 3). (εg): blue, (æg): pink.
Another surprising result is that a visual inspection of scatterplot data suggests that Youngest generation female speakers may be raising (eyC) (see, e.g., Speaker 29, Figure 7). For some Gen 3 speakers, the (eyC) distribution itself, including forms in nonprevelar contexts, overlaps with (iy).Footnote 9 It is unclear whether this is a regional phenomenon or a gendered trend. At present, it is noted that this pattern appears only in Youngest generation female speakers.
(u) put
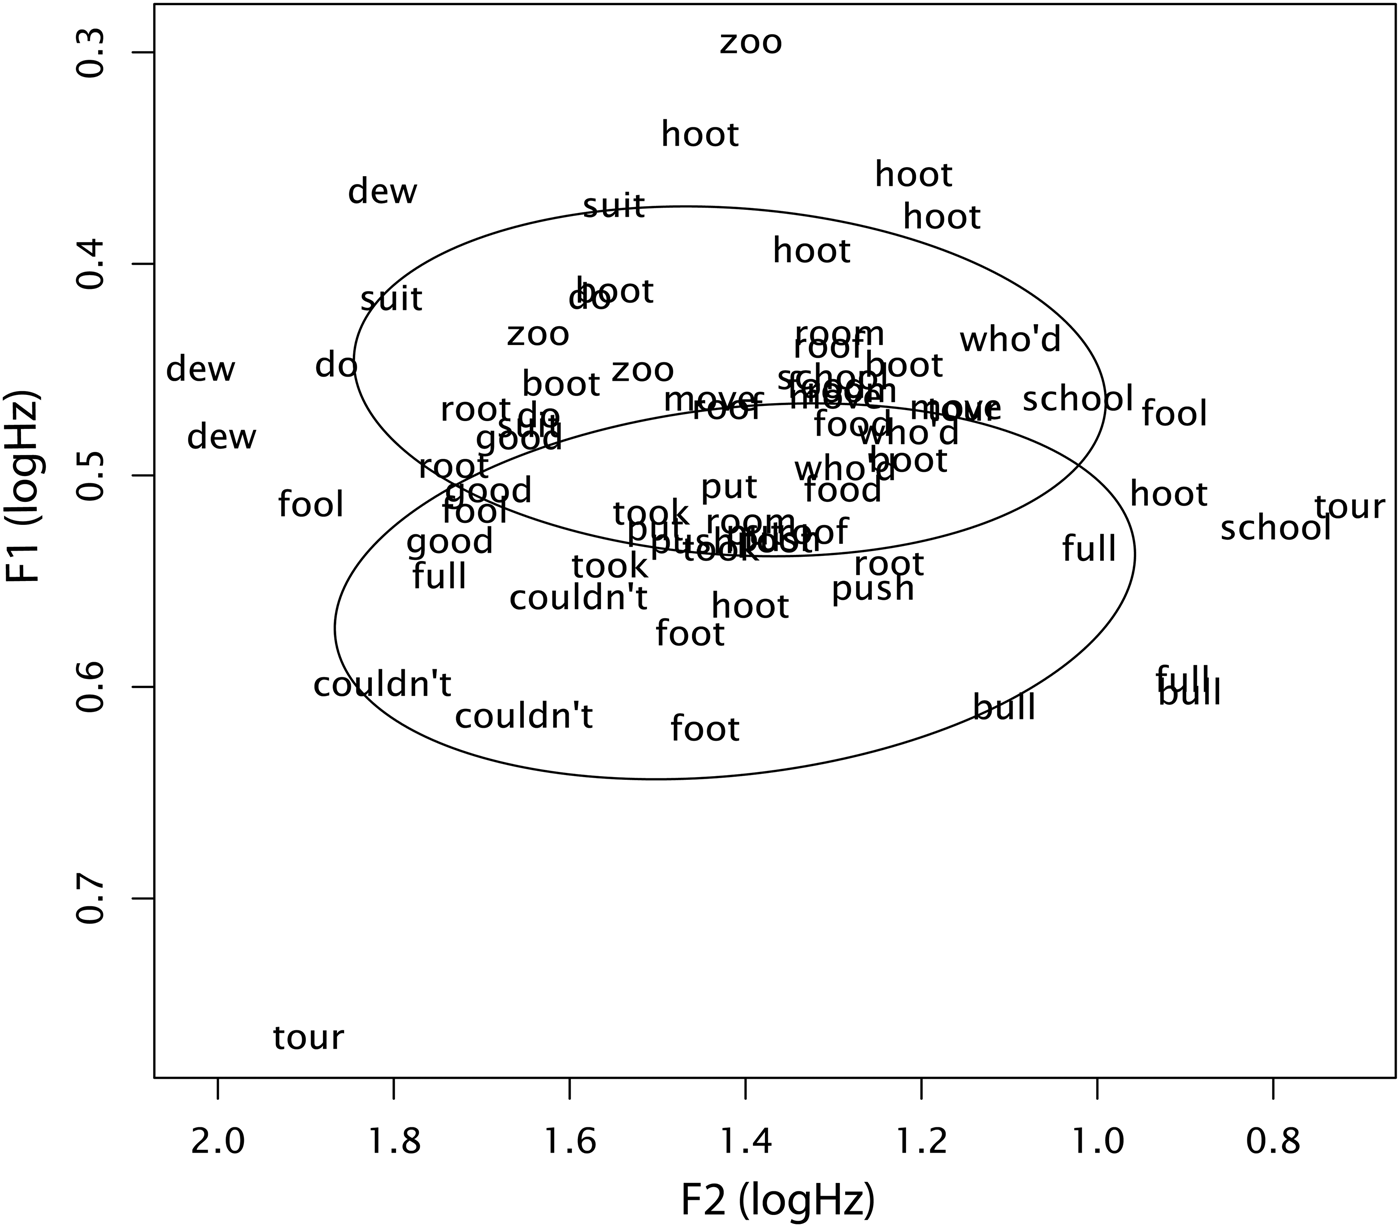
For most of the present sample, (u) exhibits a fairly standard position, showing little of the fronting that would be expected for a California-shifted variant. It displays a lower F2 than the nucleus of (uw). However, it is fronted for two speakers (one Gen 2 male and one Gen 1 female). Reed (Reference Reed1952:188) had little to say about this vowel, except to note use of [ʊ] in two “miscellaneous” words in his report, roof and soot. Speakers in the present sample showed variation between [u] and [ʊ], although most exhibited [ʊ] in both word classes (cf. Speaker 24 in Figure 8, who produces a similar variant for, e.g., root and push).
/uw/~/ʊ/ for a female from the Oldest Generation cohort (Speaker 24). Root and roof tokens are lowered and fronted relative to the /uw/ category forms.
(oy) boy, (aw) bout, (ay) bite
These vowels are stable and fairly standard in all respects. (oy) is a diphthong with a back nucleus near [o] and a front upglide. The nuclei for both (ay) and (aw) originate in the low, central region of acoustic space. However, (ay) for some speakers tends to be produced with a more open (low) nucleus than (aw). As has already been mentioned, these three are the only phonetically diphthongal forms among the set of those regarded as traditional phonological diphthongs in U.S. English, as Seattle (ey) and (ow) show much shorter, monophthongal trajectories.
Merger in Seattle English?
This vowel system presentation revealed that prevelar (æg) and (εg) are raising along the front periphery. But is this raising substantial enough to be considered merger? Merger was further investigated using two methods: a geometric method that yields a fraction indicating overlap between two vowel categories at midpoint, and a statistical method, smoothing spline ANOVA, which quantifies variation at multiple points along vowel trajectories. Such methods can highlight phonetic differences that might aid speaker-listeners in differentiating forms that appear to be merged otherwise, such as subtle height differences, offglide differences, or systematic differences in phonetic environment effects.
Vowel overlap fraction calculation
Figure 9 (Gen 1, Speaker 26) illustrates one of the typical instances already described in which (æg) is raised, but not enough to overlap with (ey) (εg is not shown). As was mentioned, even some speakers in the Oldest generation cohort raise prevelar (æg) substantially. This indicates that this raising pattern dates back at least two generations. The figure shows that her distribution means and tails are sufficiently separate to keep the vowel categories apart. But how much are the vowel pairs overlapping and is her pattern of overlap different from the younger speakers in the sample? Pairwise overlap fractions were calculated for all three vowel pairings of interest: Ωey~eg = .16, Ωey~aeg = .02, Ωeg~aeg = .68. For Speaker 26, both (εg) and (æg) are raising toward (ey), but not to the point of merger: (ey~æg) vowels (pictured) overlap at only 2%, which is classified as no overlap. Her (εg~æg) vowels overlap (not pictured), however, by 68%, which is classified as partially overlapping.
VOIS3D best-fit ellipses for vowels (ey, æg), Oldest Gen F Speaker 26. Ωey~eg = .16, Ωey~aeg = .02, Ωeg~aeg = .68.
Comparing complete overlap patterns between generations provides a conservative indication of the progression of merger in apparent time. It establishes firmly that merger, determined as complete spectral overlap, is indeed observed for some speakers. Table 3 shows the percentage of speakers for each age cohort for whom (æg) completely overlaps at vowel midpoint with its home distribution, nonprevelar (æ), and with other neighboring classes along the front periphery (ε, and ey). Note that percentages do not represent Ω values, but rather the percentage of speakers in each age cohort only where complete overlap is observed with the other vowel in the pair.
Percentage of speakers in each generational cohort who show complete spectral overlap for (æg) with a neighboring vowel at midpoint

Overlap between (æg) and its home distribution (æ) is expected. It is evident that in each generation most speakers—60% to 63% in each cohort—completely overlap (æ) with (æg). But, for approximately 40% of speakers in each age cohort, (æg) lies in a different distribution than nonprevelar (æ). The fact that Oldest cohort speakers display this pattern is confirmatory evidence that the change was already underway when their linguistic systems were set. Raising to (εg) was found in the Oldest generation, as was mentioned, but these values ranged from Ω(εg~æg) = 29% to 74%, which all fall below the conservative cutoff for complete overlap. So, from the community view in apparent time, it appears that raising has already been underway for some time, but is now becoming more extensive. As age decreases, (æg) is rising to overlap with higher vowels along the left periphery. Pearson coefficients showing correlations between age and the amount of complete overlap observed for (æg) and its neighbors are presented in Table 4. A moderate positive correlation (r = .30) indicates that Youngest generation female speakers appear to be raising (æg) to meet (eyC). The similarity between Gens 2 and 3 in overlapping (εg~æg) is reflected in a nonsignificant correlation (r = -.05), which confirms the point that (εg~æg) overlap has been established in this community for some time, but it is becoming more extensive.
Pearson coefficients (r) showing the influence of age on overlap fraction for (æg) with a neighboring vowel at midpoint

Smoothing Spline ANOVA
Freeman (Reference Freeman2013) presented an independent analysis of 20 speakers from Washington state, whom she studied using PNWE protocols. Five of these were from the initial PNWE sample, re-recorded with an expanded word list that included more prevelar forms. These subjects were from the Middle and Youngest generation cohorts only: no Oldest generation cohort speakers were recontacted. Her data shed light on the extent of raising for these younger speakers. Her F1 × F2 plots of midpoint data showed that F1 for nonprevelar (eyC) was much lower (indicating it is a higher vowel, as expected) throughout its trajectory than any other vowel in the (æg, eyg, εg) set. However, the nucleus of prevelar (eyg) had a higher F1 (was lower) than canonical [e:]. Freeman's analysis of more forms provides a fuller picture, but leaves open questions, as well. First, her restudy concurred with findings reported here for the original sample, that F1 for (æg) rises toward (εg), but is not as high as (eyg). The (æg) distribution was at least partially overlapping with (eyg-εg) (which she grouped for analysis because these fully overlapped), signifying that while some (æg) forms were raised, other forms were positioned lower—toward (æC), so that the overall range of (æg) was highly variable. She concluded that Youngest and Middle-aged speakers' target for (æg) was a raised [ː], rather than [eː]. This is interesting because the local stereotype is that bag in Seattle is pronounced bayg, in other words, that the nucleus is [eː]. Freeman then examined vowel trajectory data (in which each vowel is represented by F1 and F2 taken at three points, 20%, 50%, 80% through the vowel), using Smoothing Spline ANOVA (Fruehwald, Reference Fruehwald2010; Koops, Reference Koops2010; Wassink & Koops, Reference Wassink and Koops2013). Her careful analysis showed that for these younger speakers, bag (æg) and beg (εg) class forms tended to have a more sloping trajectory than canonical bait (eyC) ones. Nonprevelar (æC) and (εC) exhibited more steady-state trajectories. Both (æg) and (εg), in other words, appeared to have offglides (look and sound diphthongal), while their nonprevelar counterparts, did not.Footnote 10 Freeman reported that F1 for (æg) showed the greatest variation between age and gender groupings; F1 trajectories rose so that by offset, they coincided with F1 of nonprevelar (ε) for Middle-aged females and Younger males and females alike. But, for the Middle-aged males, F1 sloped higher, eventually reaching (eyg) by offset. She asked whether this finding, that Middle-generation (male) speakers might be more merged than younger ones, suggests that prevelar raising may be reversing. This possibility cannot be ruled out. But there are at least two reasons that a declaration of reversal seems premature. First, Freeman's dataset includes only the younger two of the three generations sampled. No data were presented for Oldest generation speakers that might help distinguish reversal of the change from interspeaker variability. Second, the significance of the age difference found (and possible age-by-gender interaction) was not confirmed statistically. The trajectory analysis bears continued study. Freeman (Reference Freeman2013) and Wassink (Reference Wassink2014) both raised the possibility that younger speakers may be raising by a different strategy than their elders: one that relies on diphthongization more than a raised vowel midpoint or nucleus. Indeed, Freeman points out that steeper slopes for the prevelar diphthongs may help to differentiate prevelars from nearby plain vowels. If this is so, then raising may appear differently in different speakers: for some, raising is evident at midpoint, for others, raising (and possibly fronting) appears in the offglide. Auditory inspection of the data, as mentioned, does suggest that these forms sound raised. These critical issues require further investigation. Furthermore, current research underway in our laboratory investigates interspeaker trajectory differences as well as the perception of these forms. Both will help to shed light on the issue of discriminability of forms distinguished by slope of F1 (and/or F2), and within-speaker strategies for vowel differentiation.
To the extent that variation in apparent time reliably indicates the direction of community-wide change, these data suggest that (æg) and (εg) are changing in ways Reed could not anticipate given the data available to him at the time. In particular, Reed (Reference Reed1961:560) noted that Washington speakers' /ε/ displayed the typical North American pronunciation of [ε] in ten, egg, head. He was aware that pronunciations occasionally varied: /ε/~/e/. The raised form, which he called /e/, it may be concluded, was infrequent in egg in his day. Forty years later, this study has found that the vowel in egg is almost categorically raised. Similarly, Reed (Reference Reed1961) listed bag, glass, half, and aunt, (married) as typically realized with a vocalic nucleus of [æ]. Bag rarely occurs with [æ] in this corpus. It must be concluded that a raised [æg] was not noticeable in Reed's day, while by contrast, such raising is very typical in the present day.
CONTINUITY AMONG WESTERN VARIETIES: SEATTLE AND ITS NEIGHBORS
A final word is in order regarding dialect differences between Seattle and its neighbors to the north and south. As was noted, the West has been treated as a regional unity, because subregions share advancement in the cot /a/–caught /ɔ/ merger (e.g., the Third Dialect, cf. Labov, Reference Labov and Eckert1991). While the overall similarities do indeed apply, substantial vocalic differences are the principal reason to view the West as internally differentiated.Footnote 11
The data presented here show the PNW to be quite distinct from California. The PNW displays only one of the stereotypically Californian vowel-system markers mentioned in Labov et al. (Reference Labov, Ash and Boberg2006): (uw)-fronting. Further features of the Northern California shift (sometimes referred to as Canadian shift) reported by Clarke, Elms, and Youssef (Reference Clarke, Elms and Youssef1995) include backing of the vowels involved in the cot /a/–caught /ɔ/ merger, concomitant with backing or retraction of (æ) bag and lowering of (e) bet (see also Hinton, Moonwomon, Bremner, Luthin, Van Clay, Lerner, & Corcoran, Reference Hinton, Moonwomon, Bremner, Luthin, Van Clay, Lerner and Corcoran1987; Moonwomon Reference Moonwomon, Denning, Inkelas, McNair-Knox and Rickford1987, Reference Moonwomon1991). The PNWE data clearly show no backing of (æ). It has been demonstrated that extreme fronting and raising of (æ) in prevelar environments is typical in metro Seattle. Some preliminary information is available for nonprevelar environments, indicating that retraction is not found in other environments, either, beyond the centralizing phonetic effect of /l/. Riebold (Reference Riebold2012) examined data for a small set of speakers from Corvallis, Oregon. He found backing of (æ) in prelateral contexts, for example, pal, as might be expected due to the well-known tendency for lateral /l/ to induce centralization. Otherwise, the mean F2 for (æ) was very similar to that of (ε), indicating that (æ) is not backed in nonprevelar environments. Furthermore, (ε) itself shows no tendency to lower or back. Seattle is not showing the backing characteristic of the California Shift. Thus, raising of (æ) runs counter to the (æ)-retraction found in neighboring shift areas (Boberg, Reference Boberg2005; Clarke et al., Reference Clarke, Elms and Youssef1995; D'Arcy, Reference D'Arcy2002; De Decker, Reference De Decker2001).Footnote 12 It is certainly interesting that while backing of (æ) has been well-established for neighbors to both the north and south of Seattle, a different phenomenon is present in the city itself. This vowel may be functioning as an important marker, distinguishing subregions in the West.
DISCUSSION
Taken together, the results of this study paint the metro Seattle area as both quintessentially standard as a U.S. dialect and a little bit different from other dialects. In production, these Seattleites are solidly part of the West with respect to certain parts of their vowel system (Labov et al., Reference Labov, Ash and Boberg2006). The system shows strong evidence of cot /a/–caught /ɔ/ merger. The area further appears to be solidly a member of the Western U.S. group of dialects in showing fronting of (uw), although Seattle still distinguishes itself from its California cousins in showing a far less-advanced (ow), and from its Californian and Canadian ones in lack of (æ)- or (ε)-retraction. On the other hand, Seattle English appears to be a bit different from other U.S. dialects. It displays a very monophthongal (ey) and (ow) (also distinct from the fronted nucleus of (ow) that is an emerging feature of present-day U.S. English). Perhaps most strikingly, it exhibits a raised set of front vowels (æg, εg) that appear to be interconnected. Seattle, then, does not boast a system-wide set of regionally unique markers (such as the rotation of the lax subsystem vowels in the Northern Cities, for example), but a complex constellation of distinguishing features. This is not unusual for a region that underwent relatively recent dialect contact (see Wassink, submitted, for discussion of Seattle as a region growing out of dialect contact). But, the overall configuration is something new. Two hundred years after Lewis and Clark's historic voyage to the Pacific Coast, has the Northwest been established long enough to display unique dialect features? It appears the answer is, yes.
APPENDIX A
Overall means for vowel duration (in milliseconds), and for the first two formants (F1, F2 in Hertz) at three measurement points (20%, 50%, 80%). Female speakers pooled across generation.