1 Introduction
The spreading process of an ensemble of particles advected by a turbulent fluid depends on the stirring properties of the velocity field, which can be quantified by its strain rate (Batchelor Reference Batchelor1952b ; Garrett Reference Garrett1983) and its Lagrangian derivatives (Hua, McWilliams & Klein Reference Hua, McWilliams and Klein1998; Klein, Hua & Lapeyre Reference Klein, Hua and Lapeyre2000). There are intricate relations between the cascades of two-dimensional (2D) or three-dimensional (3D) turbulence and the dispersion of passive particles (see e.g. Falkovich et al. Reference Falkovich, Gaw edzki and Vergassola2001; Sawford Reference Sawford2001; Salazar & Collins Reference Salazar and Collins2009). In 2D turbulence, relative enstrophy is transferred towards small scales through a (marginally) non-local turbulent cascade for which straining processes at small scales are driven by large-scale eddies (Ohkitani Reference Ohkitani1990; Oetzel & Vallis Reference Oetzel and Vallis1997). In contrast, kinetic energy is transferred towards large scales through a local turbulent cascade (Kraichnan Reference Kraichnan1967; Boffetta & Ecke Reference Boffetta and Ecke2012). As a result, one can expect that the large-scale strain will dominate the dispersion properties in the range of scales corresponding to the direct enstrophy cascade, while the dispersion will be affected by local scales in the inverse cascade range (Kowalski & Peskins Reference Kowalski and Peskins1981).
Using self-similarity arguments, Morel & Larcheveque (Reference Morel and Larcheveque1974) and Bennett (Reference Bennett1984) proposed a relation between the slope of the kinetic energy spectrum and the laws of relative dispersion between particle pairs. They distinguished two dynamical regimes. In the first one, qualified as ‘local’, the dispersion laws at a particular length scale
 $l$
depend only on flow statistics at that length scale. This is the case for kinetic energy spectra shallower than
 $k^{-3}$
(with
 $k$
the horizontal wavenumber). For a kinetic energy spectrum in
 $k^{-5/3}$
, based on self-similarity arguments of the turbulent cascade, one would obtain the Richardson dispersion law
 $y^{2}\propto t^{3}$
, where
 $y$
is the distance between a pair of particles. On the other hand, in the second ‘non-local’ regime, corresponding to kinetic energy spectra steeper than
 $k^{-3}$
, the dispersion laws should depend on the largest and dominant scales of the fluid (Bennett Reference Bennett1984). In this case,
 $y^{2}$
would grow exponentially in time.
This distinction is discussed in a geophysical context by Özgökmen et al. (Reference Özgökmen, Poje, Fischer, Childs, Krishnan, Garth, Haza and Ryan2012), who examined the dispersion of particles in oceanic flows with more or less vigorous submesoscales (scales below the Rossby radius of deformation). For weakly intensified submesoscales, whose kinetic energy spectrum is steeper than
 $k^{-3}$
, relative dispersion is found to be fairly scale-independent. In that situation, relative dispersion characteristics depend not on the dispersion scale but on much larger ones. For more intensified submesoscales, the kinetic energy spectrum is shallower than
 $k^{-3}$
and the dispersion laws are a function of the dispersion scale (Özgökmen et al.
Reference Özgökmen, Poje, Fischer, Childs, Krishnan, Garth, Haza and Ryan2012). Berti & Lapeyre (Reference Berti and Lapeyre2014) obtained a different result in a situation where the kinetic energy spectrum is close to
 $k^{-2}$
, for which dispersion could be expected to be local. They observed that the large-scale stirring was responsible for the formation of a considerable amount of submesoscales, even if small-scale eddies determined the spatial distribution of a tracer at very small scales (Berti & Lapeyre Reference Berti and Lapeyre2014). This suggests that the locality of the stirring or dispersion might have a non-obvious correspondence with energy spectra in 2D turbulent fluids. This was also noted by Nicolleau & Yu (Reference Nicolleau and Yu2004), who examined particle pair dispersion statistics in 3D kinematic simulations, focusing on the dependence on the kinetic energy spectral slope. However, this last result should be taken with some caution, as kinematic simulations do not take into account the sweeping of small-scale eddies by large-scale ones (Thomson & Devenish Reference Thomson and Devenish2005).
Here a caveat has to be given since turbulence is characterized in itself not by kinetic energy spectra, but by energy cascades between scales. Self-similarity arguments can then be given, and allow one to relate the dispersion laws to the local flux of energy and to the local length scale (see e.g. Batchelor Reference Batchelor1950). In general, self-similarity theories based on the kinetic energy spectral slope give the same result as theories based on the basic characteristics of the turbulence (the existence of an inertial range and of a local energy flux). The reason is that the kinetic energy spectral slope is also a by-product of self-similarity arguments on the energy cascade.
Several studies have been devoted to the analysis of relative dispersion from experimental data and numerical simulations, focusing on the correspondence between dispersion laws and energy spectra. In the oceanographic context, numerous studies have looked for scaling laws for dispersion of floats or surface drifters. In particular there was some evidence of a
 $t^{3}$
power law in the North Atlantic (LaCasce & Bower Reference LaCasce and Bower2000; Ollitrault, Gabillet & Colin de Verdière Reference Ollitrault, Gabillet and Colin de Verdière2005) and in the Gulf of Mexico (LaCasce & Ohlmann Reference LaCasce and Ohlmann2003). The existence of an exponential regime that would suggest a direct enstrophy cascade is more delicate (LaCasce & Ohlmann Reference LaCasce and Ohlmann2003; Ollitrault et al.
Reference Ollitrault, Gabillet and Colin de Verdière2005; Koszalka, LaCasce & Orvik Reference Koszalka, LaCasce and Orvik2009). More generally, Lumpkin & Elipot (Reference Lumpkin and Elipot2010) discuss local and non-local dispersion regimes in different sets of surface drifters data in the North Atlantic Ocean through different Lagrangian indicators. In particular, they find a regime of enhanced relative dispersion at small scales that would suggest a kinetic energy spectrum as shallow as
 $k^{-2}$
at submesoscales. Such a regime has also been observed in a series of other recent works dealing with surface drifters data in different regions of the world oceans (Ollitrault et al.
Reference Ollitrault, Gabillet and Colin de Verdière2005; Berti et al.
Reference Berti, dos Santos, Lacorata and Vulpiani2011; Schroeder et al.
Reference Schroeder, Chiggiato, Haza, Griffa, Özgökmen, Zanasca, Molcard, Borghini, Poulain and Gerin2012). A detailed review of analogous results can be found in LaCasce (Reference LaCasce2008). Concerning atmospheric flows, relative dispersion characteristics were examined by different authors using trajectories of pressure balloons in the stratosphere (e.g. Lin Reference Lin1972; Morel & Larcheveque Reference Morel and Larcheveque1974; Er-El & Peskin Reference Er-El and Peskin1981) to assess the possibility of a direct enstrophy cascade in the atmosphere. Owing to the limited availability of data and the anisotropy of the flow, results were not completely conclusive when examining dispersion as a function of time. Lacorata et al. (Reference Lacorata, Aurell, Legras and Vulpiani2004) revisited the data of Morel & Larcheveque (Reference Morel and Larcheveque1974) using finite-size Lyapunov exponents (Aurell et al.
Reference Aurell, Boffetta, Crisanti, Paladin and Vulpiani1997) and found a dispersion behaviour compatible with a
 $k^{-5/3}$
kinetic energy spectrum. Using trajectories from a Lagrangian dispersion model employing reanalysis wind fields, Graff, Guttu & LaCasce (Reference Graff, Guttu and LaCasce2015) found an exponential growth consistent with non-local dispersion in the upper troposphere.
Relative dispersion in numerical simulations of 2D turbulence has been investigated both in the inverse energy cascade and in the direct enstrophy cascade. In the inertial range of the inverse energy cascade, it was found that relative dispersion nearly followed Richardson’s law (Babiano et al. Reference Babiano, Basdevant, Roy and Sadourny1990; Boffetta & Celani Reference Boffetta and Celani2000; Poje et al. Reference Poje, Hazab, Özgökmen, Magaldi and Garraffo2010). This is also the case for laboratory experiments reported in Jullien, Paret & Tabeling (Reference Jullien, Paret and Tabeling1999). In the inertial range of the direct enstrophy cascade, the exponential law was more difficult to observe in direct numerical simulations (Kowalski & Peskins Reference Kowalski and Peskins1981; Babiano et al. Reference Babiano, Basdevant, Roy and Sadourny1990) and in experiments (Jullien Reference Jullien2003). Laboratory experimental measurements based on a 2D fluid driven by Faraday waves allowed the observation of Richardson’s regime (Von Kameke et al. Reference Von Kameke, Huhn, Fernández-García, Muñuzuri and Pérez-Muñuzuri2011) in the inverse energy cascade. For electromagnetically forced fluids, Rivera & Ecke (Reference Rivera and Ecke2005) observed doubling-time statistics (Aurell et al. Reference Aurell, Boffetta, Crisanti, Paladin and Vulpiani1997) consistent with the exponential law predicted in the direct enstrophy range and a power-law regime in the inverse energy cascade. Many of these studies found difficulties in observing a clear relation between the kinetic energy spectral slope and relative dispersion. One reason invoked is the dependence of scaling laws on the initial particle pair separation. This issue was discussed in detail by Babiano et al. (Reference Babiano, Basdevant, Roy and Sadourny1990) and Boffetta & Sokolov (Reference Boffetta and Sokolov2002) with 2D direct numerical simulations, and by Nicolleau & Yu (Reference Nicolleau and Yu2004) using kinematic simulations in three dimensions and Ollitrault et al. (Reference Ollitrault, Gabillet and Colin de Verdière2005) with floats in the ocean. Other reasons may be invoked, such as the presence of coherent vortices (Jullien Reference Jullien2003).
The subject of the present paper is to study a class of 2D flows, the so-called
 $\unicode[STIX]{x1D6FC}$
-turbulence models (Pierrehumbert, Held & Swanson Reference Pierrehumbert, Held and Swanson1994), which share the common feature of exhibiting both direct and inverse cascades of an active tracer. One characteristic of these models is that the kinetic energy spectral slope depends on the parameter
 $\unicode[STIX]{x1D6FC}$
(Watanabe & Iwayama Reference Watanabe and Iwayama2004) and that energy fluxes are supposed to be driven by local scales for small
 $\unicode[STIX]{x1D6FC}$
and non-local scales for large
 $\unicode[STIX]{x1D6FC}$
(Pierrehumbert et al.
Reference Pierrehumbert, Held and Swanson1994). Hence, one can try to see if there is some relation between the non-locality of the spectral energy transfers and the non-locality of particle dispersion. Two important models of geophysical interest belong to this class of
 $\unicode[STIX]{x1D6FC}$
-turbulence: the barotropic quasi-geostrophic (QGBT) model and the surface quasi-geostrophic (SQG) model (Held et al.
Reference Held, Pierrehumbert, Garner and Swanson1995; Lapeyre Reference Lapeyre2017). On the one hand, in the QGBT model, relative vorticity is conserved along the geostrophic flow; on the other hand, in the SQG model, surface temperature is conserved (along the geostrophic flow) and potential vorticity is constant within the bulk of the fluid. Both models are relevant, in particular, for the dynamics of oceanic flows with meso- and submesoscale motions, as the SQG model resembles what occurs at the ocean surface while the QGBT model resembles what occurs in the interior (Klein et al.
Reference Klein, Lapeyre, Roullet, Le Gentil and Sasaki2011). Phenomenologically, QGBT turbulence (respectively, SQG turbulence) is related to kinetic energy spectra in
 $k^{-3}$
(respectively
 $k^{-5/3}$
) in the direct cascade of enstrophy (respectively temperature variance).
The remainder of this paper is organized as follows. After a short review of the phenomenology of the relation between 2D turbulence and relative dispersion (§ 2), we present the numerical model that is used in our study (§ 3). Then § 4 is dedicated to the properties of the generalized 2D turbulent flows, while § 5 concerns the statistics of relative dispersion in
 $\unicode[STIX]{x1D6FC}$
-turbulence. Conclusions are drawn in § 6.
2 Theory
2.1 Models of two-dimensional turbulence
In the QGBT model, relative vorticity
 $\unicode[STIX]{x1D701}$
is a Lagrangian conserved tracer advected by the geostrophic flow,
 $$\begin{eqnarray}\frac{\unicode[STIX]{x2202}\unicode[STIX]{x1D701}}{\unicode[STIX]{x2202}t}+\boldsymbol{u}\boldsymbol{\cdot }\unicode[STIX]{x1D735}\unicode[STIX]{x1D701}=0,\end{eqnarray}$$
where
 $u=-\unicode[STIX]{x2202}\unicode[STIX]{x1D713}/\unicode[STIX]{x2202}y$
and
 $v=\unicode[STIX]{x2202}\unicode[STIX]{x1D713}/\unicode[STIX]{x2202}x$
are the two components of the incompressible velocity field
 $\boldsymbol{u}$
,
 $\unicode[STIX]{x1D713}$
is the streamfunction and
 $\unicode[STIX]{x1D701}=\unicode[STIX]{x2202}v/\unicode[STIX]{x2202}x-\unicode[STIX]{x2202}u/\unicode[STIX]{x2202}y=\unicode[STIX]{x1D735}^{2}\unicode[STIX]{x1D713}$
. In horizontal Fourier space, we can write this last equation as
 $$\begin{eqnarray}\widehat{\unicode[STIX]{x1D701}}=-k^{2}\,\widehat{\unicode[STIX]{x1D713}},\end{eqnarray}$$
where the hat stands for the Fourier transform and
 $k$
is the horizontal wavenumber modulus.
Another classical quasi-geostrophic (QG) model is the SQG model, whose potential vorticity is uniform throughout the interior of the fluid (Held et al.
Reference Held, Pierrehumbert, Garner and Swanson1995; Lapeyre Reference Lapeyre2017). The system simplifies into a form for which surface temperature
 $\unicode[STIX]{x1D703}$
is a Lagrangian conserved tracer,
 $$\begin{eqnarray}\frac{\unicode[STIX]{x2202}\unicode[STIX]{x1D703}}{\unicode[STIX]{x2202}t}+\boldsymbol{u}\boldsymbol{\cdot }\unicode[STIX]{x1D735}\unicode[STIX]{x1D703}=0,\end{eqnarray}$$
with
 $\boldsymbol{u}$
defined as above and
 $$\begin{eqnarray}\widehat{\unicode[STIX]{x1D703}}=-k\,\widehat{\unicode[STIX]{x1D713}}\end{eqnarray}$$
(see Held et al. (Reference Held, Pierrehumbert, Garner and Swanson1995) for details of the derivation). Here we considered the non-dimensional form of the equation so as to have a formal resemblance to (2.2).
Starting from these two models, it is possible to consider generalized models, where
 $q$
is an active tracer obeying
 $$\begin{eqnarray}\frac{\unicode[STIX]{x2202}q}{\unicode[STIX]{x2202}t}+\boldsymbol{u}\boldsymbol{\cdot }\unicode[STIX]{x1D735}q=0\end{eqnarray}$$
and
 $$\begin{eqnarray}\widehat{q}=-k^{\unicode[STIX]{x1D6FC}}\,\widehat{\unicode[STIX]{x1D713}},\end{eqnarray}$$
with
 $\unicode[STIX]{x1D6FC}$
a fixed parameter (Pierrehumbert et al.
Reference Pierrehumbert, Held and Swanson1994). The case of
 $\unicode[STIX]{x1D6FC}=2$
corresponds to the QGBT model and
 $\unicode[STIX]{x1D6FC}=1$
gives the SQG model.
Such models possess generalized energies and enstrophies that are quadratic invariants. The generalized enstrophy expresses the variance of the scalar field
 $q$
. Our interest will be focused on the cascade of this quantity to small scales. From heuristic arguments, its spectral flux
 $\unicode[STIX]{x1D702}$
is set by
 $\unicode[STIX]{x1D702}\propto \unicode[STIX]{x1D70E}_{k}k\,{\mathcal{Q}}(k)$
, where
 $\unicode[STIX]{x1D70E}_{k}$
is the strain rate responsible for the stirring of the scalar at scale
 $1/k$
and
 ${\mathcal{Q}}(k)$
is the shell-averaged spectral density of generalized enstrophy. This last quantity is related to the global tracer variance through
 $Q=\langle q^{2}\rangle =\int _{0}^{\infty }{\mathcal{Q}}(k)\,\text{d}k$
, the angle brackets indicating an average over space. Assuming that
 $\unicode[STIX]{x1D70E}_{k}$
depends only on the flow properties at the same local scale
 $k$
and in the inertial range of the direct cascade of tracer variance, from
 $\unicode[STIX]{x1D702}=\text{const.}$
one obtains the (shell-averaged) kinetic energy spectrum
 $$\begin{eqnarray}E(k)\propto \unicode[STIX]{x1D702}^{2/3}k^{-(4\unicode[STIX]{x1D6FC}+1)/3}\end{eqnarray}$$
for
 $\unicode[STIX]{x1D6FC}<2$
(Pierrehumbert et al.
Reference Pierrehumbert, Held and Swanson1994), where
 $E(k)$
is related to the total kinetic energy
 ${\mathcal{E}}$
through
 ${\mathcal{E}}=\int _{0}^{\infty }E(k)\,\text{d}k$
. As the scaling law was obtained taking into account only local quantities (at scale
 $k$
), this regime is associated with local transfers of generalized enstrophy. For
 $\unicode[STIX]{x1D6FC}\geqslant 2$
the spectral flux no longer explicitly depends on the local wavenumber
 $k$
, and
 $$\begin{eqnarray}E(k)\propto \unicode[STIX]{x1D702}^{2/3}k^{1-2\unicode[STIX]{x1D6FC}}\end{eqnarray}$$
(Pierrehumbert et al. Reference Pierrehumbert, Held and Swanson1994; Watanabe & Iwayama Reference Watanabe and Iwayama2004). This regime is associated with non-local generalized enstrophy transfers.
One important consequence of (2.7) is that the strain rate (responsible for the particle pair separation) between
 $1/k$
and
 $2/k$
behaves as
 $k^{2(2-\unicode[STIX]{x1D6FC})/3}$
for
 $\unicode[STIX]{x1D6FC}<2$
. For these values of
 $\unicode[STIX]{x1D6FC}$
, the exponent
 $2(2-\unicode[STIX]{x1D6FC})/3$
is positive and the dispersion of particles separated by a given distance should be controlled by eddies of comparable size. This would be associated with the ‘local dispersion’ regime. In contrast, for
 $\unicode[STIX]{x1D6FC}\geqslant 2$
, dispersion will be essentially governed by eddies at the largest scales, a regime corresponding to ‘non-local dispersion’. However, one should remember that the presence of nonlinear vortices generally tends to steepen the spectra, so that such phenomenological scalings are only an indication of what could be observed.
2.2 Relative dispersion
The dispersion of passive particles in a turbulent fluid has been widely studied and here we only present its main properties. The reader is referred to reviews by Falkovich et al. (Reference Falkovich, Gaw edzki and Vergassola2001), Sawford (Reference Sawford2001), Bennett (Reference Bennett2006) and Salazar & Collins (Reference Salazar and Collins2009) for broader discussions.
Let us consider
 $N$
particles whose positions at time
 $t$
are denoted by
 $\boldsymbol{x}_{\boldsymbol{i}}(t)$
with
 $i=1,\ldots ,N$
. Let us examine the pairs
 $(i,j)$
satisfying
 $|\boldsymbol{x}_{\boldsymbol{i}}(0)-\boldsymbol{x}_{\boldsymbol{j}}(0)|=y_{0}$
. Then relative dispersion is defined as
 $$\begin{eqnarray}\langle y^{2}(t)\rangle =\langle |\boldsymbol{x}_{\boldsymbol{ i}}(t)-\boldsymbol{x}_{\boldsymbol{j}}(t)|^{2}\rangle ,\end{eqnarray}$$
where
 $\langle ~\rangle$
is the average over all of these pairs of particles. The vector
 $\boldsymbol{y}(t)=\boldsymbol{x}_{\boldsymbol{i}}(t)-\boldsymbol{x}_{\boldsymbol{j}}(t)$
is the separation vector between particles
 $i$
and
 $j$
, and
 $y^{2}=|\boldsymbol{y}|^{2}$
. From this, relative diffusivity can be computed as
 $$\begin{eqnarray}K_{rel}(t)=\frac{1}{2}\frac{\text{d}\langle y^{2}(t)\rangle }{\text{d}t}=\langle \unicode[STIX]{x1D6FF}\boldsymbol{v}(t)\boldsymbol{\cdot }\boldsymbol{y}(t)\rangle ,\end{eqnarray}$$
with the relative velocity defined by
 $\unicode[STIX]{x1D6FF}\boldsymbol{v}(t)=\text{d}\boldsymbol{x}_{\boldsymbol{i}}/\text{d}t-\text{d}\boldsymbol{x}_{\boldsymbol{j}}/\text{d}t=\boldsymbol{v}(\boldsymbol{x}_{\boldsymbol{i}}(t),t)-\boldsymbol{v}(\boldsymbol{x}_{\boldsymbol{j}}(t),t)$
. Diffusivity can be rewritten as
 $$\begin{eqnarray}\frac{1}{2}\frac{\text{d}\langle \,y^{2}(t)\rangle }{\text{d}t}=\langle \unicode[STIX]{x1D6FF}\boldsymbol{v}(t)\boldsymbol{\cdot }\boldsymbol{y}_{0}\rangle +\int _{0}^{t}\langle \unicode[STIX]{x1D6FF}\boldsymbol{v}(t)\boldsymbol{\cdot }\unicode[STIX]{x1D6FF}\boldsymbol{v}(\unicode[STIX]{x1D70F})\rangle \,\text{d}\unicode[STIX]{x1D70F},\end{eqnarray}$$
with
 $\boldsymbol{y}_{0}=\boldsymbol{y}(t_{0})$
. Assuming that relative velocity is independent of the particle pair separation, i.e.
 $\langle \,\unicode[STIX]{x1D739}\boldsymbol{v}(t)\boldsymbol{\cdot }\boldsymbol{y}_{0}\,\rangle =0$
, for time sufficiently small one has
 $$\begin{eqnarray}\langle y^{2}(t)\rangle \approx y_{0}^{2}+\langle \unicode[STIX]{x1D6FF}\boldsymbol{v}_{0}\boldsymbol{\cdot }\unicode[STIX]{x1D6FF}\boldsymbol{v}_{0}\rangle t^{2},\end{eqnarray}$$
with
 $\unicode[STIX]{x1D6FF}\boldsymbol{v}_{0}=\unicode[STIX]{x1D6FF}\boldsymbol{v}(t=0)$
. This result was obtained by Batchelor (Reference Batchelor1950) and was confirmed experimentally for 3D turbulent fluids by Bourgoin et al. (Reference Bourgoin, Ouellette, Xu, Berg and Bodenschatz2006) and Ouellette et al. (Reference Ouellette, Xu, Bourgoin and Bodenschat2006). This can be further simplified if one assumes that
 $y_{0}$
is sufficiently small and that velocity gradients are square-integrable. In that case, the structure function
 $S(y_{0})=\langle \unicode[STIX]{x1D6FF}\boldsymbol{v}_{0}\boldsymbol{\cdot }\unicode[STIX]{x1D6FF}\boldsymbol{v}_{0}\rangle$
can be replaced by
 $Zy_{0}^{2}$
, with
 $Z=\int _{0}^{\infty }k^{2}E(k)\,\text{d}k$
the total relative enstrophy, and
 $$\begin{eqnarray}\langle y^{2}\rangle \approx y_{0}^{2}(1+Zt^{2})\end{eqnarray}$$
(Babiano et al. Reference Babiano, Basdevant, Roy and Sadourny1990). In the opposite limit of long times, one can expect that particles are separated by a distance larger than the largest eddies and, hence, relative diffusivity converges towards a constant that is twice the absolute diffusivity, due to uncorrelated particle velocities.
At intermediate times, for which dispersion scales are within the inertial range of the tracer variance cascade, the classical assumption of self-similarity for a local turbulent cascade can be made. In that case, diffusivity will depend only on
 $\unicode[STIX]{x1D702}$
(the spectral turbulent flux of the tracer variance) and
 $y$
(the distance of pair separation). The turbulent flux scales as
 $\unicode[STIX]{x1D702}=L^{4-2\unicode[STIX]{x1D6FC}}T^{-3}$
(with
 $L$
and
 $T$
being typical length and time scales) and is assumed to be constant in the inertial range of the tracer variance cascade. We then obtain
 $$\begin{eqnarray}\frac{1}{2}\frac{\text{d}\langle y^{2}\rangle }{\text{d}t}\propto \unicode[STIX]{x1D702}^{1/3}\langle y^{2}\rangle ^{(\unicode[STIX]{x1D6FC}+1)/3}\end{eqnarray}$$
for
 $\unicode[STIX]{x1D6FC}<2$
, which implies that
 $$\begin{eqnarray}\langle y^{2}\rangle \propto \unicode[STIX]{x1D702}^{1/(2-\unicode[STIX]{x1D6FC})}t^{3/(2-\unicode[STIX]{x1D6FC})}.\end{eqnarray}$$
This is a generalization of Batchelor’s (Reference Batchelor1950) result for
 $\unicode[STIX]{x1D6FC}$
-turbulence. Note that Morel & Larcheveque (Reference Morel and Larcheveque1974) proposed another derivation based on the kinetic energy spectrum
 $E(k)$
and the dispersion scale. One can apply a hypothesis of local cascade using
 $(kE(k))^{1/2}/k$
as a diffusivity scale. By self-similarity and for a kinetic energy spectrum
 $E(k)\propto k^{-\unicode[STIX]{x1D6FD}}$
, one can expect that
 $$\begin{eqnarray}\frac{1}{2}\frac{\text{d}\langle y^{2}\rangle }{\text{d}t}\propto \langle y^{2}\rangle ^{(\unicode[STIX]{x1D6FD}+1)/4}.\end{eqnarray}$$
Relative dispersion then scales as
 $$\begin{eqnarray}\langle y^{2}\rangle \propto t^{4/(3-\unicode[STIX]{x1D6FD})}.\end{eqnarray}$$
Models with
 $0<\unicode[STIX]{x1D6FC}<2$
satisfy
 $\unicode[STIX]{x1D6FD}=(4\unicode[STIX]{x1D6FC}+1)/3$
, and (2.14) and (2.15) coincide with (2.16) and (2.17).
Fung & Vassilicos (Reference Fung and Vassilicos1998) discuss the scaling relations obtained by the ‘locality hypothesis’ in their study of kinematic simulations of 2D flows possessing different energy spectra, while Nicolleau & Yu (Reference Nicolleau and Yu2004) adopted a similar approach to examine the scalings in three dimensions. This latter study pointed out the necessity of taking into account finite scale effects due to the initial distance between particle pairs. This was also observed in previous studies dealing with direct numerical simulations of forced 2D turbulence (Babiano et al. Reference Babiano, Basdevant, Roy and Sadourny1990) and we will assess its importance in our simulations.
A different situation occurs when
 $\unicode[STIX]{x1D6FC}\geqslant 2$
, that is, for sufficiently steep (
 $\unicode[STIX]{x1D6FD}\geqslant 3$
) kinetic energy spectra. In this case the flow is smooth and it can be shown that relative dispersion grows exponentially in time with an exponent related to the maximum Lagrangian Lyapunov exponent of the flow (Falkovich et al.
Reference Falkovich, Gaw edzki and Vergassola2001) or, equivalently, to the square root of enstrophy (LaCasce Reference LaCasce2008):
 $$\begin{eqnarray}\langle y^{2}\rangle \propto \text{e}^{2c_{1}Z^{1/2}t},\end{eqnarray}$$
where
 $c_{1}$
is a non-dimensional constant. Accordingly, one obtains
 $$\begin{eqnarray}\frac{1}{2}\frac{\text{d}\langle y^{2}\rangle }{\text{d}t}\propto c_{1}Z^{1/2}\langle y^{2}\rangle\end{eqnarray}$$
for the relative diffusivity. This exponential growth of
 $\langle y^{2}\rangle$
is essentially driven by the largest eddies and it does not depend on the slope of the kinetic energy spectrum. From a Lagrangian point of view this corresponds to a regime of ‘non-local dispersion’.
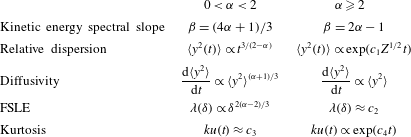
Table 1 summarizes the expected scalings from the type of
 $\unicode[STIX]{x1D6FC}$
-model used (see §§ 5.2 and 5.3, respectively, for the definitions of FSLE and kurtosis). Note that these scalings do not contradict the initial ballistic regime (2.13) as discussed by Babiano et al. (Reference Babiano, Basdevant, Roy and Sadourny1990) and Nicolleau & Yu (Reference Nicolleau and Yu2004). One interpretation is that, as long as the separation vector does not reorient with respect to the spatial structure of the strain field (in particular the strain axes), the particle pairs retain memory of the initial velocity field, which leads to (2.13).
Equations (2.19) and (2.14) indicate that flows with non-local (respectively local) spectral transfers would imply non-local (respectively local) dispersion. However, the correspondence between transfers and dispersion properties breaks down if either the spectral transfers have both local and non-local contributions, or the energy spectra are steeper than predicted by the theory.
Scaling relations for relative dispersion indicators at intermediate scales as a function of
 $\unicode[STIX]{x1D6FC}$
(see §§ 5.2 and 5.3, respectively, for the definitions of FSLE and kurtosis). The quantity
 $Z$
is total relative enstrophy, and
 $c_{i}$
(
 $i=1$
to
 $4$
) are constants depending on properties of the fluid flow.

3 Numerical model
To explore in detail how local relative dispersion is in
 $\unicode[STIX]{x1D6FC}$
-turbulence, we conduct simulations with different values of
 $\unicode[STIX]{x1D6FC}$
(
 $=1,1.25,1.5,1.75,2$
). Two other simulations with very high viscosity are also performed with
 $\unicode[STIX]{x1D6FC}=1$
or
 $\unicode[STIX]{x1D6FC}=2$
in order to examine the relations between energy spectra and dispersion laws.
Equations (2.5) and (2.6) are integrated using a pseudo-spectral code with a fourth-order Runge–Kutta method for time stepping; an exponential filter provides numerical dissipation at small scales (LaCasce Reference LaCasce1996). This filter allows extension of the inertial range of tracer variance flux over higher wavenumbers, compared to the usual hyperviscosity approach, with a very slow decay of energy in time (Smith et al.
Reference Smith, Boccaletti, Henning, Marinov, Tam, Held and Vallis2002). In the two viscous simulations, a standard Laplacian operator accounts for viscosity forces. Simulations are performed in free decay at a spatial resolution of
 $1024\times 1024$
in a doubly periodic square box of side length
 $2\unicode[STIX]{x03C0}$
.
Despite the clear drawback due to their unsteady character, freely decaying runs can in the present case offer some advantages with respect to forced simulations. Indeed, these latter ones would necessitate determining what type of forcing to use, either correlated in space or time, random or deterministic, at large or small scales. Moreover, dissipation at large scales is also an important parameter since it can alter the cascade. As discussed by Burgess, Scott & Shepherd (Reference Burgess, Scott and Shepherd2015), the kinetic energy spectral slope is sensitive to these choices and the values of these parameters. Also, one would need to decide which quantity will be kept constant between the different
 $\unicode[STIX]{x1D6FC}$
cases: kinetic energy, generalized enstrophy or energy flux. We further remark that coherent eddies are affected by the forcing type, for instance, when using a random forcing on a particular wavenumber that will break the phase relationships of the vortices at this scale. This contrasts with freely decaying cases which allow the spontaneous emergence of coherent vortices. We leave for future investigation the case of forced simulations for which both direct and inverse cascades are resolved.
One difficulty in the present setting is to properly choose the initial condition for all the simulations so that the comparisons will be unbiased. Here all the simulations have been started with the same initial streamfunction, corresponding to Fourier components
 $\widehat{\unicode[STIX]{x1D713}}(\boldsymbol{k})$
satisfying
 $$\begin{eqnarray}|\widehat{\unicode[STIX]{x1D713}}(\boldsymbol{k})|^{2}=\frac{Ak^{4}}{(k+k_{m})^{25}},\end{eqnarray}$$
with
 $k_{m}=14$
, and with random phases. This choice of
 $k_{m}$
allows one to obtain a kinetic energy spectral peak at large scales, namely for
 $k=7k_{m}/18\approx 5.4$
. The various simulations only differ in the amplitude of the initial streamfunction, as we choose to set the generalized energy equal to
 $\int k^{\unicode[STIX]{x1D6FC}}|\widehat{\unicode[STIX]{x1D713}}|2\,\text{d}\boldsymbol{k}=2\times 10^{-3}$
, which fixes the value of
 $A$
for each experiment. In this way, we only affect the time scales of turbulence and dispersion, and not the spatial scales of the stirring field (given by the relative enstrophy
 $k^{2}E(k)$
).
Concerning the computation of the trajectories of passive particles, we use the Lagrangian particle code used in Hua (Reference Hua1994), which calculates the velocity field at particle positions with a bicubic interpolation in space and integrates the trajectories in time with a fourth-order Runge–Kutta scheme. Such a scheme allows one to obtain robust statistics for relative dispersion (Zouari & Babiano Reference Zouari and Babiano1990) and preserves the Lagrangian conservation of tracers (Hua Reference Hua1994). We begin the integration of the particle trajectories at time
 $t=40$
in dimensional units, when energy spectra of all simulations have reached an approximate equilibrium with distinct spectral slopes. The particles are set on a uniform grid and we checked that the initial velocity of particle separation is not correlated with the separation itself (
 $\langle \unicode[STIX]{x1D6FF}\boldsymbol{v}_{0}\boldsymbol{\cdot }\boldsymbol{y}_{0}\rangle \approx 0$
). Finally, we assume that particles move in an infinite domain and we use the periodicity of the fluid flow in physical space to compute their velocities when they leave the computational box.
4 Turbulent flow characteristics
4.1 Active tracer fields
After a transient period (that lasts until
 $t\approx 36$
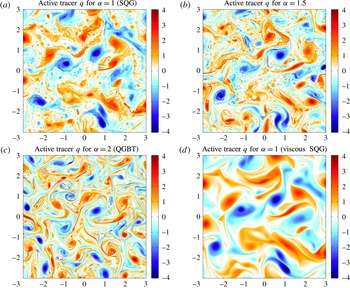
), the statistical properties of the different fields evolve more slowly with the continuous decay of the total energy (see supplementary material available at https://doi.org/10.1017/jfm.2017.253 for more details about the quasi-steadiness of the turbulent regime). Figure 1 presents the active tracer fields for different values of
 $\unicode[STIX]{x1D6FC}$
at
 $t=40$
. For
 $\unicode[STIX]{x1D6FC}=1$
(case of SQG turbulence), we observe intensified coherent structures from the smallest to the largest scales in the active tracer field
 $q$
(figure 1
a). These small-scale eddies are due to the instability of filaments that are expelled from larger-scale eddies (Held et al.
Reference Held, Pierrehumbert, Garner and Swanson1995; Juckes Reference Juckes1995). This clearly also occurs in the case of
 $\unicode[STIX]{x1D6FC}=1.5$
, e.g. for the filament with
 $q<0$
that wraps up around the vortex at
 $(x,y)\approx (-2.2,-1.3)$
(figure 1
b). Going to greater values of
 $\unicode[STIX]{x1D6FC}$
, we observe the progressive disappearance of these small-scale eddies and the appearance of very long, thin and quasi-passive filaments (see figure 1
c for
 $\unicode[STIX]{x1D6FC}=2$
), as also observed by Pierrehumbert et al. (Reference Pierrehumbert, Held and Swanson1994) in forced simulations. As discussed by Held et al. (Reference Held, Pierrehumbert, Garner and Swanson1995), the decay range of the velocity field due to large-scale eddies is much shorter for SQG than for QGBT. Hence the straining processes that suppress the development of the filament instability are less efficient in SQG than in QGBT, which leads to the roll-up of small filaments to form small-scale vortices in SQG. For the viscous run with
 $\unicode[STIX]{x1D6FC}=1$
, small-scale vortices completely disappear and only large-scale vortices with a few thick filaments remain (figure 1
d).
Active tracer
 $q$
at
 $t=40$
for (a)
 $\unicode[STIX]{x1D6FC}=1$
, (b)
 $\unicode[STIX]{x1D6FC}=1.5$
, (c)
 $\unicode[STIX]{x1D6FC}=2$
and (d) viscous run with
 $\unicode[STIX]{x1D6FC}=1$
. Values have been normalized by
 $\langle q^{2}\rangle ^{1/2}$
and the space domain is
 $[-\unicode[STIX]{x03C0},\unicode[STIX]{x03C0}]^{2}$
.

4.2 Kinetic energy spectra
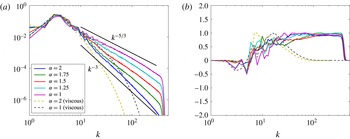
Figure 2(a) presents the kinetic energy spectra for the different simulations averaged over several realizations between times
 $t=36$
and
 $t=40$
. At scales below
 $k=10$
, they share approximately the same shape with a maximum of kinetic energy around
 $k=4$
. From
 $k=20$
to
 $k=200$
, to a good extent, we observe a constant spectral slope in each simulation for the non-viscous runs, while the spectrum rapidly falls off for the two viscous runs. For values of
 $\unicode[STIX]{x1D6FC}<2$
, the actual slopes are close to the predictions based on local transfer arguments (see table 2). For the case of
 $\unicode[STIX]{x1D6FC}=2$
the kinetic energy spectrum is observed to be steeper than
 $k^{-3}$
, probably due to numerical dissipation effects (Boffetta & Ecke Reference Boffetta and Ecke2012).
(a) Kinetic energy spectra normalized by total energy. (b) Spectral fluxes (normalized by their maximum value) of active tracer variance as a function of
 $k$
. Spectra and fluxes have been time-averaged over several realizations between
 $t=36$
and
 $t=40$
.

Slopes of kinetic energy spectra (
 $E(k)\propto k^{-\unicode[STIX]{x1D6FD}}$
) for different values of
 $\unicode[STIX]{x1D6FC}$
, computed from a best fit in the range
 $20\leqslant k\leqslant 200$
. The uncertainties in the fitted values are of the order of
 $0.05$
. The theoretical slopes correspond to
 $\unicode[STIX]{x1D6FD}=(4\unicode[STIX]{x1D6FC}+1)/3$
.

4.3 Spectral fluxes and non-locality
To further substantiate the existence of an inertial range with a corresponding direct cascade of active tracer
 $q$
, we computed the tracer variance flux
 $\unicode[STIX]{x1D6F1}(K)$
at each wavenumber
 $K$
:
 $$\begin{eqnarray}\unicode[STIX]{x1D6F1}(K)=-\int _{K}^{\infty }[\text{Re}(\widehat{q}^{\,\ast }(\widehat{\boldsymbol{u}\boldsymbol{\cdot }\unicode[STIX]{x1D735}q}))]k\,\text{d}k,\end{eqnarray}$$
where the square brackets indicate an average over time and over spectral shells around wavenumber modulus
 $k$
. The notation
 $(~)^{\ast }$
stands for the complex conjugate and
 $\text{Re}(~)$
is the real part. Figure 2(b) presents the spectral flux
 $\unicode[STIX]{x1D6F1}(K)$
for each case, normalized by its corresponding maximum value. In each simulation we observe that
 $\unicode[STIX]{x1D6F1}(K)>0$
for
 $8<K<300$
, which confirms the existence of a direct cascade of active tracer
 $q$
from large to small scales. Moreover, for most of the simulations, an inertial range (corresponding to constant flux) is found between approximately
 $K_{min}^{i}=30$
and
 $K_{max}^{i}=300$
. For some
 $\unicode[STIX]{x1D6FC}$
cases the plateaus of
 $\unicode[STIX]{x1D6F1}(K)$
extend less towards the smaller wavenumbers. This might be the reason for the not exactly constant spectral slopes of the corresponding kinetic energy spectra at the lower boundary (in
 $K$
) of the inertial range. The two viscous simulations do not possess any inertial range but still exhibit positive flux in a narrower range between
 $K\approx 8$
and
 $K\approx 80$
. The absence of a constant energy flux range explains why there is no clear spectral slope for the kinetic energy spectrum (figure 2
a).
To shed more light on the locality of transfers across scales, the tracer variance flux can be decomposed into transfers between modes. For a given wavenumber
 $k$
, one can look for the scales (associated with wavenumbers
 $l$
and
 $m$
) that contribute to the flux at this scale. In such a situation, we have
 $\boldsymbol{k}=\boldsymbol{l}+\boldsymbol{m}$
. Such a combination of three scales corresponds to a triadic interaction (Kraichnan Reference Kraichnan1967).
A coarse-grained version of the tracer variance flux
 $T(n)$
for a circular shell
 $k_{n}<|\boldsymbol{k}|<k_{n+1}$
can be simply expressed as a triad transfer function from different scales:
 $$\begin{eqnarray}T(n)=-\int _{k_{n}}^{k_{n+1}}[\text{Re}(\widehat{q}^{\,\ast }(\widehat{\boldsymbol{u}\boldsymbol{\cdot }\unicode[STIX]{x1D735}q}))]k\,\text{d}k=\mathop{\sum }_{a=0}^{N}\mathop{\sum }_{b=0}^{N}T(n|a,b),\end{eqnarray}$$
where
 $T(n|a,b)$
represents the flux due to scales
 $l_{a}<|\boldsymbol{l}|<l_{a+1}$
and
 $m_{b}<|\boldsymbol{m}|<m_{b+1}$
(see Watanabe & Iwayama (Reference Watanabe and Iwayama2007) for more details). The full expression for
 $T(n|a,b)$
is given in appendix A.
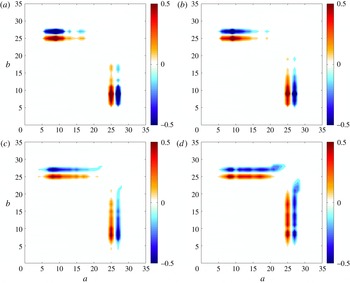
Coarse-grained triad transfer function
 $T(n|a,b)$
with
 $n=25$
(corresponding to
 $k=95$
); the horizontal and vertical axes respectively correspond to the shell indices
 $a$
and
 $b$
. Cases with (a)
 $\unicode[STIX]{x1D6FC}=2$
, (b)
 $\unicode[STIX]{x1D6FC}=1.75$
, (c)
 $\unicode[STIX]{x1D6FC}=1.5$
and (d)
 $\unicode[STIX]{x1D6FC}=1$
. Transfers have been time-averaged and normalized by the total tracer variance dissipation.

The transfer function
 $T(n|a,b)$
is shown in figure 3 (for
 $n=25$
); here
 $k_{n}=\unicode[STIX]{x1D706}^{n}$
,
 $l_{a}=\unicode[STIX]{x1D706}^{a}$
,
 $m_{b}=\unicode[STIX]{x1D706}^{b}$
and
 $\unicode[STIX]{x1D706}=1.2$
. The index
 $n=25$
corresponds to the shell centred on wavenumber 95, which is in the inertial range. For
 $\unicode[STIX]{x1D6FC}=2$
and
 $\unicode[STIX]{x1D6FC}=1.75$
, we see that spectral transfers are due to triads with
 $a\ll b$
or
 $a\gg b$
. This means that nonlinear transfers between triads are mostly non-local in these cases. While for
 $\unicode[STIX]{x1D6FC}=2$
this is expected from the theory, this is less so when
 $\unicode[STIX]{x1D6FC}=1.75$
. In contrast, for
 $\unicode[STIX]{x1D6FC}=1$
and
 $\unicode[STIX]{x1D6FC}=1.5$
, triads with
 $a\approx b$
also contribute to the transfer function. In these two cases (in particular the SQG case), it has to be stressed that both local and non-local triads are responsible for the transfers while the phenomenological theory would advocate for only local contributions. Watanabe & Iwayama (Reference Watanabe and Iwayama2007) obtained the same results for the cases
 $\unicode[STIX]{x1D6FC}=1$
and
 $\unicode[STIX]{x1D6FC}=2$
in forced simulations. Hence, this result suggests that locality and non-locality in terms of turbulent energy transfers are not as exclusive as one might think a priori.
4.4 Locality of the strain field
The quantity that will matter in the dispersion of particles is the strain rate, as this governs the stirring of fluid parcels (see Lapeyre (Reference Lapeyre2002) for a discussion on Lagrangian strain rates). A way to determine if a particular scale
 $k$
will be strained by eddies of comparable size or by larger ones is to compute the weight of the strain rate at a given scale relative to the strain rate at larger scales. To this end we introduce the enstrophy ratio
 $R_{k}$
:
 $$\begin{eqnarray}R_{k}=\frac{\displaystyle \int _{k/2}^{k}l^{2}E(l)\,\text{d}l}{\displaystyle \int _{k_{min}}^{k}l^{2}E(l)\,\text{d}l},\end{eqnarray}$$
where the infrared cutoff
 $k_{min}>0$
corresponds to the smallest wavenumber resolved in the domain, or the wavenumber containing the largest enstrophy at large scale. Here the numerator represents the local strain rate (more precisely the enstrophy
 $l^{2}E(l)$
) contained in eddies with size between
 $k/2$
and
 $k$
, while the denominator expresses the strain rate by larger-scale structures felt by a given scale
 $k$
(assuming that smaller-scale motions will not contribute to the stirring of larger-scale structures). Using a power-law spectrum
 $E(k)\sim k^{-(4\unicode[STIX]{x1D6FC}+1)/3}$
, the quantity
 $R_{k}$
is equal to
 $R_{k}=(1-2^{4(\unicode[STIX]{x1D6FC}-2)/3})/(1-(k_{min}/k)^{4(2-\unicode[STIX]{x1D6FC})/3})$
and tends to
 $R^{lim}=1-2^{4(\unicode[STIX]{x1D6FC}-2)/3}$
when
 $k$
is large enough for
 $\unicode[STIX]{x1D6FC}<2$
. For
 $\unicode[STIX]{x1D6FC}=2$
,
 $R_{k}$
decays as
 $R_{k}=\log 2/\log (k/k_{min})$
. Hence at large
 $k$
, small eddies of size
 $1/k$
do not contribute to the stirring when
 $\unicode[STIX]{x1D6FC}=2$
whereas they have a non-negligible impact for
 $\unicode[STIX]{x1D6FC}<2$
.
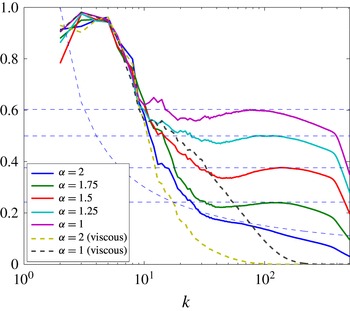
Ratio,
 $R_{k}$
, of enstrophy contained in
 $[k/2,k]$
to enstrophy contained in
 $[k_{min},k]$
. The horizontal dashed curves correspond to the theoretical predictions
 $R^{lim}$
, while the decreasing one is
 $R_{k}=\log 2/\log (k/k_{min})$
.

Figure 4 presents the quantity
 $R_{k}$
along with its theoretical limit (dashed lines). At large scales,
 $R_{k}$
is close to 1 for all cases, as can be understood from its definition in the limit of small wavenumbers. For smaller scales, namely those corresponding to
 $k>30$
,
 $R_{k}$
decreases in fair agreement with the theoretical prediction for
 $\unicode[STIX]{x1D6FC}=2$
, while it approaches a constant value for
 $\unicode[STIX]{x1D6FC}<2$
. This value is close to
 $1-2^{4(\unicode[STIX]{x1D6FC}-2)/3}$
. As
 $\unicode[STIX]{x1D6FC}$
decreases, local scales have a more and more important weight in the strain rate. However,
 $R_{k}$
only reaches
 $60\,\%$
of the total strain for
 $\unicode[STIX]{x1D6FC}=1$
. This indicates that larger scales still provide a non-negligible contribution to the stirring for the SQG case and raises the possibility that a dispersion theory based on local arguments might not be sufficient to account for the different processes involved in the dispersion.
5 Relative dispersion analysis
We now present the results of the relative dispersion analysis based on indicators computed both at fixed time and at fixed scale. For these calculations, an ensemble of
 $1024\times 1024$
particles homogeneously distributed on a regular grid has been seeded in the flow after the transient regime, from time
 $t=40$
to time
 $t=80$
. During this time interval, kinetic energy decayed by
 $17\,\%$
or less (depending on the value of
 $\unicode[STIX]{x1D6FC}$
), while the relative enstrophy decayed by almost
 $35\,\%$
for all non-viscous runs (see supplementary material). During this time period, the relative enstrophy spectra keep the same shape for
 $k>10$
while the main peak shifts to lower wavenumbers (not shown). Statistics were computed using up to
 $2\times 10^{6}$
particle pairs. In the following, time
 $t=0$
will correspond to the time of particle release.
5.1 Time-dependent statistics
As previous studies showed (Babiano et al.
Reference Babiano, Basdevant, Roy and Sadourny1990; Boffetta & Sokolov Reference Boffetta and Sokolov2002; Nicolleau & Yu Reference Nicolleau and Yu2004; Bourgoin et al.
Reference Bourgoin, Ouellette, Xu, Berg and Bodenschatz2006), relative dispersion statistics depend on the initial particle pair separation
 $y(t=0)=y_{0}$
. It is then useful to introduce the wavenumber
 $k_{0}=2\unicode[STIX]{x03C0}/y_{0}$
, which allows one to compare the initial pair separation with the typical length scales associated with the inertial range of the active tracer cascade. In the following we will take
 $k_{0}=512$
, corresponding to initial separations
 $y_{0}\approx 1.23\times 10^{-2}$
, smaller than the scale at which the tracer variance flux vanishes and the kinetic energy rapidly drops to zero, namely
 $k_{v}\approx 350$
. We have also performed a particle release experiment with
 $k_{0}=1024$
but tracking particles over a more limited time period, and we obtained qualitatively similar results.
We further introduce a time scale corresponding to the time at which particle pairs have forgotten their initial separation, i.e. their early behaviour (see (2.12)). Such a time scale will take into account the period during which particles lose ‘memory’ of their initial position and velocities, which would delay the onset of scaling relations (see discussion in Babiano et al. Reference Babiano, Basdevant, Roy and Sadourny1990). For that purpose, we introduce a ‘memory index’,
 $$\begin{eqnarray}M(t)=\frac{\langle \boldsymbol{y}\boldsymbol{\cdot }\boldsymbol{y}_{0}\rangle }{y_{0}\langle y^{2}\rangle ^{1/2}},\end{eqnarray}$$
and we look for times
 $t$
such that
 $M(t)\approx 0$
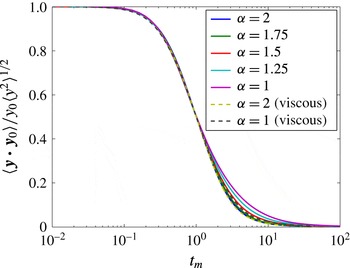
. Figure 5 shows such a quantity in the case of
 $k_{0}=512$
. Here, we rescaled time as
 $t_{m}=t/\unicode[STIX]{x1D70F}_{m}$
, where
 $\unicode[STIX]{x1D70F}_{m}$
is such that
 $M(t=\unicode[STIX]{x1D70F}_{m})=0.5$
for each value of
 $\unicode[STIX]{x1D6FC}$
. We clearly observe that the separation distance decorrelates with its initial value in the same manner for all simulations, provided the appropriate time scale
 $\unicode[STIX]{x1D70F}_{m}$
is used to make time non-dimensional. The cases
 $\unicode[STIX]{x1D6FC}=1$
and
 $1.25$
seem to decorrelate more slowly in time but the difference with the other cases remains quite small. Hence, the time scale
 $\unicode[STIX]{x1D70F}_{m}$
seems to provide the typical time scale of decorrelation with the initial conditions, and in the following we will use
 $t_{m}$
as the rescaled time for an appropriate comparison of the different cases. We note that another time scale
 $T_{z}=Z^{-1/2}$
, based on the relative enstrophy
 $Z$
, could be appropriate. We found that this time scale is highly correlated with
 $\unicode[STIX]{x1D70F}_{m}$
since the ratio
 $T_{z}/\unicode[STIX]{x1D70F}_{m}$
stays between
 $0.5$
and
 $0.8$
for the different cases (not shown). However,
 $t_{m}$
was found to give better agreement between the different simulations.
Particle separation memory index
 $M(t)=\langle \boldsymbol{y}\boldsymbol{\cdot }\boldsymbol{y}_{0}\rangle /y_{0}\langle y^{2}\rangle ^{1/2}$
as a function of the renormalized time
 $t_{m}=t/\unicode[STIX]{x1D70F}_{m}$
. Initial pair separations correspond to
 $k_{0}=2\unicode[STIX]{x03C0}/y_{0}=512$
.

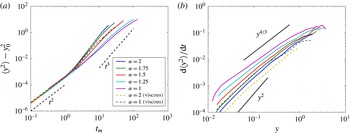
(a) Relative dispersion (after subtraction of the initial value)
 $\langle y^{2}\rangle -y_{0}^{2}$
as a function of time
 $t_{m}$
. (b) Diffusivity
 $\text{d}\langle y^{2}\rangle /\text{d}t$
as a function of
 $\langle y^{2}\rangle ^{1/2}$
. In this panel, only data with
 $M(t)<0.5$
have been plotted. In each case, the initial separation
 $y_{0}$
corresponds to
 $k_{0}=512$
.

For short times (
 $t_{m}\ll 1$
), we expect relation (2.12) to hold. Figure 6(a) clearly indicates that this regime is observed up to a time
 $t_{m}\approx 1$
. This is in agreement with other studies (Nicolleau & Yu Reference Nicolleau and Yu2004; Bourgoin et al.
Reference Bourgoin, Ouellette, Xu, Berg and Bodenschatz2006). We note that simulations with different values of
 $\unicode[STIX]{x1D6FC}$
and
 $k_{0}$
give exactly the same typical law
 $\langle y^{2}\rangle \approx y_{0}^{2}(1+ct_{m}^{2})$
for sufficiently small
 $t_{m}$
, with
 $c$
a constant independent of
 $\unicode[STIX]{x1D6FC}$
and
 $k_{0}$
– see the good collapse of the different curves in figure 6(a) when varying
 $\unicode[STIX]{x1D6FC}$
at fixed
 $k_{0}$
and figure 7 when varying
 $k_{0}$
at fixed
 $\unicode[STIX]{x1D6FC}$
. This indicates that
 $\unicode[STIX]{x1D70F}_{m}$
is the relevant time scale for comparing the different simulations. For each value of
 $\unicode[STIX]{x1D6FC}$
the departure from the ballistic regime seems to occur around a common value between
 $t_{m}=1$
and
 $t_{m}=2$
. At that time, the dispersion scale is of the order of
 $y^{2}\approx (2\unicode[STIX]{x03C0}/K_{max}^{i})^{2}\approx 4.4\times 10^{-4}$
, i.e. in the inertial range.
We now turn to intermediate times for which the dispersion should obey a power law
 $\langle y^{2}\rangle \propto t^{3/(2-\unicode[STIX]{x1D6FC})}$
for
 $\unicode[STIX]{x1D6FC}<2$
and an exponential law for
 $\unicode[STIX]{x1D6FC}=2$
and the viscous runs (table 1). Figure 6(a) shows that relative dispersion increases more rapidly when
 $\unicode[STIX]{x1D6FC}$
increases, as expected. However,
 $\langle y^{2}\rangle$
is systematically found to grow in time more slowly than predicted by the theory. A difficulty in measuring the power-law exponents (or exponential growth rates) is due to the fact that they strongly depend on
 $k_{0}$
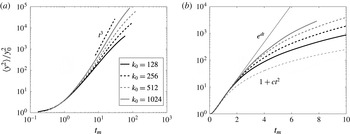
, and they typically increase with it. Figure 7 displays
 $\langle y^{2}\rangle /y_{0}^{2}$
as a function of time for different
 $k_{0}$
when
 $\unicode[STIX]{x1D6FC}=1$
(a) and
 $\unicode[STIX]{x1D6FC}=2$
(b). In both cases, we see that the asymptotic dispersion regime is better realized when increasing
 $k_{0}$
. For
 $\unicode[STIX]{x1D6FC}=1$
(figure 7
a), relative dispersion tends to approach the theoretical expectation
 $\langle y^{2}\rangle \sim t^{3}$
when
 $y_{0}$
is decreased, but the scaling is still limited to a quite short range even for the smallest
 $y_{0}$
considered. On the other hand, for
 $\unicode[STIX]{x1D6FC}=2$
(figure 7
b), after a growth in
 $1+ct_{m}^{2}$
up to
 $t_{m}\approx 1$
, the time evolution of relative dispersion might suggest an exponential law, but only visible for smaller and smaller values of
 $y_{0}$
and up to a time
 $t_{m}\approx 2$
. Such difficulties in observing clear scalings relating relative dispersion with time were noted by numerous authors (Morel & Larcheveque Reference Morel and Larcheveque1974; Boffetta & Sokolov Reference Boffetta and Sokolov2002; Jullien Reference Jullien2003; Nicolleau & Yu Reference Nicolleau and Yu2004). Here two reasons can be invoked. Relative dispersion
 $\langle y^{2}\rangle$
involves particle pairs with different histories: some may separate more slowly than others, e.g. if they are trapped inside coherent vortices. This can lead to spurious behaviours due to averaging together, at fixed time, potentially very different pair separations (Artale et al.
Reference Artale, Boffetta, Celani, Cencini and Vulpiani1997). Another possible reason lies in the weakly non-stationary character of the turbulent flow; indeed, relative enstrophy slowly decreases in time, causing a temporal variation of the exponential growth rate of the squared separation for
 $\unicode[STIX]{x1D6FC}=2$
.
Relative dispersion as a function of time
 $t_{m}$
for different values of
 $y_{0}$
(with
 $k_{0}=2\unicode[STIX]{x03C0}/y_{0}$
) for
 $\unicode[STIX]{x1D6FC}=1$
(a) and
 $\unicode[STIX]{x1D6FC}=2$
(b). Here
 $d$
is a constant proportional to the square root of relative enstrophy.

Compensated diffusivity
 $\text{d}\langle y^{2}\rangle /\text{d}t\times \langle y^{2}\rangle ^{-(\unicode[STIX]{x1D6FC}+1)/3}$
as a function of
 $\langle y^{2}\rangle ^{1/2}$
. Panels (a–e)
 $\unicode[STIX]{x1D6FC}=1,1.25,1.5,1.75,2$
. Panel (f) is the viscous case
 $\unicode[STIX]{x1D6FC}=2$
. The different curves correspond to different values of initial separation distance.

5.2 Scale-dependent statistics
Statistics at fixed scale are preferable to avoid the superposition of different dispersion regimes due to particle pairs having different histories (Morel & Larcheveque Reference Morel and Larcheveque1974; Bennett Reference Bennett1984; Aurell et al. Reference Aurell, Boffetta, Crisanti, Paladin and Vulpiani1997; LaCasce & Bower Reference LaCasce and Bower2000).
Figure 6(b) shows relative diffusivity
 $\text{d}\langle y^{2}\rangle /\text{d}t$
as a function of pair dispersion
 $y=\langle y^{2}\rangle ^{1/2}$
for an initial separation corresponding to
 $k_{0}=512$
. Only data for which the particle pairs have forgotten their initial separation (i.e.
 $t>\unicode[STIX]{x1D70F}_{m}$
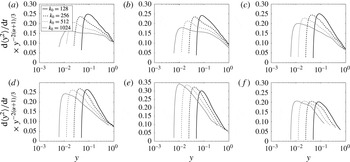
) have been plotted. The existence of a power-law regime appears more clearly when using this indicator. To better estimate the correspondence with the theory, a compensated plot
 $\text{d}\langle y^{2}\rangle /\text{d}t\times \langle y^{2}\rangle ^{-(\unicode[STIX]{x1D6FC}+1)/3}$
can be examined (figure 8). When decreasing the initial separation distance
 $y_{0}$
(or increasing
 $k_{0}$
) for
 $\unicode[STIX]{x1D6FC}<2$
, we see that a regime of quasi-constant compensated diffusivity (i.e. a broadening of the main peak) appears. This is more true when
 $\unicode[STIX]{x1D6FC}$
is small and when
 $k_{0}$
is large. In particular, for
 $\unicode[STIX]{x1D6FC}=1$
and
 $\unicode[STIX]{x1D6FC}=1.25$
(figure 8
a,b), we clearly see that the compensated diffusivity becomes constant over a large range of
 $y$
. Note also that for the viscous case
 $\unicode[STIX]{x1D6FC}=2$
, a restricted range of constant compensated diffusivity appears (figure 8
f). For these different cases, we are confident that the dispersion statistics obey scaling laws predicted by the self-similarity theory based on a local cascade. However, this is only confirmed for small enough
 $y_{0}$
. For
 $\unicode[STIX]{x1D6FC}=2$
, the compensated diffusivity does not show a clear plateau even for
 $k_{0}=1024$
(figure 8
e). A similar conclusion is obtained for the viscous case
 $\unicode[STIX]{x1D6FC}=1$
(not shown).
With regard to the difficulty of observing exponential growth when
 $\unicode[STIX]{x1D6FC}=2$
, an alternative diagnostic is the characteristic time of relative dispersion, defined in Babiano et al. (Reference Babiano, Basdevant, Roy and Sadourny1990) as
 $$\begin{eqnarray}\unicode[STIX]{x1D70F}_{exp}(y)=\frac{\langle y^{2}\rangle }{\displaystyle \text{d}\langle y^{2}\rangle /\text{d}t}.\end{eqnarray}$$
A constant value of
 $\unicode[STIX]{x1D70F}_{exp}(y)$
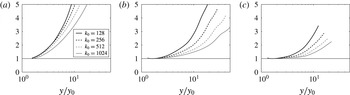
corresponds to an exponential separation and defines the range of separations over which this regime is found. The behaviour of this quantity for different initial separations is presented in figure 9, again for
 $\unicode[STIX]{x1D6FC}=1$
,
 $\unicode[STIX]{x1D6FC}=2$
and the viscous run with
 $\unicode[STIX]{x1D6FC}=2$
. We have rescaled
 $\unicode[STIX]{x1D70F}_{exp}$
with its minimum value in each case and only data in the inertial range are shown. For
 $\unicode[STIX]{x1D6FC}=1$
, we do not expect an exponential regime and this serves to contrast with the other two cases. Indeed, in this case, the time scale
 $\unicode[STIX]{x1D70F}_{exp}$
increases very rapidly with
 $y$
(figure 9
a), which indicates that an exponential growth is not present for the values of
 $y_{0}$
considered. For
 $\unicode[STIX]{x1D6FC}=2$
the characteristic time
 $\unicode[STIX]{x1D70F}_{exp}$
is found to be constant, or at least to vary weakly (between
 $1$
and
 $2$
) over a broader range of scales (almost a decade in
 $y$
for the smallest
 $y_{0}$
). This strongly suggests that non-local dispersion is taking place in the inertial range. As can be seen, the smaller the initial separation, the larger the range of separations for which
 $\unicode[STIX]{x1D70F}_{exp}(y)=\text{const.}$
, consistent with Babiano et al. (Reference Babiano, Basdevant, Roy and Sadourny1990). In contrast to the
 $\unicode[STIX]{x1D6FC}=1$
case, the minimum of
 $\unicode[STIX]{x1D70F}_{exp}$
was found to be independent of
 $y_{0}$
(not shown). The viscous run with
 $\unicode[STIX]{x1D6FC}=2$
reveals a much clearer exponential range, indicating that steeper energy spectra are accompanied by more non-local dispersion.
Characteristic time of relative dispersion
 $\unicode[STIX]{x1D70F}_{exp}$
as a function of
 $y/y_{0}$
for
 $\unicode[STIX]{x1D6FC}=1$
(a),
 $\unicode[STIX]{x1D6FC}=2$
(b) and the viscous run with
 $\unicode[STIX]{x1D6FC}=2$
(c). Only data for which
 $y$
is within the inertial range are displayed and
 $t_{m}>1$
. The value
 $\unicode[STIX]{x1D70F}_{exp}$
has been rescaled by its minimum value. For
 $k_{0}=1024$
the inertial range occurs from
 $y/y_{0}>3.4$
, while it is below
 $2$
for the other values of
 $k_{0}$
.

Another way to diagnose local/non-local dispersion is to investigate the exponential growth rate of separation, not as a function of time, but scale by scale. To this end, one can measure the time
 $\unicode[STIX]{x1D70F}(\unicode[STIX]{x1D6FF})$
needed to observe the growth of separation from a scale
 $\unicode[STIX]{x1D6FF}$
to a scale
 $r\unicode[STIX]{x1D6FF}$
(with
 $r>1$
). The finite-size Lyapunov exponent (FSLE) is then defined as
 $$\begin{eqnarray}\unicode[STIX]{x1D706}(\unicode[STIX]{x1D6FF})=\frac{\log (r)}{\langle \unicode[STIX]{x1D70F}(\unicode[STIX]{x1D6FF})\rangle },\end{eqnarray}$$
where the angular brackets indicate an average over all particle pairs (Artale et al.
Reference Artale, Boffetta, Celani, Cencini and Vulpiani1997; Aurell et al.
Reference Aurell, Boffetta, Crisanti, Paladin and Vulpiani1997). If the kinetic energy spectrum scales as
 $k^{-\unicode[STIX]{x1D6FD}}$
, the FSLE is expected to be given by
 $$\begin{eqnarray}\unicode[STIX]{x1D706}(\unicode[STIX]{x1D6FF})\propto \unicode[STIX]{x1D6FF}^{(\unicode[STIX]{x1D6FD}-3)/2}\end{eqnarray}$$
for
 $\unicode[STIX]{x1D6FD}<3$
. The power-law dependence as a function of
 $\unicode[STIX]{x1D6FC}$
is then
 $$\begin{eqnarray}\unicode[STIX]{x1D706}(\unicode[STIX]{x1D6FF})\propto \unicode[STIX]{x1D6FF}^{2(\unicode[STIX]{x1D6FC}-2)/3}\end{eqnarray}$$
when
 $\unicode[STIX]{x1D6FC}<2$
. For spectra steeper than
 $k^{-3}$
or for
 $\unicode[STIX]{x1D6FC}\geqslant 2$
,
 $\unicode[STIX]{x1D706}(\unicode[STIX]{x1D6FF})$
should reach a constant value. In such a case of scale-independent FSLE, dispersion is controlled by non-local processes, that is, by velocity field features at much larger scales than the particle separation. In the limit of infinitesimal separation,
 $\unicode[STIX]{x1D706}(\unicode[STIX]{x1D6FF})$
converges to the maximum Lagrangian Lyapunov exponent
 $\unicode[STIX]{x1D706}_{L}$
of the flow.
In our different simulations, the FSLE was computed using the scale separation factor
 $r=1.2$
, original pairs and the time of first crossing technique, but the results were qualitatively the same using chance pairs or the fastest crossing method (Lumpkin & Elipot Reference Lumpkin and Elipot2010). Consistent with Özgökmen et al. (Reference Özgökmen, Poje, Fischer, Childs, Krishnan, Garth, Haza and Ryan2012), we rescaled FSLE with the Okubo–Weiss parameter
 $Q$
(Okubo Reference Okubo1970; Weiss Reference Weiss1991) that characterizes hyperbolic regions of the flow.
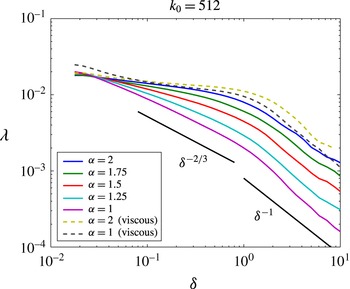
The behaviour of the FSLE is displayed in figure 10. For
 $0.03<\unicode[STIX]{x1D6FF}<0.3$
, approximately corresponding to
 $20<k<200$
, i.e. in the wavenumber range where constant spectral slopes were detected (see figure 2
a), we observe a power law
 $\unicode[STIX]{x1D706}(\unicode[STIX]{x1D6FF})\propto \unicode[STIX]{x1D6FF}^{-\unicode[STIX]{x1D6FE}}$
with an exponent
 $\unicode[STIX]{x1D6FE}$
that decreases as the slope of the kinetic energy spectrum increases (see table 3). This is in qualitative agreement with the theory but we remark that the decrease of
 $\unicode[STIX]{x1D706}(\unicode[STIX]{x1D6FF})$
with
 $\unicode[STIX]{x1D6FF}$
is slightly slower than expected for
 $\unicode[STIX]{x1D6FC}=1$
and
 $\unicode[STIX]{x1D6FC}=1.25$
. At scales smaller than
 $\unicode[STIX]{x1D6FF}=0.03$
,
 $\unicode[STIX]{x1D706}(\unicode[STIX]{x1D6FF})$
displays some tendency to flatten in all cases, but no clear plateau region allowing the measurement of
 $\unicode[STIX]{x1D706}_{L}$
is detected, at least for
 $\unicode[STIX]{x1D6FC}\leqslant 1.75$
. The cases with
 $\unicode[STIX]{x1D6FC}=2$
and the two viscous runs present a considerably weaker scale dependence, with almost constant FSLE up to scales
 $\unicode[STIX]{x1D6FF}\approx 0.5$
, pointing to an essentially non-local dispersion regime. Notice that the steepening of the FSLE for
 $\unicode[STIX]{x1D6FF}<0.1$
for the viscous run with
 $\unicode[STIX]{x1D6FC}=1$
may be due to the fact that particles at small separation slowly forgot their initial separation. Finally, independently of the value of
 $\unicode[STIX]{x1D6FC}$
, for
 $\unicode[STIX]{x1D6FF}>1$
we observe a faster decrease with
 $\unicode[STIX]{x1D6FF}$
of the FSLE, but the behaviour of these scales
 $\unicode[STIX]{x1D6FF}>\unicode[STIX]{x03C0}$
may be misleading, as periodicity in the velocity field may modify the dispersion properties.
FSLE (rescaled by the Okubo–Weiss parameter) computed from original pairs with particles regularly spaced every
 $2\unicode[STIX]{x03C0}/512$
in each direction. Regimes
 $\unicode[STIX]{x1D706}\propto \unicode[STIX]{x1D6FF}^{-2/3}$
and
 $\unicode[STIX]{x1D706}\propto \unicode[STIX]{x1D6FF}^{-1}$
are indicated for comparison.

Slopes of FSLE
 $\unicode[STIX]{x1D706}(\unicode[STIX]{x1D6FF})$
computed in the range
 $0.03<\unicode[STIX]{x1D6FF}<0.3$
(with uncertainties of the order of
 $0.05$
) and comparison with predictions based on
 $\unicode[STIX]{x1D6FC}$
.

5.3 Higher-order statistics
Relative dispersion is the second-order moment of particle pair separation. While for Gaussian probability distributions knowledge of it provides a good characterization of the statistics, this is no longer true for strongly non-Gaussian distributions, such as those typically encountered in turbulence. In such a case it is useful to compute higher-order moments or the probability density function (p.d.f.) itself. As discussed in detail by Bennett (Reference Bennett1984) and LaCasce (Reference LaCasce2010), the shapes of p.d.f.s give substantial information to determine what kind of dispersion regime is present.
In a 2D homogeneous incompressible flow the p.d.f. of pair separation
 $P(y,t)$
evolves according to the following Fokker–Planck equation (Richardson Reference Richardson1926):
 $$\begin{eqnarray}\frac{\unicode[STIX]{x2202}P}{\unicode[STIX]{x2202}t}=\frac{1}{y}\frac{\unicode[STIX]{x2202}}{\unicode[STIX]{x2202}y}\left(y\,K_{rel}\,\frac{\unicode[STIX]{x2202}P}{\unicode[STIX]{x2202}y}\right),\end{eqnarray}$$
where
 $y$
is the pair separation (Bennett Reference Bennett1984; LaCasce Reference LaCasce2010). Equation (5.6) must be supplemented by an initial condition such as, for example,
 $$\begin{eqnarray}P(y,t=0)=\frac{1}{2\unicode[STIX]{x03C0}y}\unicode[STIX]{x1D6FF}(y-y_{0}).\end{eqnarray}$$
For a diffusivity
 $K_{rel}=\unicode[STIX]{x1D705}y^{a}$
with
 $a<2$
, using the Laplace transform one can find the general solution
 $$\begin{eqnarray}P(y,t)=\frac{1}{4\unicode[STIX]{x03C0}\unicode[STIX]{x1D705}t(yy_{0})^{a/2}}\exp \left(-\frac{1}{(a-2)^{2}}\frac{y^{2-a}+y_{0}^{2-a}}{\unicode[STIX]{x1D705}t}\right)\text{I}_{a/(2-a)}\left(\frac{2}{(a-2)^{2}}\frac{(yy_{0})^{1-a/2}}{\unicode[STIX]{x1D705}t}\right),\end{eqnarray}$$
where
 $\text{I}_{n}$
is the modified Bessel function of order
 $n$
. In the limit of large distances but before the final diffusive range (
 $y\gg y_{0}$
and
 $\unicode[STIX]{x1D705}t\gg y^{2-a}$
), one has
 $$\begin{eqnarray}P(y,t)\approx \frac{1}{4\unicode[STIX]{x03C0}\unicode[STIX]{x1D6E4}(2/(2-a))((2-a)\unicode[STIX]{x1D705}t)^{2/(2-a)}}\exp \left(-\frac{1}{(a-2)^{2}}\frac{y^{2-a}}{\unicode[STIX]{x1D705}t}\right),\end{eqnarray}$$
which is known as the Richardson p.d.f. for
 $a=4/3$
. In contrast, when
 $a=2$
, the law is log-normal, and it is known as the Lundgren p.d.f. (Lundgren Reference Lundgren1981):
 $$\begin{eqnarray}P(y,t)=\frac{1}{4\unicode[STIX]{x03C0}(\unicode[STIX]{x03C0}t/T)^{1/2}y_{0}^{2}}\exp \left(-\frac{[\ln (y/y_{0})+2t/T]^{2}}{4t/T}\right),\end{eqnarray}$$
where the time scale
 $T$
is proportional to the inverse cube root of the enstrophy dissipation rate (Lin Reference Lin1972). Note that if one uses
 $K_{rel}=\unicode[STIX]{x1D705}t^{b}$
instead of
 $K_{rel}=\unicode[STIX]{x1D705}y^{a}$
in (5.6), a different p.d.f. can be obtained, in particular a Gaussian form in three dimensions for
 $b=3$
(Batchelor Reference Batchelor1952a
). In 3D turbulent experiments, Ouellette et al. (Reference Ouellette, Xu, Bourgoin and Bodenschat2006) showed the dependence of the observed p.d.f. on the initial pair separations, which suggests that in particular cases (5.8) is preferable to (5.9) when comparing with observations.
Probability density functions of pair separations for (a)
 $\unicode[STIX]{x1D6FC}=2$
and (b)
 $\unicode[STIX]{x1D6FC}=1$
at different values of
 $t_{m}$
. In panel (a), the p.d.f.s are shown as a function of the rescaled variable
 $(y/y_{0})^{1/\unicode[STIX]{x1D70E}}=\exp [(1/\unicode[STIX]{x1D70E})(\log y-\log y_{0})]$
, where
 $\unicode[STIX]{x1D70E}$
is the standard deviation of the p.d.f. in log space. The Lundgren distribution is represented by the black dashed curve. In panel (b), the p.d.f.s are shown as a function of
 $y/y_{0}$
. The dashed lines correspond to the Richardson solutions. In all cases the initial separation of particle pairs corresponds to
 $k_{0}=512$
.

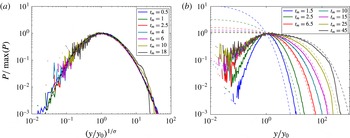
Figure 11 presents the p.d.f. observed at different times, and with
 $k_{0}=2\unicode[STIX]{x03C0}/y_{0}=512$
, for the two extreme cases (a)
 $\unicode[STIX]{x1D6FC}=2$
(QGBT) and (b)
 $\unicode[STIX]{x1D6FC}=1$
(SQG) corresponding to
 $a=2$
and
 $a=4/3$
, respectively.
Figure 11(a) indicates that the case
 $\unicode[STIX]{x1D6FC}=2$
is representative of a Lundgren law, at least for
 $t_{m}\leqslant 10$
. Note that the correction
 $2t/T$
in (5.10) was found to be small. The adequacy of the Lundgren law in representing the dispersion p.d.f. provides strong support for non-local dispersion, in a more unambiguous way than the dispersion, diffusivity or FSLE. For larger times and
 $y$
much larger than its initial value, the p.d.f. is less well approximated by this law. This particularly occurs for the right tail of the p.d.f. even at
 $t_{m}>6$
and is in agreement with the fact that at such times the exponential dispersion law is not observed (figure 7
b). In the case
 $\unicode[STIX]{x1D6FC}=1$
(figure 11
b), the separation p.d.f. substantially differs from the Lundgren solution compared to the other case but is reasonably well captured by the prediction of (5.9) with
 $a=4/3$
, corresponding to a Richardson distribution, in the range
 $6.5\leqslant t_{m}\leqslant 25$
. The strong fluctuations of the p.d.f.s visible in figure 11(a,b) for
 $y<y_{0}$
are due to limited statistics at very small separations.
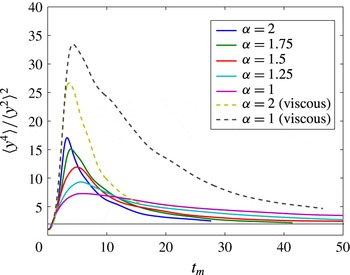
The p.d.f. allows one to compute all moments such as, for example, relative dispersion. Interesting information is also provided by the kurtosis of relative displacements, which samples the high tails of the distribution corresponding to rare and very large particle separations. It is defined as
 $$\begin{eqnarray}ku(t)=\frac{\langle y^{4}\rangle }{\langle y^{2}\rangle ^{2}}.\end{eqnarray}$$
For a Rayleigh distribution (the expected one for a normally distributed random process and in the diffusive limit of dispersion),
 $ku=2$
(LaCasce Reference LaCasce2010). In the Richardson regime, the kurtosis would attain a value close to
 $5.6$
, while it would exponentially grow in time in the (marginally) non-local regime of the enstrophy cascade (associated with exponential growth of relative dispersion) as shown by LaCasce (Reference LaCasce2010).
Relative displacement kurtosis as a function of
 $t_{m}$
; here
 $k_{0}=512$
. The black thin line corresponds to a kurtosis of
 $\langle y^{4}\rangle /\langle y^{2}\rangle ^{2}=2$
(representative of a Rayleigh distribution).

Figure 12 presents the time evolution of kurtosis for initial particle separations corresponding to
 $k_{0}=512$
. There is a clear difference between simulations with
 $\unicode[STIX]{x1D6FC}\geqslant 1.75$
or the viscous ones, whose kurtosis reaches values larger than
 $15$
, and simulations with
 $\unicode[STIX]{x1D6FC}\leqslant 1.5$
, whose kurtosis does not exceed
 $12$
and is not so prominently peaked. The behaviour for
 $\unicode[STIX]{x1D6FC}=2$
and the viscous runs is in reasonable agreement with an exponential growth of separation and a dispersion process driven by large scales (LaCasce Reference LaCasce2008) and seems to be in agreement with the FSLE.
6 Conclusions
We examined a class of generalized 2D turbulent flows (
 $\unicode[STIX]{x1D6FC}$
-turbulence models), encompassing the QGBT and SQG models as limiting cases (Pierrehumbert et al.
Reference Pierrehumbert, Held and Swanson1994). All of these models have dynamics characterized by the conservation of an active tracer along the geostrophic flow with a direct cascade of tracer variance to small scales. As expected, the numerically computed kinetic energy spectral slopes are close to the predictions based on phenomenological arguments for
 $1\leqslant \unicode[STIX]{x1D6FC}<2$
, while the spectrum was found to be quite steep in our simulations for
 $\unicode[STIX]{x1D6FC}=2$
(probably due to numerical dissipation effects) and the two viscous runs. We examined the spectral transfers of active tracer variance between scales and found that both local and non-local triads contribute to the transfers, contrary to the general phenomenology assumption.
We further analysed relative dispersion statistics both as a function of time and as a function of scale in order to see how the phenomenological scaling laws predicted by local self-similarity arguments were verified. As in previous studies, we found that the scalings of relative dispersion as a function of time are difficult to assess, due to the strong dependence on initial pair separations. In particular, the exponential growth of relative dispersion in the case of
 $\unicode[STIX]{x1D6FC}=2$
was observed for a limited range of time, even for initial separations much smaller than the inertial range scales. In that respect, different fixed-scale statistical indicators were able to reveal this exponential growth. For
 $1\leqslant \unicode[STIX]{x1D6FC}<2$
, relative dispersion was found to follow the power laws expected from local cascade theories. This is more true when
 $\unicode[STIX]{x1D6FC}$
is close to
 $1$
and the initial pair separation is small. Finally, the relative displacement p.d.f.s were consistent with a Lundgren distribution for
 $\unicode[STIX]{x1D6FC}=2$
and a Richardson distribution for
 $\unicode[STIX]{x1D6FC}=1$
.
This study has provided evidence that relative dispersion in SQG turbulent flows (
 $\unicode[STIX]{x1D6FC}=1$
) is local, in the sense that small-scale eddies govern relative dispersion at their scale, while in QGBT flows (
 $\unicode[STIX]{x1D6FC}=2$
) dispersion is governed by large-scale eddies (non-local dispersion). Hence large-scale eddies have little effect on the dispersion in SQG flows when considering small enough separations. An unexpected element is that, for the SQG case and more generally for
 $\unicode[STIX]{x1D6FC}<2$
, spectral transfers of the active tracer variance between scales have both local and non-local components, i.e. modes associated with very different wavenumbers do contribute to the transfer. Hence, the concept of local/non-local interactions in the cascade of an active scalar does not seem to be straightforwardly related to that of locality of particle dispersion. In our opinion, what matters for the dispersion of particles is the self-similar character of the turbulent dynamics, which determines both the spectral behaviour of the flow and the dispersion laws.
This result was obtained in the context of freely decaying simulations with a kinetic energy peak at large scale. It would be interesting to examine the case of forced simulations with the simultaneous presence of both a direct and an inverse cascade. Another interesting question would be to compare the dispersion in different
 $\unicode[STIX]{x1D6FC}$
-turbulence models having the same kinetic energy spectrum but different cascade directions. In this class of models, the QGBT inverse cascade has a typical
 $k^{-5/3}$
law for the kinetic energy spectrum, which is similar to the kinetic energy spectrum of the SQG direct cascade. Comparing models with similar kinetic energy spectral slopes would allow one to assess the different features of the turbulent dynamics that determine the relative dispersion characteristics.
Acknowledgements
We thank anonymous reviewers who helped to improve the manuscript with their constructive comments. X.P. acknowledges the funding support of ANR ASIV (ANR-11-Blanc-5-6-014). This work is a contribution to the SWOT project and was supported by TOSCA/CNES.
Supplementary material
Supplementary material is available at https://doi.org/10.1017/jfm.2017.253.
Appendix A. Coarse-grained transfer function
The transfer of tracer variance towards wavevector
 $\boldsymbol{k}$
is simply expressed as
 $$\begin{eqnarray}-\text{Re}(\widehat{q}_{\boldsymbol{k}}^{\,\ast }(\widehat{\boldsymbol{u}\boldsymbol{\cdot }\unicode[STIX]{x1D735}q})_{\boldsymbol{ k}}).\end{eqnarray}$$
This can be further expanded if we introduce wavevectors
 $\boldsymbol{l}$
and
 $\boldsymbol{m}$
as
 $$\begin{eqnarray}-\text{Re}\left(\widehat{q}_{\boldsymbol{k}}^{\,\ast }\,\mathop{\sum }_{\boldsymbol{l}+\boldsymbol{m}=\boldsymbol{k}}(\widehat{\boldsymbol{u}_{\boldsymbol{l}}\boldsymbol{\cdot }\unicode[STIX]{x1D735}q_{\boldsymbol{m}}})\right),\end{eqnarray}$$
where
 $\boldsymbol{u}_{\boldsymbol{l}}$
is the component of the velocity corresponding only to the wavevector
 $\boldsymbol{l}$
and
 $q_{\boldsymbol{m}}$
is the tracer component corresponding to wavevector
 $\boldsymbol{m}$
.
Let us now subdivide the wavenumber space into circular shells
 $k_{0}<\cdots <k_{n}<k_{n+1}<\cdots <k_{N}$
,
 $l_{0}<\cdots <l_{a}<l_{a+1}<\cdots <l_{N}$
and
 $m_{0}<\cdots <m_{b}<m_{b+1}<\cdots <m_{N}$
. The contribution to the flux for the shell
 $k_{n}<k<k_{n+1}$
(see (4.2)) can be decomposed into individual transfers:
 $$\begin{eqnarray}\displaystyle T(n|a,b) & = & \displaystyle -\mathop{\sum }_{k_{n}<|\boldsymbol{k}|<k_{n+1}}\mathop{\sum }_{l_{a}<|\boldsymbol{l}|<l_{a+1}}\mathop{\sum }_{m_{b}<|\boldsymbol{m}|<m_{b+1}}\unicode[STIX]{x1D6FF}_{\boldsymbol{k}=\boldsymbol{l}+\boldsymbol{m}}\nonumber\\ \displaystyle & & \displaystyle \times \,\text{Re}\left(\widehat{q}_{n,n+1}^{\,\ast }[(\widehat{\boldsymbol{u}_{\boldsymbol{a},\boldsymbol{a}+1}\boldsymbol{\cdot }\unicode[STIX]{x1D735}q_{b,b+1}})+(\widehat{\boldsymbol{u}_{\boldsymbol{b},\boldsymbol{b}+1}\boldsymbol{\cdot }\unicode[STIX]{x1D735}q_{a,a+1}})]\right),\end{eqnarray}$$
with
 $F_{x,x+1}$
being the restriction of
 $F$
to the shell with
 $k_{x}<|\boldsymbol{k}|<k_{x+1}$
and
 $\unicode[STIX]{x1D6FF}$
the Kronecker symbol. In (A 3), the quantity
 $T(n|a,b)$
represents the transfer of tracer variance from shells
 $l_{a}<l<l_{a+1}$
and
 $m_{b}<m<m_{b+1}$
to shell
 $k_{n}<k<k_{n+1}$
.