


1. Introduction
Aquatic swimming and bird/insect flying have fascinated scientists for many years regarding how body motion generates required propulsion to overcome their drag or enough lift to support their weight, on which extensive experimental (Schouveiler, Hover & Triantafyllou Reference Schouveiler, Hover and Triantafyllou2005b; Ristroph, Liao & Zhang Reference Ristroph, Liao and Zhang2015; Van Buren et al. Reference Van Buren, Floryan, Quinn and Smits2017) and numerical studies (Wang et al. Reference Wang, Ryu, He, Qin and Sung2020; Yao & Yeo Reference Yao and Yeo2020; Zhang, Sung & Huang Reference Zhang, Sung and Huang2020) have been performed. Major mechanisms employed by animals to improve their performance include the added-mass effect (Sane Reference Sane2003), leading-edge vortex (LEV) effect (Birch & Dickinson Reference Birch and Dickinson2001; Garmann, Visbal & Orkwis Reference Garmann, Visbal and Orkwis2013; Bottom et al. Reference Bottom, Borazjani, Blevins and Lauder2016), trailing-edge vortex (TEV) effect (Bomphrey et al. Reference Bomphrey, Nakata, Phillips and Walker2017), etc.
It has been reported that LEV attachment on the wing surface makes a major contribution to lift enhancement because the LEV can generate a low-pressure region on the suction side (Muijres et al. Reference Muijres, Johansson, Barfield, Wolf, Spedding and Hedenström2008; Han, Chang & Cho Reference Han, Chang and Cho2015). Many flying animals employ unique mechanisms to strengthen the LEV, thus enhancing the lift force. For example, common swifts keep their hand wings swept back when gliding so that the LEV is generated at a small attack angle, which increases the lift force (Videler, Stamhuis & Povel Reference Videler, Stamhuis and Povel2004). Hummingbirds and cicadas strengthen the LEVs near the wing root through the generation of a thorax vortex due to wing–body interaction, leading to total lift increases of 18.7 % and 29 %, as reported in numerical studies (Liu, Dong & Li Reference Liu, Dong and Li2016; Wang et al. Reference Wang, Ren, Li and Dong2019).
Moreover, it is noteworthy that flexible deformation is another mechanism employed widely by animals to enhance performance. Thielicke & Stamhuis (Reference Thielicke and Stamhuis2018) compared the aerodynamic performance of twisted and non-twisted wings and found that wing twist keeps the average effective attack angle at a low range, reduces the bound circulation and thus decreases the lift and drag. Nevertheless, the twist can increase the efficiency, indicating that twist deformation is beneficial only in cruising flight rather than taking off, landing or manoeuvring, in which larger forces are required. Shumway, Gabryszuk & Laurence (Reference Shumway, Gabryszuk and Laurence2020) investigated the impact of dragonfly wing deformations on aerodynamic performance. During the upstroke, both the deforming forewings and the hindwings generate smaller lift and thrust forces than the rigid model, whereas during the downstroke, deforming forewings produce higher negative lift and thrust, while deforming hindwings produce lower lift but higher thrust. The difference in force is also related to LEV formation. Zhang & Huang (Reference Zhang and Huang2019) found that the deformation of mosquito wings can stabilize delayed stalls and decrease the maximum power by 26 %. The flexibility effect on the performance can also be found in Heathcote, Wang & Gursul (Reference Heathcote, Wang and Gursul2008), Kim & Lee (Reference Kim and Lee2019) and Shoele & Zhu (Reference Shoele and Zhu2013).
For aquatic animals, there are two main thrust generation mechanisms using their body/caudal fin or median/pectoral fin: the added-mass (reactive) mechanism (Gray Reference Gray1933) and the lift-based (vorticity, circulatory) mechanism (Bottom et al. Reference Bottom, Borazjani, Blevins and Lauder2016). In the added-mass mechanism, thrust comes from the reactive force generated by the accelerated fluid when the fish moves its body. Fish that use this mechanism, such as eels, have large undulations from head to tail (Sfakiotakis, Lane & Davies Reference Sfakiotakis, Lane and Davies1999). In the lift-based mechanism, thrust comes from the component of lift in the swimming direction, in which the lift is generated by the flow circulation around the fins and acts similarly to airfoils and flying animals. This mechanism is typically used by oscillatory swimmers, such as tuna, which have fewer undulations of the body and more oscillations of the tail than other aquatic animals. The classification details of swimming modes can be seen in Sfakiotakis et al. (Reference Sfakiotakis, Lane and Davies1999) and Lauder (Reference Lauder2015). As stated above, the focus of most studies has been on the LEV effect on flying animals’ lift generation. However, the LEV effect on the thrust force of aquatic animals has attracted less attention. The first evidence of a stable LEV on aquatic animals using three-dimensional numerical simulations was provided by Borazjani & Daghooghi (Reference Borazjani and Daghooghi2013). They demonstrated the existence of an attached and a detached LEV in the transitional and inertial regimes. Han, Lauder & Dong (Reference Han, Lauder and Dong2020) found that bluegill sunfish enhance the LEV by median–fin interactions. Due to the collision between the posterior body vortices at the dorsal/anal fins and LEV at caudal fins, the latter is strengthened, resulting in a 25.6 % thrust increase. Zhang et al. (Reference Zhang, Sung and Huang2020) carried out a study on the function of caudal keels for tuna swimming, in which thrust enhancement was also observed. The reason is that the caudal keels generate LEVs causing negative pressure, and the enhancement becomes more significant as the Strouhal number and Reynolds number increase.
People usually employed anguilliform and subcarangiform as prototypical examples for undulatory swimming, and put forward carangiform and thunniform for oscillatory swimming. Batoid fish are special aquatic animals that have a dorsoventrally flattened body and expanded pectoral fins. Batoids are a monophyletic group of over 500 elasmobranch species (Hamlett Reference Hamlett1999), which include the manta ray, stingray and sawfish. Rosenberger (Reference Rosenberger2001) classified batoid fish movements from undulatory to oscillatory, called rajiform and mobuliform. Analogous to that of flying animals, batoid oscillatory swimming employs the lift-based mechanism (Bottom et al. Reference Bottom, Borazjani, Blevins and Lauder2016) for propulsion. Different from the body and/or caudal fin (Breder Reference Breder1926) propulsion mode, batoid fish swim by flapping their pectoral fins associated with a wave directing chordwise through the fins. Although there has been an investigation (Bottom et al. Reference Bottom, Borazjani, Blevins and Lauder2016) that reported LEV formation in the stingray, an undulatory batoid swimmer, the effect of the LEV on the oscillatory mode is not fully understood. Moreover, a key difference between the batoids and other animals is that batoids can use active deformation rather than passive flexibility to control the wavelength of the actuating waveform by muscle action (Rosenberger Reference Rosenberger2001; Smits Reference Smits2019). The effect of the active deformation on the LEV has not been investigated. An earlier work (Thekkethil, Sharma & Agrawal Reference Thekkethil, Sharma and Agrawal2020b) investigated the effect of chordwise wavelengths on force production. However, the model was simplified into an ellipsoid with a hydrofoil section, and the focus was to identify the near-field wake structures. It is still unclear whether vortical structures are actually associated with the aforementioned force enhancement mechanisms and how these phenomena are affected by active deformation. In addition, it has been observed that the vertical displacements of fin tips are not symmetrical to the longitudinal axis of the body (Fish et al. Reference Fish, Schreiber, Moored, Liu, Dong and Bart-Smith2016). Generally, the half-amplitude above the longitudinal axis is larger than that below the longitudinal axis. The effect of such asymmetrical stroke motion on the hydrodynamic performance is still unknown.
This work aims to establish an understanding of the potential hydrodynamic performance enhancement mechanism and the associated vortex dynamics related to the chordwise active deformation and asymmetrical half-amplitude. A three-dimensional (3-D) model of the cownose ray (Rhinoptera javanica) constructed in our previous work is employed, and the active chordwise deformation is prescribed as a travelling wave based on our measurement data. Lift and thrust forces computed using the immersed boundary (IB) method are compared by varying the chordwise deformation and half-amplitude ratio ( $HAR$). The flow mechanism is investigated by analysing the vorticity field and the pressure distribution. Derivative-moment transformation (DMT) theory is employed to analyse the vortex contribution. The current paper is organized as follows. In § 2, the physical problem is given, including the cownose ray model with kinematic data and the deformation description. The numerical method and simulation set-up are then presented in § 3. In §§ 4, 5 and 6, the simulation results are discussed in the context of hydrodynamic performance and vortex dynamics. Conclusions are summarized in § 7.
2. Cownose ray model and problem definition
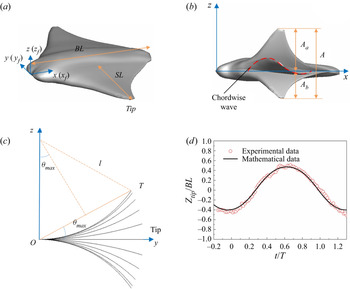
In this work, the geometry of the present 3-D cownose ray model is adopted from our previous study (Huang, Zhang & Pan Reference Huang, Zhang and Pan2020), in which the geometric complexity can be captured precisely, as shown in figure 1 $(a)$. Key geometric and kinematic quantities associated with this model are defined in figures 1
 $(a)$ and 1
 $(b)$, where
 $BL$ and
 $SL$ denote the body length and the spanwise length, respectively, while
 $A_a$ and
 $A_b$ describe the half-amplitudes above and below the longitudinal axis (
 $x$) of the body, respectively.
( $a$) The cownose ray model in a flat position and the coordinate system for the mathematical kinematic model. (
 $b$) Lateral view of the cownose ray model. The red dashed line represents the travelling wave in the chordwise direction. (
 $c$) The spanwise deformation of the pectoral fin in the front view at different snapshots. (
 $d$) Comparison of pectoral fin tip trajectory between the present experimental data and the present mathematical model.

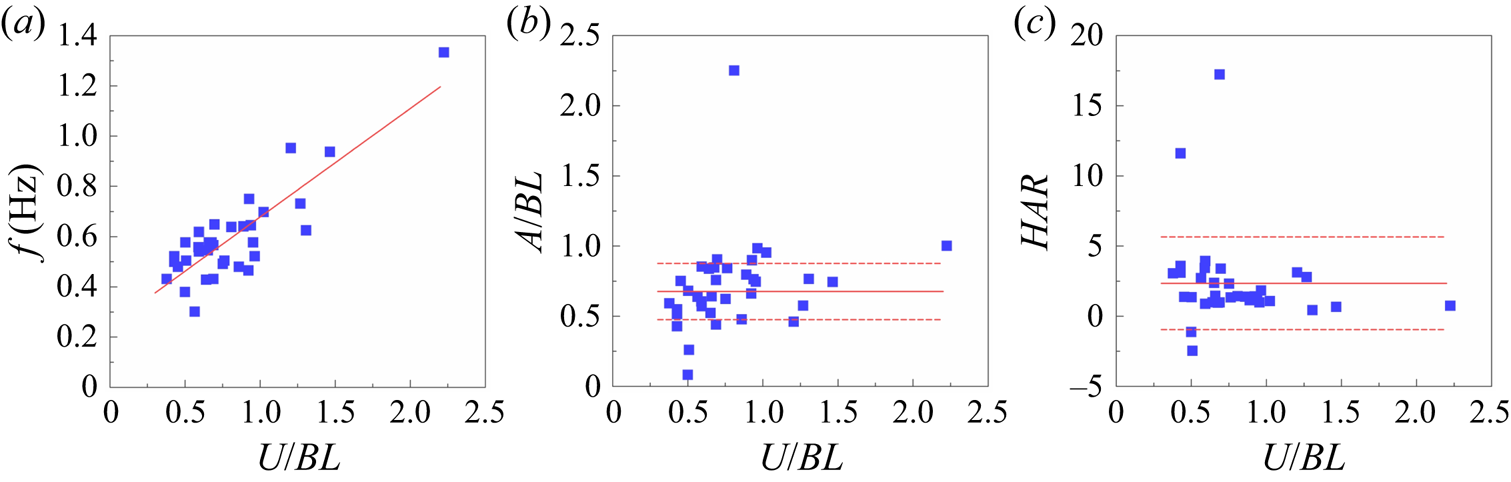
Fin kinematic data were obtained from our previously acquired recordings of free-swimming cownose ray specimens at an aquarium (Huang et al. Reference Huang, Zhang and Pan2020). A high-resolution digital camera was used to record images at a frequency of 60 Hz. A curved spanwise deformation and chordwise travelling wave can apparently be observed. Approximately 40 recordings were collected, and the kinematics were analysed by tracking the swimmers’ head, tail base and pectoral fin tip. The relationships of pectoral fin deformation kinematics, such as frequency ( $f$), tip-to-tip amplitude (
 $A$), half-amplitude ratio (
 $HAR$, defined as
 $A_a/A_b$) and swimming speed (
 $U$), are presented in figure 2. The frequency
 $f$ increases linearly along with the swimming speed with a statistically significant change (figure 2
 $a$;
 $r^{2} = 0.723$,
 $P<0.001$), whereas
 $A$ (figure 2
 $b$;
 $r^{2} = 0.176$,
 $P = 0.012$) and
 $HAR$ (figure 2
 $c$;
 $r^{2}=0.035$,
 $P = 0.280$) do not exhibit a statistically significant change with
 $U$. The mean values with standard deviations for
 $A$ and
 $HAR$ are
 $0.676 \pm 0.201 BL$ and
 $2.343 \pm 3.304$, respectively.
Relationships of deformation kinematics with swimming speed for all cownose ray specimens recorded: ( $a$) frequency
 $f$ increases with
 $U$, where the red line shows the regression for the data, (
 $b$) tip-to-tip amplitude
 $A$ and (
 $c$) half-amplitude ratio
 $HAR$ remain constant over the range of
 $U$, where the solid red lines indicate the mean value and the dashed red lines show the mean values
 $\pm$ standard deviations.

To describe the flapping motion of cownose ray, similar to previous work (Fish et al. Reference Fish, Schreiber, Moored, Liu, Dong and Bart-Smith2016), a mathematical approximation taking both spanwise and chordwise deformations into consideration, but without regard to the half-amplitude asymmetry, is introduced as follows:
 \begin{equation} \left. \begin{aligned}
x(x_f,y_f,t) =x_f \\ y(x_f,y_f,t) =y_f(1-(1-k) \lvert
f(x_f,t)\lvert y_f/SL)\cos[\theta_{max}y_f/SL \cdot
f(x_f,t)] \\ z(x_f,y_f,t) =z_f + y_f(1-(1-k) \lvert
f(x_f,t)\lvert y_f/SL)\sin[\theta_{max}y_f/SL \cdot
f(x_f,t)] \\ f(x_f,t)=\sin(\omega t -2{\rm \pi} W
x_f/BL), \end{aligned} \right\}
\end{equation}
where ( $x_f$,
 $y_f$) defines the neutral plane of the pectoral fins in a flat position (figure 1
 $a$) and (
 $x$,
 $y$,
 $z$) are deformed coordinates at time
 $t$. The active chordwise deformation is presented by a non-dimensional wavenumber
 $W$, defined as
 $W=BL/\lambda$, where
 $\lambda$ is the wavelength of the chordwise travelling wave. Thus, a larger
 $W$ represents a larger chordwise deformation. In addition,
 $\omega$ is the angular frequency, and
 $k$ and
 $\theta _{max}$ are parameters enabling the deformation to fit the biological measurements along the entire span. As shown in figure 1
 $(c)$, it is assumed that the spanwise curve can be treated as an arc
 $\mathop{{oT}}\limits^\frown$ with a radius of
 $l$. The deviation angle
 $\theta$ is defined by the straight line
 $oT$ joining the fin root and tip. When the fin tip reaches the highest position, the parameter
 $k$ represents the ratio of the straight line
 $oT$ to the arc length
 $\mathop{{oT}}\limits^\frown$, i.e.
 $k=2l\sin \theta _{max} /(l \times 2\theta _{max})$. Then, the half-amplitude
 $A_a$ or
 $A_b$ can be used to resolve the linear equation for
 $\theta _{max}$ by substituting
 $y_f=SL$ into the expression of
 $z(x_f,y_f,t)$ in (2.1), i.e.
 \begin{equation} SL(1-(1-k) SL/SL)\sin(\theta_{max}SL/SL )=A_a. \end{equation}
In our simulations, for the half-amplitude of  $A_a$ or
 $A_b =0.35$
 $BL$, a value of
 $\theta _{max} = 0.488$ and
 $k = 0.960779$ can be determined for the model.
For the half-amplitude asymmetrical motion, we added two parameters  $a$ and
 $b$ into the equation of
 $f(x_f,t)$ as follows:
 \begin{equation} f(x_f,t) =(\sin(\omega t-2 {\rm \pi}W x_f/BL)+a)/b, \end{equation}
where  $1> a >0$ and
 $b-a=1$ for an asymmetrical motion
 $HAR>1$.
Validations of the pectoral fin kinematics were conducted by comparing the fin tip trajectories for  $A_a=0.47BL$,
 $A_b=0.39BL$,
 $HAR=1.22$,
 $W=0.4$ and
 $f=0.75$ Hz between the present model and the experimental data, as shown in figure 1
 $(d)$. The comparison presents good agreement, and a chordwise travelling wave can be observed in figure 1
 $(b)$, indicating that the chordwise deformation can be precisely represented by our mathematical model.
3. Numerical method
To effectively simulate fluid flow with complex moving boundaries, the IB-simplified sphere function-based gas kinetic scheme (SGKS) solver is employed in this work. Details about this method can be found in our works of Yang, Shu & Wu (Reference Yang, Shu and Wu2015); Yang et al. (Reference Yang, Shu, Wang and Sun2016, Reference Yang, Shu, Yang, Wang and Wu2017). This solver has been successfully applied in simulations of flapping propulsion, and validations can be found in previous studies (Lin et al. Reference Lin, Wu, Zhang and Yang2019a,Reference Lin, Wu, Zhang and Yangb; Lin, Wu & Zhang Reference Lin, Wu and Zhang2021).
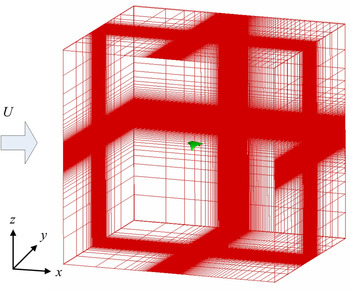
In the present study, the computational domain size was chosen as  $16BL \times 16BL \times 16BL$. The domain was discretized on a non-uniform Cartesian mesh with
 $221 \times 201 \times 201$ (approximately 8.93 million) grid points in total. As shown in figure 3, a rectangular region with high-resolution uniform grids (with spacing
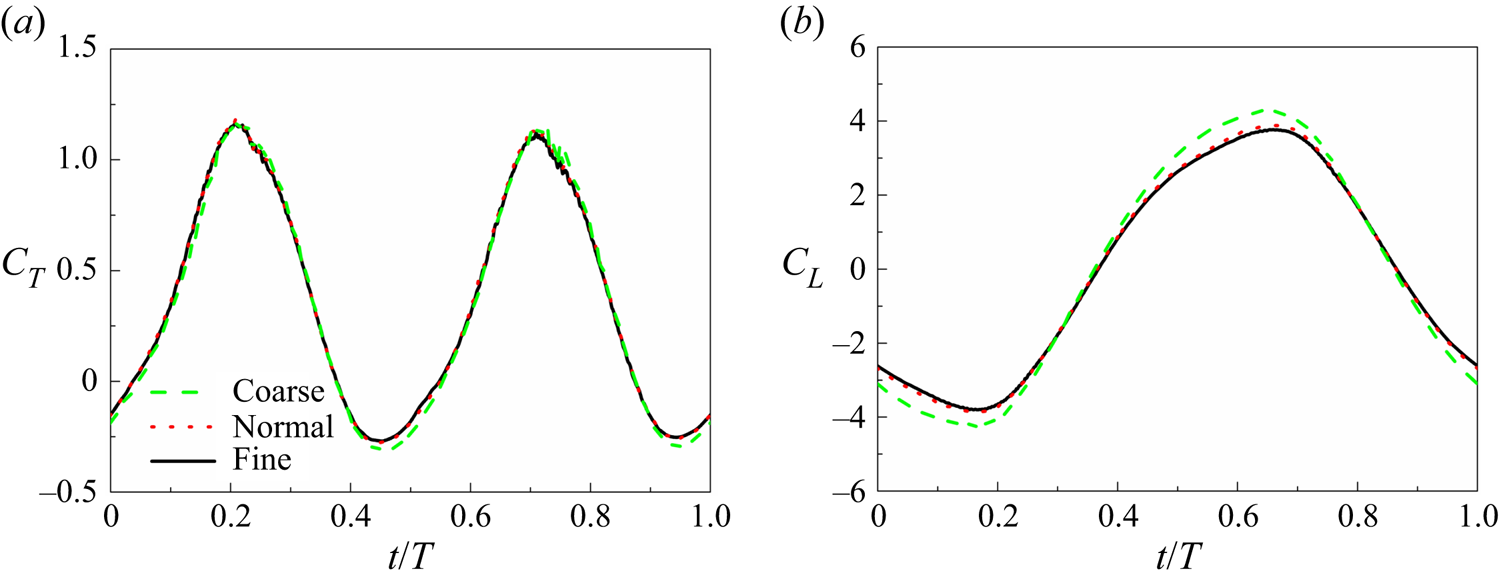
 $\Delta x = 0.014BL$) was designed to solve the near-wake vortex structures. To preclude grid dependence of the simulations, a grid-independent study was conducted on two other grid resolutions, i.e. coarse (approximately 6.85 million) and fine (approximately 13.39 million) grids. Figures 4
 $(a)$ and 4
 $(b)$ compare the corresponding instantaneous thrust and lift coefficients, respectively. It is shown that compared with the fine grid, the maximum differences in the thrust (
 $t/T=0.45$) are 14.1 % and 1.09 %, for the coarse and normal grids respectively, and are 9.12 % and 2.00 % in the lift (
 $t/T=0.66$). Therefore, in all the following simulations, the normal grid is employed.
Schematic of the computational domain and mesh.

Grid independence test on the ( $a$) thrust coefficient and (
 $b$) lift coefficient with three different grids, i.e. the coarse grid (
 $201\times 181\times 181 = 6.85$ million,
 $\Delta x = 0.017BL$), the normal grid (
 $221\times 201\times 201 = 8.93$ million,
 $\Delta x= 0.014BL$) and the fine grid (
 $251\times 231\times 231 = 13.39$ million,
 $\Delta x = 0.010BL$).

Moreover, the computational time step was set to satisfy the Courant–Friedrichs–Lewy (CFL) number  $CFL=0.5$. This time step was based on a time-step independence study, in which the thrust force coefficients differ by 1.57 % and 0.88 %, respectively, between a larger time step (
 $CFL=0.6$), current time step and a smaller time step (
 $CFL=0.3$). The relative difference in the lift coefficients are 0.75 % and 0.29 %, respectively. For the boundary condition set-up, at the inlet boundary, a constant velocity was provided. At the other boundaries, we applied a zero-normal-gradient condition.
According to the biological data in the present study (see § 2), the Reynolds number ( $Re=U BL/\nu$, with
 $\nu$ the kinematic viscosity of fluid) of cownose ray ranges from
 $5.04 \times 10^{4}$ to
 $3.70 \times 10^{5}$, at which the model swims in the inertial regime. The purpose of the present simulations is to investigate the variation in hydrodynamic force between different models and capture the key features of the wake structures to address the fundamental hydrodynamic performance enhancement mechanisms of a batoid-like model's swimming; thus, a low
 $Re$ value can meet the requirements of both the above purpose and computational resources. A previous study (Bozkurttas et al. Reference Bozkurttas, Mittal, Dong, Lauder and Madden2009) showed that as the
 $Re$ is reduced by a factor of approximately 10, there is a 40 % reduction in the forces with a similar temporal variation, and only some small-scale vortex structures dissipate. An insensitivity is observed for the hydrodynamic mechanisms and qualitative features of the flows for
 $Re$ values ranging from 540 to 6300. Some other studies (Anderson et al. Reference Anderson, Streitlien, Barrett and Triantafyllou1998; Zhang et al. Reference Zhang, Pan, Chao and Zhang2018) also demonstrated little qualitative change in the flows of flapping foil within the range of
 $Re$
 $O(10^{3})$ to
 $O(10^{5})$. Since the IB method needs a large number of grid elements to simulate the flow at a high
 $Re$ value, which may lead to a considerable computational cost, the Reynolds number is set to 2220 in the current simulations. At this
 $Re$ value, the inertial force still dominates the flow.
4. Effects of chordwise deformation
We first investigate the effects of chordwise deformation by presenting the numerical results of the constructed model with three wavenumbers ( $W = 0$, 0.4, 0.8). In this section, to focus on the chordwise deformation effects, the half-amplitude asymmetry is not considered, and the frequency
 $f$ and tip-to-tip amplitude
 $A$ are fixed at 1.0 Hz and
 $0.7BL$, respectively, which is in the range of
 $f$ and
 $A$ observed in our experiment (figure 2) and most batoid fishes (Rosenberger Reference Rosenberger2001). The hydrodynamic performance and wake topology are compared. Then, the effect of the half-amplitude ratio is discussed at
 $W=0.4$ and
 $f=1\,\textrm {Hz}$.
4.1. Pectoral fin kinematics
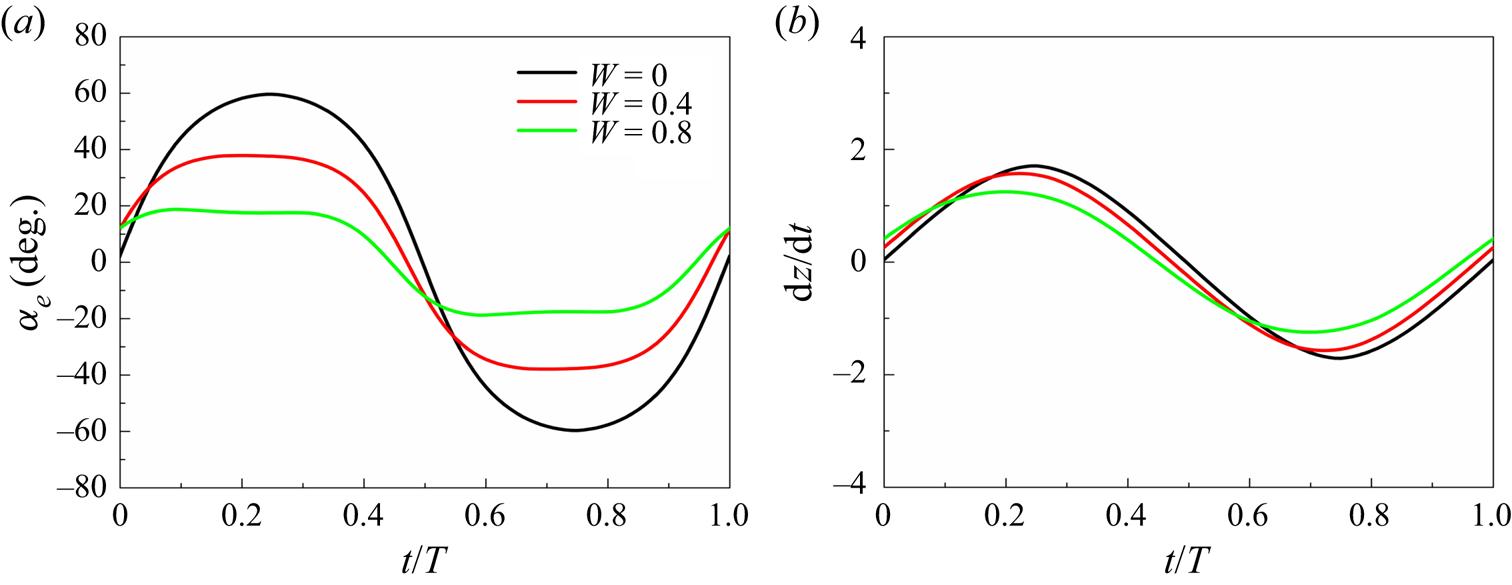
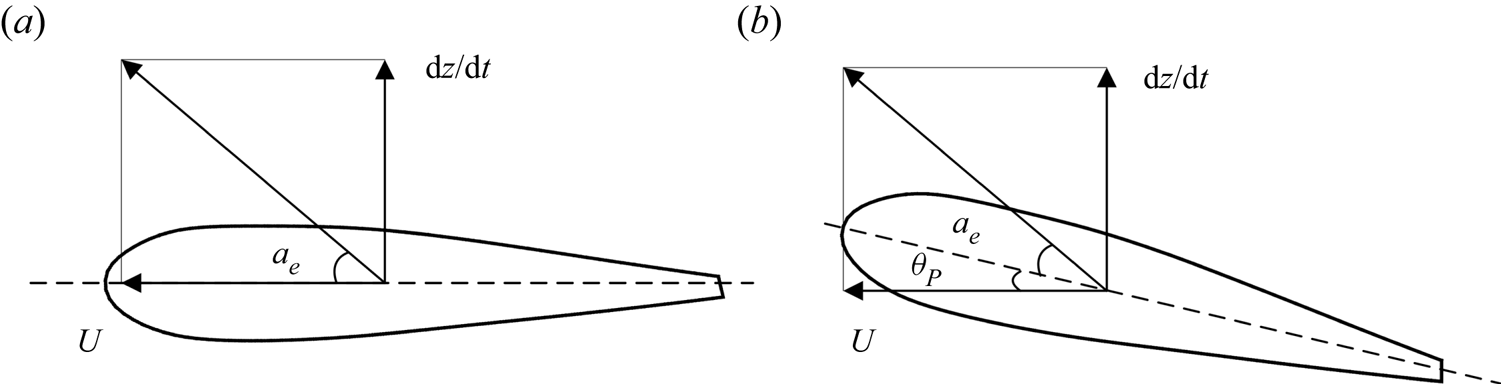
To present the variation in kinematics with varied chordwise deformation, we plotted the kinematics of the chord line at  $y/SL=0.62$ in figure 5, where the chord line is defined as the straight line connecting the leading edge and the trailing edge at the slice cut. The effective angle of attack can be given by
 \begin{equation} \alpha_{e} = \tan^{{-}1}\frac{\textrm{d}z/\textrm{d}t}{U}-\theta_p, \end{equation}
where the pitch angle  $\theta _p$ is the angle between the inflow speed
 $U$ and the section chord line, as shown in figure 6
 $(b)$. Unlike the flapping foil, which has a fixed pitching axis, the heave velocity is defined as
 $\textrm {d}z/\textrm {d}t$ at approximately the mid-chord point. Figure 6
 $(a)$ shows that the section motion at
 $W=0$ is a heaving motion and the chordwise deformation transforms the heaving motion to a combined heaving and pitching motion (figure 6
 $b$). The study of the 2-D flapping foil has shown that pitching can decrease the effective angle of attack compared with purely heaving (Schouveiler, Hover & Triantafyllou Reference Schouveiler, Hover and Triantafyllou2005a). Similarly, the present transformation results in a slight decrease in heave velocity, and the effective angle of attack decreases significantly as the wavenumber increases.
Comparisons of instantaneous ( $a$) effective angle of attack and (
 $b$) heave velocity among different wavenumbers for the
 $y/SL=0.62$ chord line. The chord line is defined as the straight line connecting the leading edge and the trailing edge at the corresponding slice cut.

Section motion of the  $y/SL=0.62$ slice cut at (
 $a$)
 $W=0$ and (
 $b$)
 $W=0.4$, which can be treated as a heaving and a combined heaving and pitching motion, respectively.

4.2. Hydrodynamic performance
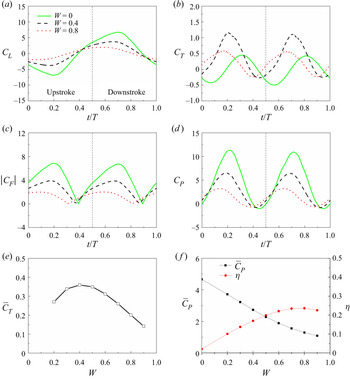
Figure 7 compares the instantaneous force coefficients of the model among the three wavenumbers. The lift force ( $F_L$, along the
 $z$-direction) and the thrust force (
 $F_T$, along the
 $x$-direction) are non-dimensionalized by
 $0.5\rho U^{2} BL^{2}$, with
 $U$ the inlet velocity, which are denoted as the lift and thrust coefficients, respectively, i.e.
 \begin{equation} C_{L,T}=\frac{F_{L,T}}{0.5\rho U^{2} BL^{2}}. \end{equation}
Note that the net thrust  $F_T$, given by the thrust produced by the motion,
 $F_x$, minus the drag force
 $D_p$, i.e.
 \begin{equation} F_T= F_x-D_p \end{equation}
is usually used to represent the thrust variation (Anderson et al. Reference Anderson, Streitlien, Barrett and Triantafyllou1998; Van Buren et al. Reference Van Buren, Floryan, Wei and Smits2018; Ryu et al. Reference Ryu, Byeon, Lee and Sung2019; Thekkethil, Sharma & Agrawal Reference Thekkethil, Sharma and Agrawal2020a). This definition is more suitable for isolated propulsors, such as oscillating foils and plates. For some animals, we can identify the caudal fin/wing/fluke as the main source of propulsive force for a fish/mammal/bird or insect, and the body as the main source of drag (Liu et al. Reference Liu, Ren, Dong, Akanyeti, Liao and Lauder2017; Han et al. Reference Han, Lauder and Dong2020; Oh et al. Reference Oh, Lee, Park, Choi and Kim2020). Therefore, we can treat the caudal fin/wing/fluke as an isolated propulsor. For the batoid fish, it is hard to distinguish the body and fins; thus, the net thrust of the full-body fish is employed here,
 \begin{equation} F_T= F_x-D_p-D_{B}, \end{equation}
where  $D_{B}$ is the drag of the body. A similar definition was also used in Thekkethil et al. (Reference Thekkethil, Sharma and Agrawal2020b) and for some anguilliform and carangiform swimmers (Maertens, Triantafyllou & Yue Reference Maertens, Triantafyllou and Yue2015; Zhang et al. Reference Zhang, Pan, Chao and Zhang2018). The input power coefficient is defined as
 \begin{equation} C_P= \frac{P}{0.5\rho U^{3} BL^{2}},P=\int_\varOmega \boldsymbol{F_L} \boldsymbol{\cdot} \boldsymbol{U_{body}}\,\textrm{d}s, \end{equation}
where  $\varOmega$ denotes the model surface,
 $\boldsymbol {F_L}$ is the Lagrangian force and
 $\boldsymbol {U_{body}}$ is the deformation velocity of the fin at each boundary element
 $\textrm {d}s$. The swimming efficiency is defined as a quasi-propulsive efficiency (Maertens et al. Reference Maertens, Triantafyllou and Yue2015) according to
 \begin{equation} \eta=\frac{(\overline{F_T} + R )U}{\bar{P}}=\frac{\overline{C_T}+C_D}{\overline{C_P}}, \end{equation}
where  $R$ is the towed resistance at speed
 $U$ without a swimming motion (i.e. the flat position in figure 1
 $a$). Here,
 $C_D$ is the towed resistance coefficient and
 $C_D=0.1044$ for the present model. To ensure that the flow field can reach the periodic state, the force variation came from the fourth flapping cycle of the simulations.
Comparisons of instantaneous ( $a$) lift, (
 $b$) thrust, (
 $c$) total force and (
 $d$) power coefficients for different wavenumbers. Variations in the cycle-averaged (
 $e$) thrust coefficient, (
 $f$) power coefficient and efficiency with the wavenumber.

Figure 7 $(a)$ shows that a positive lift force is generated during the downstroke, which is consistent with previous studies on flying animals (Liu et al. Reference Liu, Dong and Li2016; Wang et al. Reference Wang, Ren, Li and Dong2019). A nearly equal and opposite force is generated during the upstroke since all the simulations are conducted at 0 attack angle. Comparing the models with different wavenumbers, a higher lift peak is found at smaller
 $W$, especially at the mid-downstroke, indicating a lift enhancement for the smaller chordwise deformation. Figure 7
 $(b)$ shows that the model at
 $W=0.4$ experiences the largest thrust peak, which can explain why real cownose ray specimens have oscillatory fin behaviours with 0.4 wavenumbers per length (Rosenberger Reference Rosenberger2001). The model with the smallest chordwise deformation (
 $W=0$) has the smallest thrust peak. We also present the total hydrodynamic force with different deformation in figure 7
 $(c)$. The smallest chordwise deformation experiences the highest total force. This result is attributed to the lift-based mechanism (circulatory, vorticity) (Bottom et al. Reference Bottom, Borazjani, Blevins and Lauder2016) employed by oscillatory swimmers, in which the total force is created by the flow vorticity around the fins. This is consistent with the larger
 $\alpha _{e}$ at
 $W=0$ (figure 5). Similarly, the power consumption at
 $W=0$ is generally higher than those at larger wavenumbers (figure 7
 $d$), which indicates that chordwise deformation can decrease the power consumption. These can be better seen quantitatively in the average values of these coefficients and the reason for the force variations are analysed deeply in the following section.
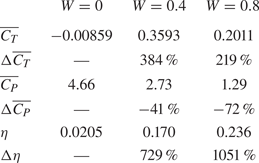
The cycle-averaged coefficients are calculated in table 1. It shows that the swimmer at  $W=0$ cannot generate a positive thrust force, i.e. there is not enough net thrust to conquer the drag. The relative thrust enhancement (
 $\Delta \overline {C_T}$) is computed as
 \begin{equation} \Delta\overline{C_T} = \frac{\overline{C_T}-\overline{C_T}\mid_{W=0}}{\overline{C_T}\mid_{W=0}+C_D}. \end{equation}
Actually, in (4.7), for the relative difference of thrust,  $\overline {C_T}\mid _{W=0}+C_D$ is used. We approximately regard the towed drag as the swimming drag, just as Maertens et al. (Reference Maertens, Triantafyllou and Yue2015) and Schultz & Webb (Reference Schultz and Webb2002) did. On one hand, the body drag
 $C_D$ avoids a negative value because at
 $W=0$ the net thrust is a negative value. On the other hand, this is a better presentation of the relative difference excluding the drag force. The relative power and efficiency enhancement are represented as
 \begin{equation} \Delta\overline{C_P}/\eta = \frac{\overline{C_P}/\eta-\overline{C_P}/\eta\mid_{W=0}}{\overline{C_P}/\eta\mid_{W=0}}. \end{equation}
The thrust is increased by approximately 384 % and 219 % at  $W =0.4$ and 0.8, respectively, which suggests a significant hydrodynamic performance enhancement due to the chordwise deformation. The effect of chordwise deformation on the instantaneous force is similar to the effect of wing deformations comprising camber and twist in a dragonfly study (Shumway et al. Reference Shumway, Gabryszuk and Laurence2020). However, the effect on the cycle-averaged force of the cownose ray is much more significant than that of flying animals. In addition, by increasing
 $W$ from 0.4 to 0.8, the enhancement in thrust decreases, indicating that moderate chordwise deformation is required for optimal thrust performance. To determine the optimal wavenumber, further simulations were performed, as shown in figure 7
 $(e)$. By increasing the wavenumber, the power consumption decreases almost linearly (figure 7
 $f$ and table 1), which is consistent with the lower lift force peak for the larger wavenumber. The least power consumption does not result in the highest swimming efficiency because the thrust production shows a peak value at the optimal wavenumber.
Cycle-averaged force coefficients and their enhancements due to chordwise deformation.

4.3. Wake topology
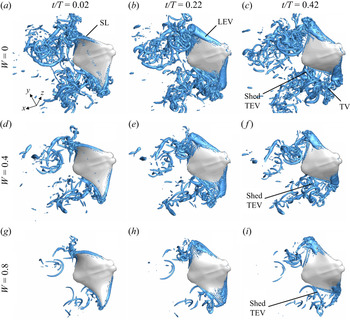
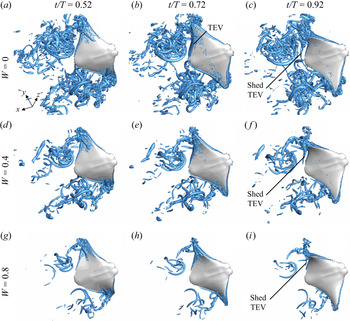
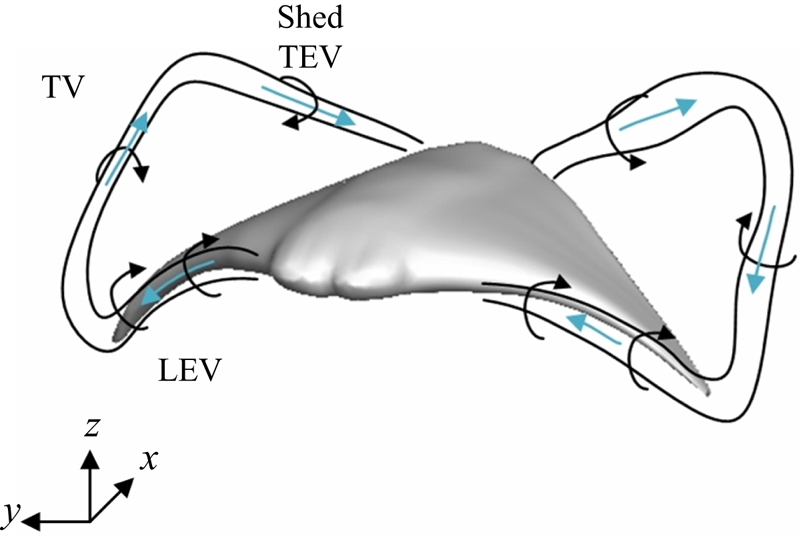
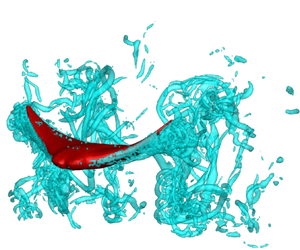
Figures 8 and 9 compare the instantaneous wake structures of cownose ray between different wavenumbers during the stroke cycle. The 3-D vortex structures are visualized by the isosurface of the  $Q$-criterion (Hunt, Wray & Moin Reference Hunt, Wray and Moin1988). The primary vortical structures include a pair of LEVs, TEVs and tip vortices (TVs). The LEV, shed TEV and TV are connected and form a vortex loop. The wake topology schematic is plotted in figure 10. These types of vortex structures can also be found in previous studies of insects and flapping foils (Liu et al. Reference Liu, Dong and Li2016; Wang et al. Reference Wang, Ren, Li and Dong2019; Thekkethil et al. Reference Thekkethil, Sharma and Agrawal2020b). However, there are some distinct features in the shape and formation of these structures among different wavenumbers. Due to the symmetry between the upstroke and downstroke motions, we discuss only the vortex evolution at the lower surface of the fins.
Comparisons of the 3-D wake structures of a cownose ray, visualized by the isosurface of  $Q=150$ among the models of (
 $a$–
 $c$)
 $W=0$, (
 $d$–
 $f$)
 $W=0.4$, (
 $g$–
 $i$)
 $W=0.8$, at (
 $a$,
 $d$,
 $g$) the early upstroke (
 $t/T=0.02$), (
 $b$,
 $e$,
 $h$) the mid-upstroke (
 $t/T=0.22$) and (
 $c$,
 $f$,
 $i$) the late upstroke (
 $t/T=0.42$).

First, the evolution of the LEVs is presented during the upstroke, as shown in figure 8. At the early upstroke ( $t/T=0.02$), shear layers (SLs) are found at the leading edge of the cownose ray's lower surface. There is no significant LEV formed for all three models. At the mid-upstroke (
 $t/T=0.22$), the SLs are strengthened into LEVs, stably attaching to the lower surface of the leading edge. Around this moment, the LEVs are in the maximum form for all three models, contributing to the force peak, as shown in figure 7. For the smaller chordwise deformation (
 $W=0$), the LEVs (figure 8
 $b$) are stronger than those of the other two models (figures 8
 $e$ and 8
 $h$) and are formed at almost the whole portion of the leading edge, whereas for the larger chordwise deformation (
 $W=0.8$), the LEVs are weaker and are formed mainly at the tip of the fins. This difference is due to the change in the effective angle of attack and heaving velocity caused by the chordwise wave (figure 5). At the late upstroke (
 $t/T=0.42$), the LEVs begin to break from the leading edge, corresponding to the significant force drop at the moment. Meanwhile, significant TVs are developed at the fin tips and form coherent TV tubes.
From the wake structures during the downstroke in figure 9, the TEVs originate from the preceding upstroke. The stroke reversal causes an LEV-to-SL shift at the early downstroke ( $t/T=0.52$); i.e. the broken LEVs from the preceding upstroke merge into the negative SL at the middle portion of the fins. At the mid-downstroke (
 $t/T=0.72$), the SLs are further developed into TEVs and are bounded to the posterior portion of the fins, and then, the TEVs are detached from the trailing edge at the late downstroke (
 $t/T=0.92$). Due to the stronger LEV for the smaller chordwise deformation, the shed TEVs at this moment become much stronger. Moreover, as seen in figure 9
 $(c)$ (
 $W=0$), the two shed TEV tubes from the left and right fins can be seen approaching the centreline of the model and connecting, whereas in figures 9
 $(f)$ and 9
 $(i)$, the corresponding TEVs are observed to approach the outboard of the fins.
Comparisons of the 3-D wake structures of a cownose ray, visualized by the isosurface of  $Q=150$ among the models of (
 $a$–
 $c$)
 $W=0$, (
 $d$–
 $f$)
 $W=0.4$ and (
 $g$–
 $i$)
 $W=0.8$, at (
 $a$,
 $d$,
 $g$) the early downstroke (
 $t/T=0.52$), (
 $b$,
 $e$,
 $h$) the mid-downstroke (
 $t/T=0.72$) and (
 $c$,
 $f$,
 $i$) the late downstroke (
 $t/T=0.92$).

Schematic of the wake structure of the cownose ray model.

4.4. Effects of local vortical structures on the forces
From the above analysis, there is a clear correlation between the force variation and vortex dynamics. The hydrodynamic performance enhancement due to chordwise deformation is a combined effect of the LEV, TEV and TV. To quantify the contribution of these vortical structures to the hydrodynamic forces, DMT (Wu, Lu & Zhuang Reference Wu, Lu and Zhuang2007), a far-field method, was employed here to compute the forces exerted on the boundaries. Unlike the classical near-field method, namely, the integration of the pressure and shear stresses on the solid surface, DMT calculates the hydrodynamic forces directly using the measured velocity field. By altering the integral domain, the effect of various local dynamic processes and structures can be revealed explicitly (Marongiu & Tognaccini Reference Marongiu and Tognaccini2010; Li & Lu Reference Li and Lu2012; Kang et al. Reference Kang, Liu, Su and Wu2018).
For a 3-D incompressible fluid domain  $V_f$, surrounding a solid body
 $B$ and bounded externally by an arbitrary control surface
 $\varSigma$, the theory developed by Wu et al. (Reference Wu, Lu and Zhuang2007) gives
 \begin{equation} \boldsymbol{F} ={-}\rho \int_{V_f}\frac{1}{2} \frac{\textrm{d}}{\textrm{d}t}( \boldsymbol{x} \times \boldsymbol{\omega}) \,\textrm{d}V -\rho \int_{V_f} \boldsymbol{l} \,\textrm{d}V -\frac{\rho}{2} \int_{\partial V_f} \boldsymbol{x} \times (\boldsymbol{n} \times \boldsymbol{l})\,\textrm{d}S + \boldsymbol{F_B}+\boldsymbol{F_\varSigma}, \end{equation}
where the domain boundary  $\partial V_f$ includes two parts: the boundary of the control surface
 $\varSigma$ and the body surface
 $\partial B$;
 $\partial B$ is deformable and described by the Lagrangian variable,
 $\boldsymbol {x}$ is the position vector measured from an origin fixed at the model centre,
 $\boldsymbol {\omega }$ is the vorticity,
 $\boldsymbol {l}=\boldsymbol {\omega } \times \boldsymbol {u}$ is the Lamb vector,
 $\boldsymbol {u}$ is the velocity field,
 $\rho$ is the fluid density,
 $\mu$ is the fluid viscosity and
 $\boldsymbol {n}$ is the normal unit of the domain boundary. The fourth term of (4.9) represents the explicit contribution of body acceleration and deformation (Wu et al. Reference Wu, Lu and Zhuang2007). The last boundary integral in (4.9),
 \begin{equation} {F_\varSigma}={-}\frac{\mu}{2} \int_{\varSigma} (\boldsymbol{x} \times [\boldsymbol{n} \times (\boldsymbol{\nabla} \times \boldsymbol{\omega})])\,\textrm{d}S - \int_{\varSigma}\mu \boldsymbol{\omega} \times \boldsymbol{n}\,\textrm{d}S \end{equation}
expresses the viscous effect on the boundaries.
In our work, the simulations were conducted using the IB method, in which the fluid is filled inside and outside the body boundary  $\partial B$ and the
 $\boldsymbol {n}$ terms on each side of the boundaries counteract each other; thus, the integration in
 $\partial B$ and the third terms in (4.9) vanish. Meanwhile, the internal fluid inside the boundary is moved with the boundaries, which generates the so-called internal mass effect (Ten Cate et al. Reference Ten Cate, Nieuwstad, Derksen and Van den Akker2002; Suzuki & Inamuro Reference Suzuki and Inamuro2011). For such reasons, DMT theory can be extended as follows for application in the IB method:
 \begin{equation} \boldsymbol{F} ={-}\rho \int_{V}\frac{1}{2} \frac{\textrm{d}}{\textrm{d}t}( \boldsymbol{x} \times \boldsymbol{\omega})\,\textrm{d}V-\rho \int_{V}\boldsymbol{l}\,\textrm{d}V + \boldsymbol{F_B}'+\boldsymbol{F_\varSigma}', \end{equation}
where  $V=V_{Out}+V_{In}$ denotes the whole fluid domain, with
 $V_{Out}$ and
 $V_{In}$ representing the fluid domains outside and inside the boundary
 $\partial B$, respectively,
 $\boldsymbol {F_B}'$ representing the internal mass effect, i.e.
 \begin{equation} \boldsymbol{F_B}'=\rho \frac{\textrm{d}}{\textrm{d}t} \int_{V_{In}} \boldsymbol{u}\,\textrm{d}V, \end{equation}
and  $\boldsymbol {F_\varSigma }'$ is expressed as
 \begin{equation} \boldsymbol{F_{\varSigma}}'=\boldsymbol{F_{\varSigma}} -\frac{\rho}{2} \int_{ \varSigma} \boldsymbol{x} \times (\boldsymbol{n} \times \boldsymbol{l})\,\textrm{d}S. \end{equation}
Moreover, Kang et al. (Reference Kang, Liu, Su and Wu2018) found that if a special  $\varSigma$ is employed to avoid cutting any discrete vortical structures, all surface integrals over
 $\varSigma$ disappear. For this reason, the control domain
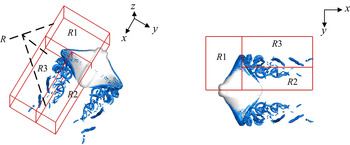
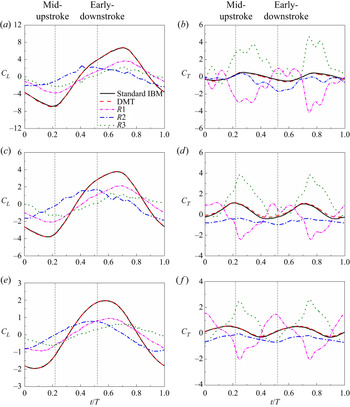
 $R$, large enough to contain all the vortical structures, is chosen as the control volume, as shown in figure 11. The hydrodynamic forces calculated by the standard IB method and the improved DMT expression (4.11) are compared in figure 12, which can validate the DMT-based force expression.
Schematics of control volume  $R$ (
 $R1+R2+R3$) and subdomain divisions in which the LEV, TEV and TV can be captured in
 $R1$,
 $R2$ and
 $R3$, respectively. Only half of the domains are displayed due to the model being symmetric.

The contribution of subdomains  $R1$,
 $R2$ and
 $R3$ to the (
 $a$,
 $c$,
 $e$) lift and (
 $b$,
 $d$,
 $f$) thrust at (
 $a$,
 $b$)
 $W=0$, (
 $c$,
 $d$)
 $W=0.4$ and (
 $e$,
 $f$)
 $W=0.8$. The solid black lines and dashed red lines are calculated by standard IB method and DMT expression (4.11), respectively.

To examine the contribution of different vortical structures, the control domain  $R$ is further divided into three subdomains
 $R1$,
 $R2$ and
 $R3$ to capture the LEVs, TEVs and TVs, respectively, as shown in figure 11. The integral term of expression (4.11) in each subdomain is compared, as shown in figure 12. The major part of the thrust is associated with the contribution of
 $R3$, whereas
 $R1$ and
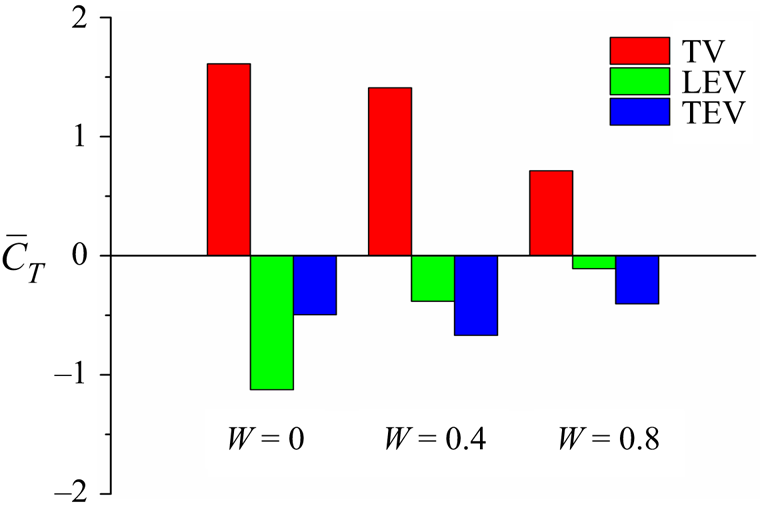
 $R2$ mainly make an unfavourable contribution; i.e. the major part of the thrust is contributed by the TV, whereas the LEV and TEV generate more drag. The LEV is the main contributor to the lift force.
At the mid-upstroke ( $t/T=0.22$) or mid-downstroke (
 $t/T=0.72$), when the model experiences a thrust peak, the contribution of the subdomains also reaches its peak. To further understand the hydrodynamic importance of the LEVs and TEVs, we compare the spanwise vorticity (
 $\omega _y$) contours of several slice cuts through the left fin between three models at the mid-upstroke (
 $t/T=0.22$). Transparent
 $Q$-isosurfaces are also displayed associated with the vorticity contours to help identify the vortex structures, in which the LEV and TEV cores are represented by the
 $\omega _y$ contours overlapping with those identified by
 $Q$-isosurfaces. As shown in figure 13, stable LEVs exist on the lower surface of fins, growing gradually along the spanwise direction, which can also be observed in a previous study (Garmann et al. Reference Garmann, Visbal and Orkwis2013). It is obvious from the 2-D contours that the LEVs for a small
 $W$ are much stronger than those for a large
 $W$. On slice 1, the LEV core structure can be clearly observed (figure 13
 $a$) for the smallest deformation model, whereas only a slight SL is found for the largest deformation model (figure 13
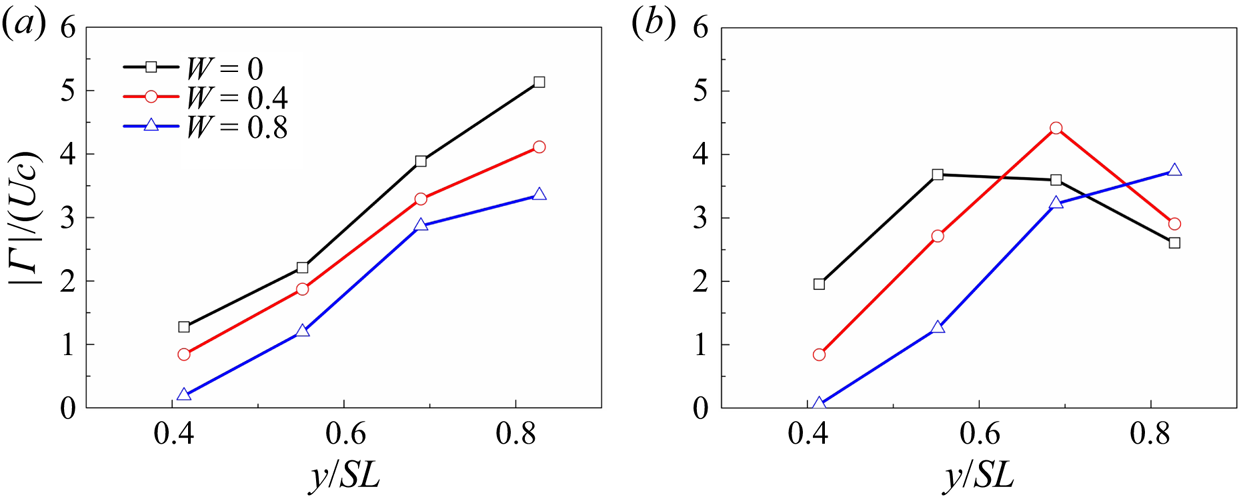
 $c$). By comparison, on slices 2, 3 and 4, the LEV cores are still larger in size and occupy a wider range of the fin surface. To further illustrate the effect of chordwise deformation on the LEV, the circulation of the spanwise vorticity is calculated based on the vorticity (
 $\omega _y$) contours. Figure 14
 $(a)$ compares the normalized strengths of the LEVs for the three models at the mid-upstroke. The circulation differences give another evidence indicating the reinforcement of the LEV with decreasing
 $W$. Note that at the fin root (slice 1), the strength of the LEV is near zero for the largest deformation model, coinciding with the LEV tubes identified by the
 $Q$-isosurface, where the LEV core can grow to a more extended region from the root to tip for the smallest deformation model. Thus, the contribution of
 $R1$ is highest on both thrust and lift for a smaller deformation due to the stronger LEV.
Comparison of the instantaneous spanwise vorticity contour ( $\omega _y$) among the models of (
 $a$)
 $W=0$, (
 $b$)
 $W=0.4$ and (
 $c$)
 $W=0.8$ at the mid-upstroke (
 $t/T=0.22$) on four slice cuts (slices 1–4), taken at
 $0.41SL$,
 $0.56SL$,
 $0.69SL$ and
 $0.83SL$ away from the centreline. Here,
 $\omega _y$ is normalized by
 $U/c$, where
 $c$ is the chord length at
 $0.62SL$.

Circulation  $\vert \varGamma \vert$ of the (
 $a$) LEVs and (
 $b$) TEVs on the four slice cuts at the mid-upstroke (
 $t/T=0.22$) for the models with different wavenumbers. Here,
 $\vert \varGamma \vert$ is normalized by
 $Uc$.

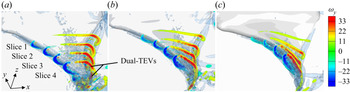
As a result of the LEV–SL–TEV shift, the TEV for the smallest chordwise deformation is similarly stronger (figure 13). On slice 1, a stable TEV can be observed in figure 13 $(a)$, whereas it does not even form a TEV core in figure 13
 $(c)$. As the SL is more developed at the outboard of the fins, a part of the TEV is detached from the trailing edge and forms dual TEVs for the smallest chordwise deformation (from figure 13
 $(a)$, slices 3 and 4). For the largest deformation, the TEV is attached tightly on the surface and is relatively stretched (figure 13
 $c$). Similar multi-core vortex structures occur on LEV structures (Lu, Gong & Guo Reference Lu, Gong and Guo2006; Han et al. Reference Han, Chang and Cho2015) due to the high effective attack angle and
 $Re$, but are not found on TEV structures. Furthermore, we compare the TEV circulation at the mid-upstroke (
 $t/T=0.22$) for the three models (figure 14
 $b$). It can be found that at the locations from
 $0.41SL$ to
 $0.56SL$, the TEV strength of the smallest chordwise deformation is the highest. As the slice cut moves outboard (at
 $0.69SL$), the moderate deformation model has the highest TEV strength, indicating that the dual TEVs occur for the least deformation, which weakens the TEV strength since the secondary TEV is detached from the trailing edge. At
 $0.83SL$, the moderate deformation also generates the dual TEV, and thus, the circulation of the largest deformation is the largest. Therefore, the unfavourable contribution of
 $R2$ to the thrust decreases slightly, as shown in figure 12
 $(b)$ compared with figures 12
 $(d)$ and 12
 $(f)$.
To illustrate the TV strength, we compare the streamwise vorticity ( $\omega _x$) contours of two slice cuts (
 $x/BL$ = 0.81, 0.92) behind the fins at the mid-upstroke (
 $t/T=0.22$), as shown in figure 15. For the
 $W=0$ model (figures 15
 $a$ and 15
 $d$), the vortex cores are apparently larger than those of the other models. The vorticity peak values at the vortex cores are approximately
 $-24.0$ and
 $-33.9$ for the model in figures 15
 $(a)$ and 15
 $(d)$, respectively, whereas they are
 $-16.0$ and
 $-11.6$ in figures 15
 $(c)$ and 15
 $(f)$, respectively. These values indicate that chordwise deformation can also decrease the strength of TVs. Therefore, subdomain
 $R3$ of the fins at smaller
 $W$ contributes more thrust, as shown in figure 12.
Comparison of the instantaneous streamwise vorticity contour ( $\omega _x$) among the models of (
 $a$,
 $d$)
 $W=0$, (
 $b$,
 $e$)
 $W=0.4$ and (
 $c$,
 $f$)
 $W=0.8$ at the mid-upstroke (
 $t/T=0.22$) on two slice cuts, taken at (
 $a$,
 $b$,
 $e$)
 $x/BL=0.81$ and (
 $d$,
 $e$,
 $f$)
 $x/BL=0.92$. Here,
 $\omega _x$ is normalized by
 $U/c$, where
 $c$ is the chord length at
 $0.62SL$.

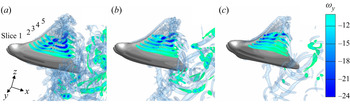
Figure 12 (early downstroke) also shows that as the LEV–SL shift progresses during stroke reversal, subdomain  $R1$ contributes little thrust. Figure 16 shows the spanwise vorticity contours at
 $0.41SL$,
 $0.48SL$,
 $0.55SL$,
 $0.62SL$ and
 $0.69SL$ spanwise slice cuts during the early downstroke (
 $t/T=0.52$). The cores of the broken LEV are still attached at the lower surface and interact with the SLs. As stated above, the LEV contributes unfavourably to the thrust. For the smallest chordwise deformation in figure 16, the size of the broken LEV cores is much larger, consistent with the stronger LEVs during the LEV–SL shift process, as shown in figure 9. The stronger broken LEVs in subdomain
 $R1$ contribute more drag; thus, the peak thrust value of the
 $W=0.8$ model is slightly higher (figure 12
 $f$) at
 $t/T=0.52$.
Comparison of the instantaneous spanwise vorticity contour ( $\omega _y$) among the models of (
 $a$)
 $W=0$, (
 $b$)
 $W=0.4$ and (
 $c$)
 $W=0.8$ at the early downstroke (
 $t/T=0.52$) on five slice cuts (slices 1–5), taken at
 $0.41SL$,
 $0.48SL$,
 $0.55SL$,
 $0.62SL$ and
 $0.69SL$ away from the centreline. Here,
 $\omega _y$ is normalized by
 $U/c$, where
 $c$ is the chord length at
 $0.62SL$.

In our simulations, although the model with the smallest chordwise deformation has the strongest TVs, i.e. that generates the largest thrust in subdomain  $R3$, it also has the strongest LEVs, which induce a significant drag. This explains why the model with
 $W=0$ has the largest total force but the least thrust. In addition, figures 12
 $(a)$, 12
 $(c)$, and 12
 $(e)$ show that the LEV accounts for a large portion of the contribution to lift; thus, the strongest LEV for the smallest chordwise deformation is consistent with the highest lift force. The moderate deformation (
 $W$ = 0.4) has an optimal balance between the favourable contribution of TV and unfavourable contributions of LEV and TEV, thus generating the highest thrust, as shown in figure 17.
The cycle-averaged contributions of LEV, TEV and TV to the thrust production. These values are obtained by averaging the contributions of  $R1$,
 $R2$ and
 $R3$, respectively, from figure 12.

To see more clearly, the thrust is computed as the negative  $x$-component of (4.11), i.e.
 \begin{equation} F_T =\rho \int_{V}\frac{1}{2} \frac{\textrm{d}}{\textrm{d}t}(y\omega_z-z\omega_y)\,\textrm{d}V+ \rho \int_{V}(u_z\omega_y-u_y\omega_z)\,\textrm{d}V- (\boldsymbol{F_B}'+\boldsymbol{F_\varSigma}')_x. \end{equation}
From the first two terms at the right-hand side of the above equation, we can see that the thrust force is related to the distribution of  $\omega _y$ and
 $\omega _z$, while
 $\omega _x$ does not directly contribute to the thrust force. Figure 18 shows the structures of
 $\omega _y$ and
 $\omega _z$ along with the isosurface of
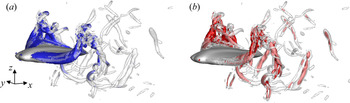
 $Q$. We can see that the TV subdomain is mainly composed of the
 $\omega _z$ structure and the
 $\omega _y$ structure is the main part of the spanwise vortex domain, i.e. the LEV and TEV, at the present condition. Thus the TV and spanwise vortices contribute to the thrust mainly via the information of the
 $\omega _z$ and
 $\omega _y$ structures, respectively.
Comparison of the vortical structures visualized by the isosurface of ( $a$)
 $\lvert \omega _y \rvert =30$ and (
 $b$)
 $\lvert \omega _z \rvert =30$ on the model of
 $W=0.4$,
 $f=1.0\,\textrm {Hz}$. For orientation purposes, the structures visualized by
 $Q=150$ as presented in figure 8 are added in a semi-transparent form; thus the
 $\omega _y$ and
 $\omega _z$ structures can be considered as the main part of LEV + TEV and TV, respectively.

4.5. Pressure distribution
The pressure distribution of the cownose ray model is presented to further understand the chordwise deformation effects on the hydrodynamic performance. The pressure coefficient is defined as  $C_p=(p-p_{in})/0.5 \rho U^{2}$, where
 $p_{in}$ is the free-stream pressure. Figure 19 shows the pressure contours on the model surfaces at the mid-upstroke (
 $t/T=0.22$) around which the peaks of thrust and negative lift are observed. On the lower surface, a significant low-pressure region is found, which coincides with the locations of LEVs in figure 8. Due to the higher LEV strength, the model with smaller chordwise deformation has a larger low-pressure region. On the other hand, on the upper surface of the fins, there is a high-pressure region. However, the formation of TEVs leads to a low-pressure region at the back of the upper surface. As the dual TEVs develop more fully and the secondary TEV detaches from the surface, the low-pressure region is relatively smaller in figure 19
 $(a)$ than that in figures 19
 $(b)$ and 20
 $(c)$. The pressure difference between the lower and upper surfaces leads to the hydrodynamic force of the cownose ray. Thus, the higher instantaneous total force generated by the smallest chordwise deformation is attributed to the stronger LEVs and detached TEVs, which enlarge the low-pressure region at the lower surface and reduce the low-pressure region at the upper surface, respectively. Although the smallest chordwise deformation can produce the highest total force, its thrust is the lowest. The reason is that the fin surface is parallel to the swimming direction, which makes the component of the total force in the swimming direction relatively small. At the same time, the total force has a large component in the vertical direction. Moderate chordwise deformation can generate a moderate total force and produce an optimal attack angle, making the force component in the swimming direction the highest.
Distribution of the pressure coefficient  $C_p$ on (
 $a$–
 $c$) the upper surface and (
 $d$–
 $f$) the lower surface of the model for (
 $a$,
 $d$)
 $W=0$, (
 $b$,
 $e$)
 $W=0.4$ and (
 $c$,
 $f$)
 $W=0.8$ at the mid-upstroke (
 $t/T=0.22$).

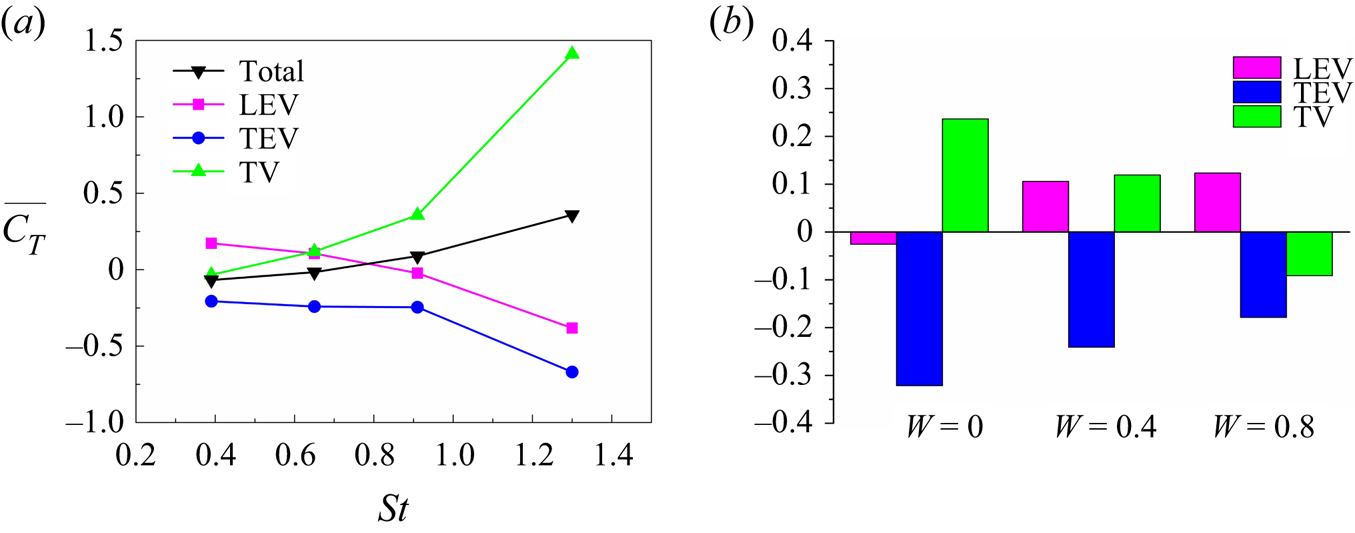
Comparison of the cycle-averaged contributions of LEV, TEV and TV to the thrust generation for ( $a$) the models with
 $W=0.4$ and different
 $St$ and (
 $b$) the models with
 $St=0.65$ and different wavenumbers. The division of subdomains is the same as that in figure 11.

4.6. Effect of the Strouhal number
The Strouhal number ( $St$) is known to be the most important parameter that influences the hydrodynamic performance of aquatic swimmers. To examine the effect of
 $St$ on the oscillatory swimming of batoid fish, further simulations were performed at lower frequencies
 $f = 0.7, 0.5, 0.3\,\textrm {Hz}$, which correspond to
 $St=0.91, 0.65, 0.39$, respectively, as compared with
 $St=1.30$ at
 $f=1\,\textrm {Hz}$. It can be observed in figure 20
 $(a)$ that, with the decrease of
 $St$, the contributions of local vortical structures decrease; i.e. both the favourable contribution from TV and the unfavourable contribution from LEV and TEV decrease. Note that the thrust from TV decreases to a negative value at
 $St=0.39$ and the LEV begins to generate positive thrust at
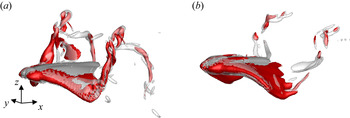
 $St=0.65$, as the Strouhal number decreases. Figure 21 shows that at
 $St=0.65$, the LEV region contains more
 $\omega _z$ structures, while at
 $St=0.39$, there form very few
 $\omega _z$ structures in the TV region. Actually, the TV strength is weak at such low
 $St$ and this observation is consistent with Dong, Mittal & Najjar (Reference Dong, Mittal and Najjar2006). Thus, the difference in the
 $\omega _z$ structures with those at high
 $St$ accounts for the favourable contribution of LEV (
 $St=0.65, 0.39$) and the unfavourable contribution of TV (
 $St=0.39$).
The vortical structures visualized by the isosurface of ( $a$)
 $\lvert \omega _z \rvert =10$ (red),
 $Q=20$ (grey semi-transparent) for the model of
 $St=0.65$ and (
 $b$)
 $\lvert \omega _z \rvert =5$ (red),
 $Q=5$ (grey semi-transparent) for the model of
 $St=0.39$.

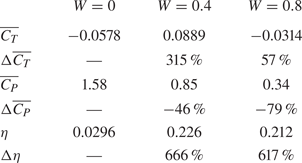
Furthermore, the cycle-averaged coefficients and their enhancement for different chordwise deformations at  $St=0.91$ are shown in table 2. The hydrodynamic enhancements are similar to those at higher
 $St$. Note that the thrust is enhanced by 315 % at
 $W=0.4$, whereas it is only 56 % at
 $W=0.8$. This may be due to the added-mass mechanism at
 $W=0.8$. It is known that the main parameter in the added-mass mechanism is the so-called slip velocity defined as
 $U/V$ (Lighthill Reference Lighthill1960), where
 $V$ is the wave speed (
 $V=\omega /2{\rm \pi} W$ in this work). A higher slip velocity indicates a higher added-mass force. The slip velocity at
 $W=0.8$ and
 $W=0.4$ are 1.14 and 0.57, respectively, at
 $f=0.7\,\textrm {Hz}$. This indicates that the chordwise deformation can influence the slip velocity, and thus weaken the lift-based force, especially at low
 $St$. The contributions of local vortical structures to the thrust at
 $St= 0.65$ are shown in figure 20
 $(b)$. As expected, the contribution of different vortical structures decreases as the wavenumber increases.
Cycle-averaged force coefficients and their enhancements due to chordwise deformation at  $St=0.91$.

5. Effect of the half-amplitude asymmetry
In this section, we examine the effect of the half-amplitude above the longitudinal axis to that below the longitudinal axis ratio ( $HAR$) on the hydrodynamic performance of the cownose ray model. Three
 $HAR$ values, as shown in table 3, are employed in our simulations. Additionally, symmetrical motions in which the tip-to-tip amplitude
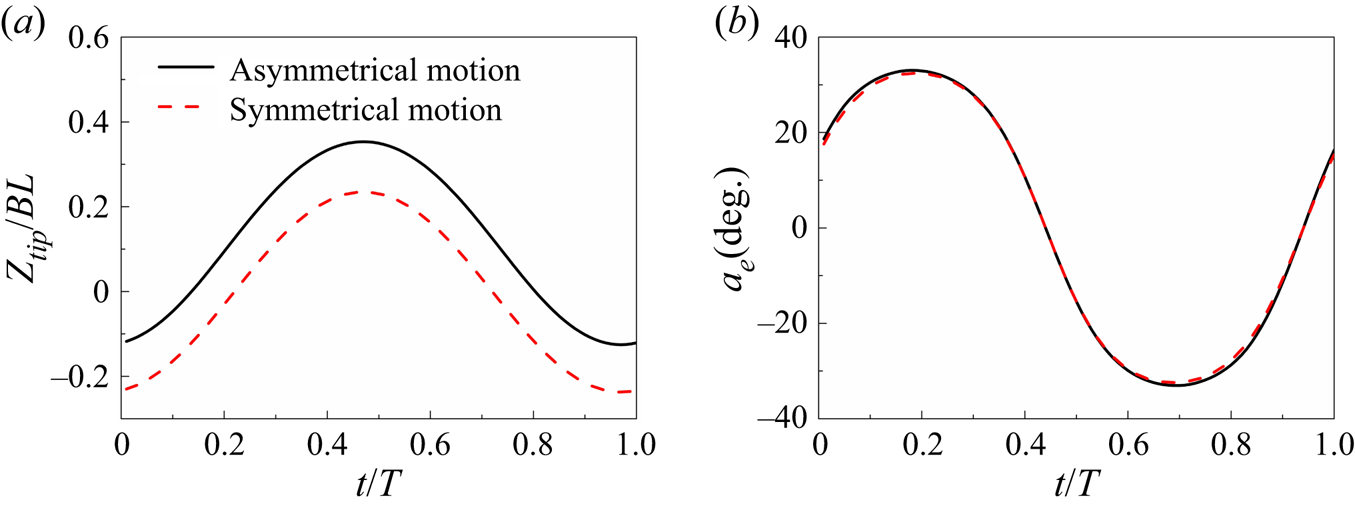
 $A$ is equal to asymmetrical motions are presented for comparison. Figure 22 gives the fin tip trajectory and the effective attack angle of the
 $y/SL=0.62$ chord line for
 $HAR=3$ and the corresponding comparison model, where the chord line is defined as the straight line connecting the leading edge and the trailing edge at the slice cut. Although the tip-to-tip amplitude remains the same for the two types of motion, the maximum half-amplitude is larger for the
 $HAR=3$ model, as is the effective angle of attack.
Comparison of the ( $a$) tip trajectory and (
 $b$) effective attack angle of the
 $y/SL=0.62$ chord line for the model of
 $W=0.4$ between the asymmetrical (
 $HAR=3$,
 $A=0.47BL$) and symmetrical motions (
 $HAR=1$,
 $A=0.47BL$). The chord line is defined as the straight line connecting the leading edge and the trailing edge at the corresponding slice cut.

Cycle-averaged force coefficients and the relative difference due to half-amplitude asymmetry.

Table 3 shows the difference in cycle-averaged force coefficients between asymmetrical motion and the corresponding symmetrical motion with the same amplitude. Similarly, the thrust difference is defined as
 \begin{equation} \Delta \overline{C_T} =\frac{\overline{C_T}\mid_{asymm} - \overline{C_T} \mid_{symm}}{\overline{C_T} \mid_{symm}+C_D}, \end{equation}
where  $\overline {C_T} \mid _{asymm}$ is the cycle-averaged thrust coefficient of the motion with varied
 $HAR$ values,
 $\overline {C_T} \mid _{symm}$ is the coefficient of the corresponding symmetrical case and
 $C_D$ is the towed resistance coefficient (see § 4.2). In general, cycle-averaged thrust enhancement is found in all three cases, and the gain in thrust for
 $HAR=3$ is much larger than that for
 $HAR=1.67$ and
 $1.22$. The thrust is increased by approximately 14.3 %, which can explain why most real cownose rays swim at around this
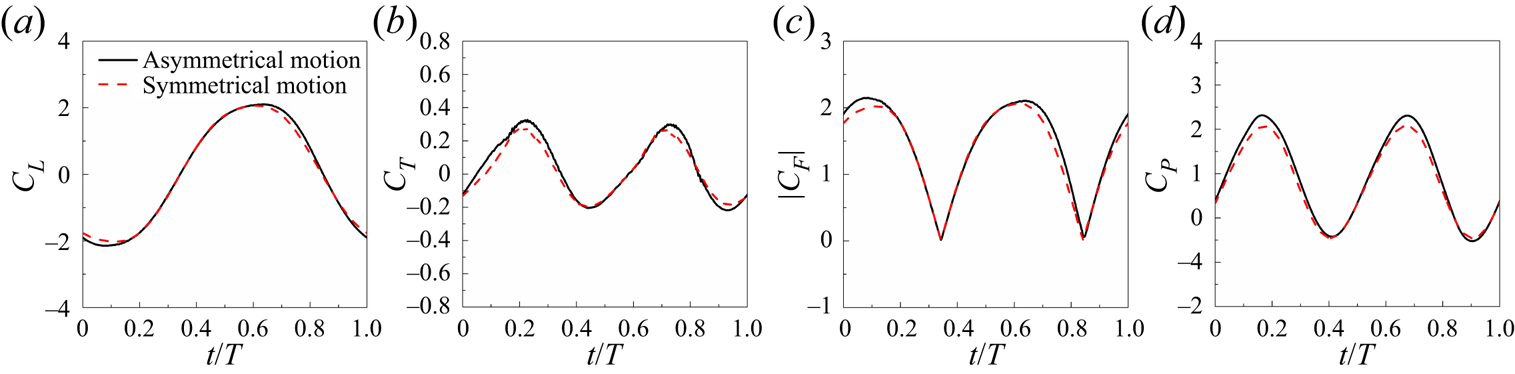
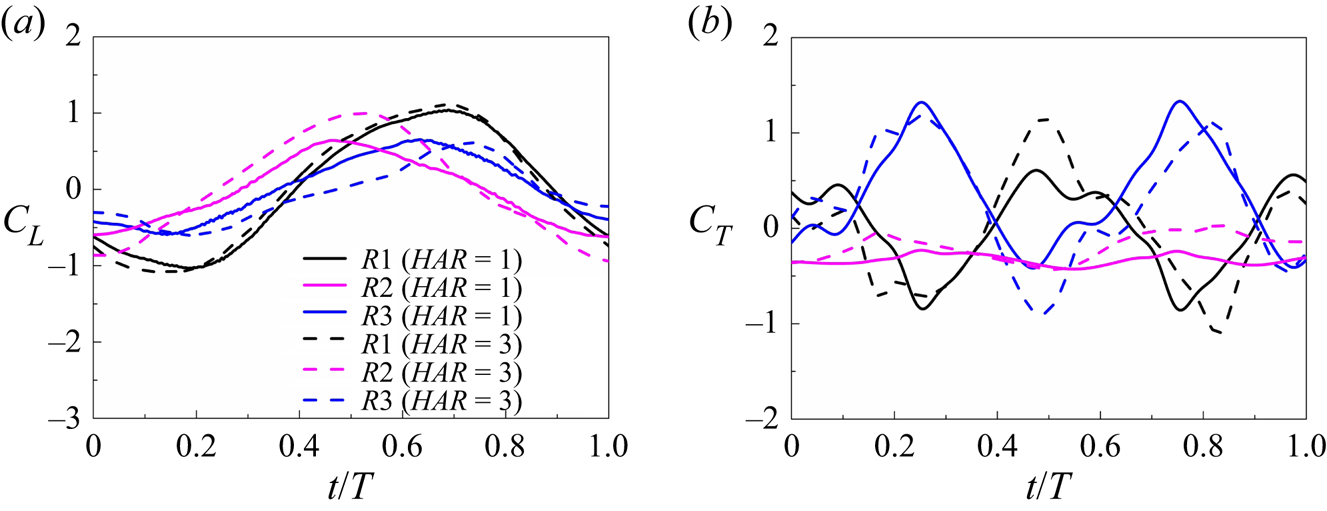
 $HAR$ in our observation. The instantaneous lift, thrust and total force coefficients at
 $HAR=3$ are shown in figure 23, whose peaks are also found to be increased. However, due to the higher maximum half-amplitude, the power consumption is higher for asymmetrical motion (figure 23
 $d$). The enhancement of thrust and increase of power result in the almost unchanged efficiency. These observations indicate that the asymmetrical motion may be an method to control velocity, and to increase manoeuvrability without changing significantly the efficiency.
Comparison of ( $a$) lift, (
 $b$) thrust, (
 $c$) total force and (
 $d$) power coefficient between the asymmetrical (
 $HAR=3$,
 $A=0.47BL$) and symmetrical motions (
 $HAR=1$,
 $A=0.47BL$).

To clarify the thrust performance enhancement due to asymmetrical motion, the wake topology of the  $HAR=3$ model associated with the
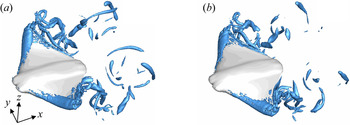
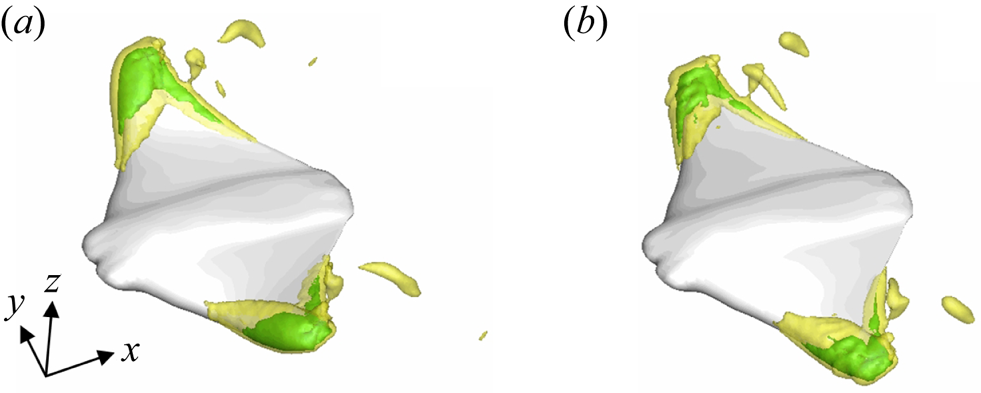
 $HAR=1$ model is presented here. Figure 24 presents the 3-D vortex structures identified by the isosurface
 $Q$-criterion (
 $Q=100$) for
 $HAR=3$ and 1, both at
 $A=0.47BL$ during the mid-downstroke (
 $t/T=0.72$). The size of the 3-D LEV tube for the model at
 $HAR=3$ is slightly larger than that at
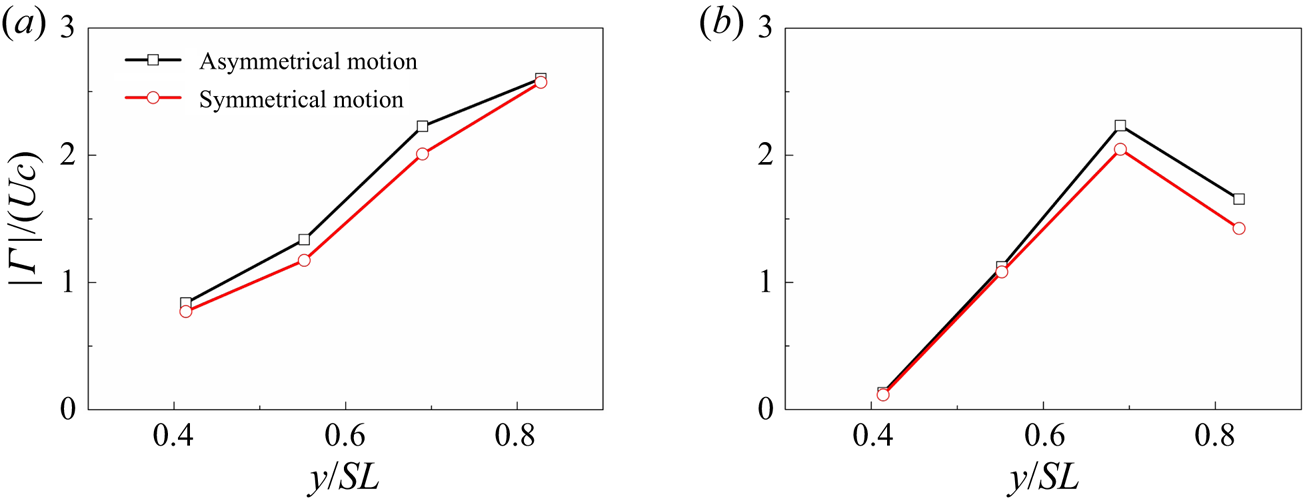
 $HAR=1$. To further illustrate the LEV enhancement, the circulations of LEV are calculated, as shown in figure 25
 $(a)$. The LEV circulation is enhanced by nearly 8.73 %, 13.8 %, 10.8 % and 1.11 % at
 $y/SL = 0.41$, 0.56, 0.69 and 0.83, respectively. The LEV enhancement is due to the effective angle increase for the asymmetrical motion. Similar enhancement can also be observed for the TEV, as shown in figure 25
 $(b)$. The enhancement in the LEV further causes the pressure distribution change on the upper surface of the fins, as shown in figure 26, where the isosurfaces of pressure coefficients
 $C_p=-3$ and
 $-$6 are plotted. The low-pressure region attributed to the attached LEV is extended slightly for the
 $HAR=3$ model, resulting in an increase in the lift and total forces. Figure 27 shows the contribution of different vortical structures, in which the same subdomains are used. The vortical contribution on the lift is enhanced by the asymmetrical motion, especially for the LEV and TEV. For the thrust, although the unfavourable contribution of the
 $R1$ subdomain is also enhanced, consistent with the stronger LEV, the contribution of LEV at
 $HAR=3$ lags behind that at
 $HAR=1$. Moreover, the unfavourable effect of the TEV weakens, leading to mean thrust enhancement.
Comparison of the 3-D wake structures of a cownose ray, visualized by  $Q=100$ between the models with (
 $a$) asymmetrical (
 $HAR=3$,
 $A=0.47BL$) and (
 $b$) symmetrical motions (
 $HAR=1$,
 $A=0.47BL$) at the mid-downstroke (
 $t/T=0.72$).

Circulation  $\vert \varGamma \vert$ of the (
 $a$) LEVs and (
 $b$) TEVs on the four slice cuts at the mid-downstroke (
 $t/T=0.72$) for the models with asymmetrical (
 $HAR=3$,
 $A=0.47BL$) and symmetrical motions (
 $HAR=1$,
 $A=0.47BL$). Here,
 $\vert \varGamma \vert$ is normalized by
 $Uc$.

Comparison of pressure isosurfaces between the models with ( $a$) asymmetrical (
 $HAR=3$,
 $A=0.47BL$) and (
 $b$) symmetrical (
 $HAR=1$,
 $A=0.47BL$) motion at the mid-downstroke (
 $t/T=0.72$). The outer shell is visualized by
 $C_p=-3$, and the inner core is visualized by
 $C_p=-6$.

Contribution of subdomains  $R1$,
 $R2$ and
 $R3$ to the (
 $a$) lift and (
 $b$) thrust with asymmetrical (
 $HAR=3$,
 $A=0.47BL$) and symmetrical motion (
 $HAR=1$,
 $A=0.47BL$).

Although the differences of unsteady forces and the characteristics of vortical structures between different  $HAR$ values are not as apparent as those of the wavenumber effect, the variation trend suggests that the hydrodynamic enhancement is improved as
 $HAR$ increases. It is seen that for larger
 $HAR$ values, higher swimming speed or larger animals using mobuliform locomotion, such as the manta ray, the enhancement will become more apparent because the difference of the effective angle of attack due to the asymmetric motion is more significant.
6. Discussions
This work checked the chordwise deformation by changing the travelling wavenumber. Real batoid species differ significantly from each other in the deformation patterns. Rhinoptera bonasus, Gymnura micrura, Dasyatis violacea and Raja eglanteria have a mean wavenumber of 0.4, 0.63, 0.74, 0.89, respectively (Rosenberger Reference Rosenberger2001), indicating that the parameters in this work are a reasonable representation of real batoid swimming. In our study, it is observed that the chordwise deformation transforms the section motion from purely heave to combined heave and pitch. For the rigid foils, great enhancement in thrust and efficiency can be seen by adding pitch to heave motions (Floryan et al. Reference Floryan, Van Buren, Rowley and Smits2017; Van Buren, Floryan & Smits Reference Van Buren, Floryan and Smits2019). The hydrodynamics enhancement of batoid fish agrees well with that of a rigid foil.
Flying insects usually have a large wing-to-body thickness ratio, which makes wing–body interactions (Liu et al. Reference Liu, Dong and Li2016; Wang et al. Reference Wang, Ren, Li and Dong2019) an important mechanism in their flying aerodynamics. Compared with those of flying insects, the fins and body of the cownose ray are fused fluently; thus, we do not observe obvious interactions between the fins and body. One of the key features in our simulations is the LEV–SL–TEV shift. Although the LEV-to-TEV shift was also found in mosquito flight (Bomphrey et al. Reference Bomphrey, Nakata, Phillips and Walker2017) due to the rapid changes in the pitch angle, the shape and dynamics of the vortex structures of cownose ray are very different from those of the mosquito. Specifically, the LEV and TEV form at the same time on the upper and lower surfaces, respectively. The LEV forms on the lower surface during the upstroke and the upper surface during the downstroke, whereas the TEV forms on the opposite surface; thus, the LEV–SL–TEV shift process is repeated on both sides of the fins.
Anderson et al. (Reference Anderson, Streitlien, Barrett and Triantafyllou1998) showed that, in the 2-D wing, the LEV is shed into the wake. In contrast, the 3-D model in our simulations does not shed LEVs, which is related to the spanwise flow from the fin base to tip. Similar to the delta wings (Ellington et al. Reference Ellington, Van Den Berg, Willmott and Thomas1996), such flow causes the LEV to spiral toward the fin tip and forms a TV, thus preventing the LEV from accumulating into large ones, and then becoming unstable. Borazjani & Daghooghi (Reference Borazjani and Daghooghi2013) demonstrated that the formation of a stable LEV is due to the kinematics other than the shape of the model, by comparing the sweptback tail with a rectangular tail. Therefore, the kinematics of the mobuliform can create a stable LEV and the model with larger wavenumber forms a weakened LEV, i.e. a more stable LEV. In the present work, we simulated a lower  $Re$ (2220) than with the real cownose ray, but the attachment mechanism of the LEV still applies. It was reported that such spanwise flow was not observed at a low
 $Re$ of 160 (Birch & Dickinson Reference Birch and Dickinson2001), but at a relatively high
 $Re$ of 1400 (Birch, Dickson & Dickinson Reference Birch, Dickson and Dickinson2004). Lentink & Dickinson (Reference Lentink and Dickinson2009) also suggested the mechanism for LEV stability is independent on
 $Re$, at least over the range of 100 to 14 000. In the study of Zhong, Dong & Quinn (Reference Zhong, Dong and Quinn2019), the simulation of a bluefin tuna was also conducted at a similar
 $Re$ (2100). The major parts of vortices persist, and the LEV detachment agrees well with their particle image velocimetry (PIV) results at
 $Re$ of 41 000 to 98 400. The difference lies in the break of vortex cores in their experiments.
Another parameter deserving further discussion is the Strouhal number. Many swimming and flying animals are observed to cruise in a narrow range of Strouhal numbers,  $St=0.2\sim 0.4$ (Triantafyllou, Triantafyllou & Gopalkrishnan Reference Triantafyllou, Triantafyllou and Gopalkrishnan1991). However, the high-
 $St$ condition in the present study is still meaningful for the situation of fast start, which needs a high frequency to gain a large thrust (Borazjani et al. Reference Borazjani, Sotiropoulos, Tytell and Lauder2012), for low-speed behaviours (Lauder & Tytell Reference Lauder and Tytell2005; Saadat et al. Reference Saadat, Fish, Domel, Di Santo, Lauder and Haj-Hariri2017) and for some species of aquatic animals which may swim beyond the optimal
 $St$ range (Eloy Reference Eloy2012). For some man-made bio-inspired systems (Yang, Qiu & Han Reference Yang, Qiu and Han2009; Wen et al. Reference Wen, Wang, Wu and Liang2012; Scaradozzi et al. Reference Scaradozzi, Palmieri, Costa and Pinelli2017), there exists a gap of speed between live swimmers and robots, which also results in high
 $St$. The highest
 $St$ in the present work is 1.30 at
 $f=1\,\textrm {Hz}$. This high
 $St$ value is chosen because that the
 $Re$ in our simulations is lower than that of real animals, at which the viscous drag is significantly higher, for both the body and propulsor parts. In fact, efficient cruising for swimming and flying animals is dictated by propulsor drag (Floryan, Van Buren & Smits Reference Floryan, Van Buren and Smits2018). The efficiency can be scaled as
 \begin{equation} \eta \sim \frac{A^{{\ast}}(St^{2}-b_1 \theta_0)}{St^{3}(1-H^{{\ast}} \varTheta^{{\ast}})}, \end{equation}
where  $A^{\ast }$ is the dimensionless amplitude,
 $b_1$ denotes the relative importance of the drag term compared with the thrust term and the rest of the parameters denote the motion pattern. The efficiency can achieve a peak value at
 $St=\sqrt {3b_1 \theta _0}$, where
 $b_1$ is a large value at small
 $Re$, and decreases with increasing
 $Re$. Gazzola, Argentina & Mahadevan (Reference Gazzola, Argentina and Mahadevan2014) demonstrated that
 $St$ depends weakly on
 $Re$ and
 $St \sim Re^{-1/4}$ at low
 $Re$, according to biological data. Similarly, Senturk & Smits (Reference Senturk and Smits2019) found that, for a pitching foil, as the Reynolds number increases, the thrust and efficiency increase, whereas the offset drag decreases. Nevertheless, the variation in power consumption is relatively small, and at
 $Re$ exceeding approximately 16 000, its effect on the thrust seems to diminish. This means the hydrodynamic forces are dependent on
 $Re$. However,
 $Re$ does not change the trend of the forces; thus, the force variation trend with different wavenumbers and
 $HAR$ still works here. We should further consider the performance enhancement mechanism here. According to (6.1), high efficiency can also be achieved by increasing the amplitude. However, on increasing
 $A^{\ast }$ constantly, the angle of attack increases, and then dynamic stall occurs, which causes the performance to be weakened. Here, we can see that the chordwise deformation can decrease the effect angle of attack, thus increasing the maximum amplitude by avoiding the dynamic stall.
Furthermore, the contributions of different vortical structures are quantitatively investigated. In our investigations, the role of the LEV on the lift is consistent with the LEV effect on hovering insects (Bomphrey et al. Reference Bomphrey, Nakata, Phillips and Walker2017; Liu, Du & Sun Reference Liu, Du and Sun2020a) or the slow flight of birds/bats (Muijres et al. Reference Muijres, Johansson, Barfield, Wolf, Spedding and Hedenström2008; Kruyt et al. Reference Kruyt, van Heijst, Altshuler and Lentink2015). As mentioned in the Introduction, the role of the LEV in the thrust of aquatic animals has seldom been investigated, especially for oscillatory swimming, probably due to overemphasis on the wake structures (Liao et al. Reference Liao, Beal, Lauder and Triantafyllou2003; Uddin, Huang & Sung Reference Uddin, Huang and Sung2015; Liu, Pan & Liu Reference Liu, Pan and Liu2020b). In the study of Bottom et al. (Reference Bottom, Borazjani, Blevins and Lauder2016), the performance enhancement mechanism varied with the swimming speed, i.e.  $St$, for the batoid fish undulatory swimming. At a high
 $St$, the added-mass force is significantly higher than the lift-based force, whereas at a low
 $St$, although the added-mass mechanism still dominates, the contribution of LEV improves greatly. In the present work, at low
 $St$ the role of LEV is consistent with the undulatory swimmer (Bottom et al. Reference Bottom, Borazjani, Blevins and Lauder2016). At high
 $St$, the quantitative contribution of local vortical structures here presents an unfavourable role of the LEV for the oscillatory mode, which employs the lift-based mechanism.
Here, we can also see that the TV plays a vital role in the cownose ray swimming. Although the region of fins covered by the TV is small, the contribution of TV structures dominates the thrust production. Note that the present DMT approach reflects the whole impact of the vortical structures and local processes at one integration domain on the whole model. So the contribution of  $R3$ is not limited to the tip area of the batoid model. The expression (4.11) contains the distribution and time derivative of the vortical structures, which reflects a temporal-spatial related process; thus, the structures in one domain will interact with those in other domains through domain boundaries. The DMT approach has been successfully applied in analysing the local dynamic processes of bluff-body flows (Wu et al. Reference Wu, Lu and Zhuang2007) and flapping plate flows (Li & Lu Reference Li and Lu2012; Zhang & Huang Reference Zhang and Huang2019; Tong, Yang & Wang Reference Tong, Yang and Wang2021). However, less attention has been paid to the investigation of aquatic animals, whose vortical structures are more complex. Based on expression (4.14), the vorticity information is directly linked to the thrust generation, which reveals how each moving vortex influences the force. The
 $\omega _z$ structures are found to be the main part of the TV at high-
 $St$ condition. It is a qualitative explanation of that the TV contributes a major part of the thrust. At lower
 $St$, more
 $\omega _z$ structures transform from the
 $R3$ subdomain to the
 $R1$ and
 $R2$ subdomains; thus the contribution of the TV decreases significantly. Moreover, some previous investigations also found the importance of the vortex from the tip region. Ringuette, Milano & Gharib (Reference Ringuette, Milano and Gharib2007) and Kriegseis & Rival (Reference Kriegseis and Rival2014) showed that the TV contributes substantially to the overall force on the plate. As observed in other investigations on swimming, such as those of manta rays (Fish et al. Reference Fish, Schreiber, Moored, Liu, Dong and Bart-Smith2016) and bluegill sunfish pectoral fins (Dong et al. Reference Dong, Bozkurttas, Mittal, Madden and Lauder2010), the distal part of the fins plays the most important role in thrust generation.
In our work, we used the tethered model in a fixed free-stream inflow, other than the free-swimming or self-propelled model. The difference between the two models should be noted. Actually, real animals are free to swim in water, and the speed is produced as a result of the thrust and drag, but not a fixed one, which is given by
 \begin{equation} m\frac{\textrm{d}u}{\textrm{d}t}=T-D. \end{equation}
The speed usually has an oscillation around its mean value (Bottom et al. Reference Bottom, Borazjani, Blevins and Lauder2016; Zhang et al. Reference Zhang, Pan, Chao and Zhang2018), and the mean value may be unequal to the inflow of the tethered condition. Hoover et al. (Reference Hoover, Cortez, Tytell and Fauci2018) investigated the hydrodynamics of tethered and free-swimming panels using numerical simulations. They found that increasing swimming speeds in untethered panels corresponds to increasing thrusts in the tethered panels. Furthermore, modal decompositions were performed to investigate the effect of flexibility. The peaks in the modal contributions of tethered model also agree with the peaks observed for the freely swimming panels. Van Buren et al. (Reference Van Buren, Floryan, Wei and Smits2018) compared thrust for oscillating foils with varied oncoming flow speed in a water channel and found that the thrust and power are independent of the mean free-stream velocity and oscillations in the velocity. They demonstrated that the mean thrust for an unsteady foil should be scaled as  $\bar {T} \sim \rho s c (fa_0)^{2}$, rather than the flow velocity, where
 $s$,
 $c$,
 $f$,
 $a_0$ represent the span length, chord length, frequency and trailing-edge amplitude, respectively. Their results potentially indicate that the performance characteristics of a foil in a fixed free-stream inflow accurately represents the behaviour of a free-swimming model if
 $f$ and
 $a_0$ remain constant. However, the above studies consider an isolated foil or panel. For an oscillatory swimmer, the thrust is provided mostly by the motion of fins, and the body is the principal source of drag (Fish et al. Reference Fish, Schreiber, Moored, Liu, Dong and Bart-Smith2016; Liu et al. Reference Liu, Ren, Dong, Akanyeti, Liao and Lauder2017; Smits Reference Smits2019), similar to the relationship between a ship and propeller. For such a body–fin system, although the behaviour of the fins can be treated the same for tethered and free-swimming models, the body drag varies with the speed,
 $\bar {D} \sim \rho s c \bar {U}^{2}$. For this reason, in our simulations, the total force characteristics are different from the free-swimming condition. The wake patterns may be another difference because the mean free-stream velocity changes the convection speed of vortices. Therefore, in the wake, we may see that the distance between vortices is different for the two models. However, given the effect of
 $St$ we observed, similar performance enhancement mechanisms still work here.
7. Conclusions
In this work, vortex formation and the associated hydrodynamic effects of the chordwise deformation and half-amplitude asymmetry relative to the body longitudinal axis in cownose ray forward swimming have been investigated numerically. The unsteady flow simulations were carried out using the IB–SGKS method. The focus of this paper was to examine the 3-D vortex dynamics, as well as the thrust production, power consumption and swimming efficiency in different models. The main vortex structures including the LEV, shed TEV and TV connected and formed a vortex loop. During the vortex formation process, the LEV–SL–TEV shift was observed to be the key mechanism employed by the swimming cownose ray. The DMT method was employed to investigate the effect of local vortical structures. By dividing the computational domain into three subdomains to capture different vortical structures, we found that at high  $St$ the TV was the main contributor to the thrust, whereas the LEV and TEV had an unfavourable effect. Nevertheless, at low
 $St$, the LEV would have a favourable effect on the thrust.
Investigations of the chordwise deformation effects showed that fins with a larger wavenumber generate a higher thrust but a lower lift, thus resulting in lower power consumption. The hydrodynamic enhancement is mainly due to the effective angle of attack  $\alpha _e$. Chordwise deformation can transform the section motion from purely heave to combined heaving and pitching motion. It can also decrease
 $\alpha _e$. The smaller wavenumber model induces stronger LEVs on the lower and upper surfaces during the upstroke and downstroke, respectively. As the fin reverses its stroke, the stronger LEV results in a stronger SL and then a more developed dual TEV. The stable LEV generates an extended low-pressure region at one side of the model, whereas the detached secondary core of the dual TEVs can reduce the low-pressure region on the other side. Consequently, the difference between the two sides of the model increases, thereby enhancing the total force. The components of the total force parallel and perpendicular to the swimming direction are attributed to the thrust and lift forces, respectively. An optimal deformation can generate a optimal pitch angle, resulting in a higher thrust component. From the perspective of vortex contribution, the model with the smallest deformation has the strongest vortical structures. The vortical contributions from these structures are also the highest. However, net thrust is the balance of both the favourable and unfavourable from different local structures. The highest unfavourable contribution leads to a bad thrust performance for the small
 $W$ model. As the chordwise deformation decreases the vortex strength, the contribution of different vortical structures decreases. The moderate deformation (
 $W=0.4$) has an optimal balance between the favourable and unfavourable contributions of different vortical structures. Investigations of the effects of the half-amplitude ratio showed that the asymmetrical motion can enhance the thrust and also the power consumption by increasing the effective angle of attack; however, efficiency does not display a significant change. This kind of motion may be used by cownose rays to control the swimming speed. The strength of the LEV was found to be slightly increased for asymmetrical motion. In contrast, the unfavourable contribution of the TEV weakens.
The results of this work improve our understanding of complex kinematics in batoid fish-like oscillatory swimming. Although we study one specific species, we expect our results to apply more broadly to mobuliform swimming. Our results demonstrate the benefits of optimal chordwise deformation and amplitude asymmetry for the design of high-performance bioinspired underwater vehicles. The LEV and TV mechanisms in such man-made underwater systems can be treated as inspiration to enhance thrust. For example, we should try to strengthen the TV by guiding more LEV spirals to the tip region at low-speed conditions. We can also increase the amplitude without worrying about dynamic stall by suitable chordwise deformation. Moreover, the DMT theory provides a quantitative explanation of the vortical contribution, which can be further used for vortex dynamics analysis. One limitation of the present analysis is that we treat one specific vortex within a spatial region as a whole part rather than rigorously tracking its spatial variation. We also plan to carry out further simulations to check the performance and vortex dynamics at the Reynolds number of real batoid fishes. Such considerations are left for our future study.
Funding
This work was supported by the National Natural Science Foundation of China (Grant Nos. 12102227, 51879220 and 11772172), National Key Research and Development Program of China (Grant No. 2020YFB1313201), and Fundamental Research Funds for the Central Universities (Grant Nos. 3102019 HHZY030019 and 3102020 HHZY030018).
Declaration of interests
The authors report no conflicts of interest.