Introduction
X-ray powder diffraction is a widely applied analytical technique in the study of mineral mixtures, both for the qualitative identification of crystalline components and the quantitative determination of their concentrations. Quantitative mineralogy from XRPD data has a long history, dating back to the early 20th Century (Navias Reference Navias1925; Clark and Reynolds Reference Clark and Reynolds1936). Since these early examples, advances in instrumentation, databases (ICDD 2016; Gates-Rector and Blanton Reference Gates-Rector and Blanton2019), sample-preparation methods (Hillier Reference Hillier1999), and software (Rietveld Reference Rietveld1969; Bergmann et al. Reference Bergmann, Friedel and Kleeberg1998; Chipera and Bish Reference Chipera and Bish2002; Eberl Reference Eberl2003; Doebelin and Kleeberg Reference Doebelin and Kleeberg2015) have now made obtaining accurate quantitative analysis of even very challenging mixtures from XRPD data possible (Raven and Self Reference Raven and Self2017).
Modern instrumentation and sample-preparation methods can also result in the accumulation of large, high-throughput datasets containing hundreds to thousands of reproducible diffractograms – each representing a precise mineralogical signature of a sample (Woodruff et al. Reference Woodruff, Cannon, Eberl, Smith, Kilburn, Horton, Garrett and Klassen2009; Butler et al. Reference Butler, O'Rourke and Hillier2018, Reference Butler, Palarea-Albaladejo, Shepherd, Nyambura, Towett, Sila and Hillier2020). High-throughput datasets with limited mineralogical variation and primarily ordered crystalline phases can be quantified readily using the now widely adopted Rietveld approach (Rietveld Reference Rietveld1969). With increasing mineralogical diversity of a dataset along with the presence of disordered (e.g. clay minerals) and amorphous phases (e.g. volcanic glass or soil organic matter), however, the process of identifying and quantifying components in large numbers of samples can become a challenging and particularly time-consuming undertaking. These challenges create a need for an approach that can move towards automation of mineral identification and quantification of high-throughput, mineralogically diverse datasets containing clay-bearing samples, whilst maintaining good accuracy.
Round robin competitions such as the Reynolds Cup challenge participants to quantify complex mixtures containing a wide variety of clay minerals, with an overall goal of stimulating improvements in analytical techniques for characterization of clay-bearing mixtures. Of the many available analytical techniques, XRPD analysis of bulk powders (i.e. randomly oriented milled samples) is usually the primary technique for quantifying RC samples (Omotoso et al. Reference Omotoso, McCarty, Hillier and Kleeberg2006; Raven and Self Reference Raven and Self2017), but is used in combination with auxiliary analyses to complement the precision of the initial stage of mineral identification. Frequently, these auxiliary techniques often include XRPD measurements of the clay fraction (<2 μm) of oriented specimens subject to glycolation and subsequent heat treatments, along with total bulk-sample elemental analysis to cross check the feasibility of the quantitative mineralogical results. Since 2002 the nine biennial RC contests have promoted the advancement of protocols for quantitative mineralogy, from which a range of approaches have proven accurate, all of which rely on XRPD as the primary tool for quantification.
One approach for quantifying RC samples that has been placed in the top three at each of the nine contests (2002–2018) is the full-pattern summation (FPS) of prior measured standards (Smith et al. Reference Smith, Johnson, Scheible, Wims, Johnson and Ullmann1987; Chipera and Bish Reference Chipera and Bish2002; Eberl Reference Eberl2003; Vogt et al. Reference Vogt, Lauterjung and Fischer2002; Omotoso et al. Reference Omotoso, McCarty, Hillier and Kleeberg2006; Raven and Self Reference Raven and Self2017). This approach is based upon the principle that an observed XRPD measurement is the sum of individual crystalline and amorphous components within the sample, including instrument-dependent contributions (Smith et al. Reference Smith, Johnson, Scheible, Wims, Johnson and Ullmann1987; Chipera and Bish Reference Chipera and Bish2002). Full-pattern summation utilizes a reference library of pure diffraction patterns (‘standards’/‘reference patterns’) which are preferably measured on the same instrument used to run the unknowns in order to best match the instrument-dependent variation in both the sample and reference library data (Chipera and Bish Reference Chipera and Bish2002; Omotoso et al. Reference Omotoso, McCarty, Hillier and Kleeberg2006; Eberl Reference Eberl2003). Upon optimizing an observed pattern based on the sum of contributions from the appropriate pure standards, all of these methods derive phase concentrations using Reference Intensity Ratios [RIRs; Hillier (Reference Hillier2000)], which describe the diffraction intensity associated with a given phase relative to that of a standard (usually corundum, Al2O3). It is worth noting that the way in which the RIRs are described, derived, and formulated varies from one implementation to another. All of these recent FPS approaches also include the background in the reference library patterns on the assumption that background effects, such as those due to fluorescence, are also additive.
For the present investigation, the hypothesis was that, given a comprehensive reference library that can cover most, if not all, of the minerals that may be encountered in a given set of samples, the FPS approach can be automated to provide both identification and quantification of phases in mineralogically diverse datasets. The algorithm presented for doing so was implemented in version 1.2.3 of the powdR package (Butler and Hillier Reference Butler and Hillier2020; Butler and Hillier Reference Butler and Hillier2021) for the R Language and Environment for Statistical Computing (R Core Team 2020). Implementation in R implies that the software is open source and multi-platform. The automated algorithm uses a single bulk XRPD measurement in combination with a comprehensive reference library to identify and quantify the concentrations of non-clay, clay, and amorphous components. Here, a mineralogically diverse dataset comprising 27 RC samples, three from each of the previous nine contests (RC1 to RC9), has been utilized. The RC samples were considered most suitable for testing the accuracy of the automated approach for several reasons: (1) the dataset exhibits substantial mineralogical diversity; (2) implicit within this diversity is the presence of clay minerals and occasional amorphous phases; (3) all samples were prepared rigorously by independent laboratories; and (4) the availability of anonymous results for each contest allowed comparison of the accuracy relative to all other participants.
Materials and Methods
X-ray Powder Diffraction
Sample preparation and measurement
Samples from RC1 to RC9 were available based on the participation of Stephen Hillier in all previous Reynolds Cup contests. For RC1 and RC2, samples were spiked with a known weight percentage of an internal standard (~20% corundum), whereas for RC3 through to RC9, the sample-preparation protocol was changed and all samples were prepared without addition of an internal standard.
Each of the 27 RC samples was prepared for XRPD as received by McCrone milling 3 g of sample for 12 min in ethanol and spray drying the resulting slurry to obtain a random powder specimen as described by Hillier (Reference Hillier1999) and demonstrated by Kleeberg et al. (Reference Kleeberg, Monecke and Hillier2008). This preparation was done at the time of each of the respective Reynolds Cups, so over a 16 year period (2002–2018). To enable further the detection of trace-mineral phases, very high quality diffraction data were recorded by scanning over the range 4−70°2θ on a Bruker D8 using Ni-filtered Cu Kα radiation, fixed divergence slits, and a Lynxeye XE detector, with counts recorded for 16 s per 0.0195°2θ step yielding scan times of 16 h. These scans were already available for RC7 to RC9, but for RC1 to RC6 the spray-dried specimens were retrieved from their storage (8−18 y) in capped glass vials and re-run on the D8 diffractometer, which was not available in the authors’ laboratory prior to RC7 (2014).
Reference library preparation
A reference library of standard XRPD patterns of pure minerals has been compiled in Stephen Hillier’s laboratory over a period of time from specimens of pure minerals obtained from various mineral collections or purchased, such as from the Source Clays Repository of The Clay Minerals Society (Costanzo and Guggenheim Reference Costanzo and Guggenheim2001). The purity of the minerals was assessed mainly by XRPD data, and for many samples – especially the clay minerals – the best purity was obtained by picking or by size-fractionation procedures. Inevitably, small impurities remained in many samples, e.g. quartz is a ubiquitous contaminant of most clays, even very fine-size clay fractions. Where required, remaining impurities were, therefore, removed electronically by subtraction of the whole pattern of the pure phase impurity. All such treated patterns were scaled to a maximum intensity of 10,000 counts prior to determination of a full-pattern RIR from a mixture of the pure mineral (plus any impurities) with corundum as an added internal standard, for which the weight fractions were known. Further details of this procedure will be presented elsewhere. All standards were run under the same diffractometer conditions as the unknowns, except that the recording time per 0.0195°2θ step for library standards was just 2 s. All backgrounds of the standards and samples were retained throughout.
The full reference library available for this investigation included 201 diffractograms of pure standards designed to cover most components associated with geologic, soil, and sediment samples. Of these, 76 were clay mineral/phyllosilicate reference patterns, 116 were non-clay, and nine were amorphous, nanocrystalline or paracrystalline (allophane, ferrihydrite, glass, obsidian, opal-CT, opal-A, aluminosilicate gel, organic matter, and graphite). Many of the library entries are for the same mineral, e.g. the library as used contains patterns for seven different specimens of kaolinite. Since RC5 was organized by Hillier, this library contains patterns for exactly the same mineral specimens that were used for the preparation of the RC5 samples. Given this, the current testing of the automated algorithm for RC5 samples represents a ‘best case scenario.’ In all other cases, the minerals in the library are not necessarily from the same source as the minerals in the unknown Reynolds Cup samples, though some may be when RC organizers have used widely available materials such as those from the Source Clays Repository of The Clay Minerals Society.
Mineral standards used to create this reference library were also associated with the top-three place finishes in all RC contests except for RC5 (organized by Hillier). The key component tested here was, therefore, the ability of the present algorithm to pre-select the appropriate phases from a large and comprehensive reference library for subsequent automatic quantification.
Automated Full-Pattern Summation
The automated full-pattern summation algorithm and its source code are freely available as the afps function in version 1.2.3 of the powdR package (Butler and Hillier Reference Butler and Hillier2020; Butler and Hillier Reference Butler and Hillier2021) for the R language and environment for statistical computing (R Core Team 2020), and is hosted on the Comprehensive R Archive Network (https://cran.r-project.org/package=powdR). Detailed descriptions of afps arguments and their usage are provided in the powdR documentation. A flowchart detailing the use of afps in the present study is provided in Fig. 1, and relevant arguments summarized in Table 1. More detailed descriptions of the key steps outlined in Fig. 1 are provided in subsequent sections.
Flowchart detailing the stages implemented within the afps algorithm as applied here. Arguments of afps are represented in bold, with further details on their definitions and values provided in Table 1. NNLS = non-negative least squares

Adjustable arguments for the afps algorithm (Fig. 1) applied here along with associated descriptions and values used. Further arguments not relevant to the use of afps presented here are described in the powdR package documentation available at https://cran.r-project.org/package=powdR

Step 1: Sample alignment
Previous in-house experience with full-pattern summation has highlighted the importance of aligning the sample diffractogram along the 2θ axis to that of a calibrated pattern in order to correct for common experimental aberrations associated with the collection of XRPD data (Butler et al. Reference Butler, Sila, Shepherd, Nyambura, Gilmore, Kourkoumelis and Hillier2019). The discrete nature of XRPD peaks means that seemingly small misalignments can have particularly detrimental effects on data analysis along with the accuracy of phase identification and quantification.
The automated alignment of a sample via the afps algorithm used here requires selection of a phase present within it to use as an internal standard (std argument; Table 1). For RC1 and RC2, samples were prepared with corundum as the internal standard which was, therefore, used for this alignment. For RC3–RC9, samples were prepared for XRPD analysis without an internal standard, and hence the ‘internal standard’ for alignment was chosen simply as a component of the mineral mixture with sharp, well characterized diffraction features for use as internal d-spacing standard. The designated ‘internal standard’ for each sample was then used by afps to align the diffractogram along the 2θ axis and hence correct for common experimental aberrations such as sample displacement.
Alignment of the sample to the chosen standard is achieved by maximizing the Pearson correlation via one-dimensional optimization (Brent Reference Brent1971) within a fixed limit of positive and negative 2θ shifts defined by the align argument (Table 1).
With respect to many geologic and environmental samples, the omnipresent mineral quartz can act as a suitable internal standard for the large majority of cases. In the absence of quartz, any well characterized non-clay mineral with few overlapping peaks may be suitable (e.g. dolomite, calcite, anhydrite) providing it is present within the sample(s) being considered and that any solid solutions are represented appropriately by a standard in the reference library. For the present dataset, visual inspection of each of the samples identified that quartz reference patterns would be suitable internal standards in 18 cases. In the remaining three cases where a suitable quartz signal was not observable, internal standards of fluorite (RC5-2), anhydrite (RC7-1), and dolomite (RC9-3) were selected. For all samples presented here, the align argument was set to 0.1°2θ.
Step 2: Phase selection with non-negative least squares
For high-throughput datasets that may display substantial mineralogical variation, a comprehensive reference library is necessary that can cover most, if not all, of the non-clay, clay, and amorphous phases that may exist within the sample set. In such cases it is reasonable to expect that reference libraries containing >100 reference patterns would be required, in which case it becomes impractical to optimize so many variables at once – both in terms of accuracy and time. For this reason, phase selection on a sample-by-sample basis is a key component of automated full-pattern summation.
The afps algorithm applied here uses non-negative least squares (NNLS) to identify quickly the phases that can be removed from the reference library. Functionality for NNLS in R is provided by the NNLS package (Mullen and van Stokkum Reference Mullen and van Stokkum2012), which is based on the FORTRAN code of Lawson and Hanson (Reference Lawson and Hanson1995). Application of NNLS facilitates rapid identification of phases in the reference library that probably exhibit no contribution to the observed pattern via derivation of coefficients equal to zero, which are thus omitted from the process (Fig. 1).
Step 3: Minimization of an objective function
As outlined by Chipera and Bish (Reference Chipera and Bish2002), a range of functions can be minimized for full-pattern summation. Choosing an appropriate function for minimization is key to accurate quantitative analysis via this approach. For mixtures containing clay minerals, non-clay minerals, and amorphous phases, past experience at the James Hutton Institute has shown that the minimization of R wp (Bish and Post Reference Bish and Post1989), defined as:

often results in the most accurate quantitative results (I
m
and I
c
are vectors of measured and calculated intensities, respectively). Indeed, the R wp statistic is noted typically as one of several performance parameters in Rietveld refinements (Toby Reference Toby2006), and by weighting the count intensities via the
 terms, results in calculated patterns that prioritize the fitting of regions near to the tails of peaks (Bish and Post Reference Bish and Post1989). This attribute has beneficial effects when handling the diffuse diffraction signal of poorly ordered and amorphous phases that are encountered commonly in RC samples. Hence, the R wp was used as the objective function for all RC samples presented here, and was minimized using the Broyden-Fletcher-Goldfarb-Shanno (BFGS) algorithm (Broyden Reference Broyden1970; Fletcher Reference Fletcher1970; Goldfarb Reference Goldfarb1970; Shanno Reference Shanno1970).
The initial optimization of R wp in the afps algorithm is applied across all reference patterns that remain after NNLS (Fig. 1). The BFGS optimization routine does not constrain coefficients to positive values; thus any reference patterns that have negative coefficients after optimization are removed from the process, and R wp re-optimized until no negative values remain (Fig. 1).
Step 4: Shifting of reference library patterns
Further to linear alignment of the sample pattern to a reference pattern (Step 1), small additional 2θ shifts applied to each reference pattern in the fitting process of the XRPDBULK program (Hillier Reference Hillier2015, Reference Hillier2018) have been found to yield more accurate results. Hence, a second alignment step implemented in the afps algorithm seeks to apply small 2θ corrections to the reference patterns relative to the sample pattern to account for additional small variations such as uncorrected sample displacement errors that may be present in the reference library. More specifically, after an initial optimization of the scaling coefficients, the objective function (Eqn 1) is again minimized by optimizing a shifting coefficient for each remaining reference pattern, which specifies its positive or negative adjustment along the 2θ axis. During the optimization of the shifting coefficients, the scaling coefficients are fixed and reference patterns are maintained on the same 2θ axis interval using cubic spline interpolation. If the absolute value of any optimized shifting coefficient exceeds the value specified in the shift argument, its shifting coefficient is reset to zero. Reference patterns are then shifted by the derived shifting coefficients, with cubic spline interpolation again used to ensure that they all remain on the original 2θ axis interval, and the scaling coefficients re-optimized (Step 3). In all cases presented here, the shift argument was set to 0.5°2θ.
Step 5: Quantification and limit of detection estimation
At this stage, appropriate phases were assumed to have been selected from the reference library and the fitted pattern was assumed to be reasonable, from which a reasonably accurate estimation of phase concentrations can be obtained using the RIRs. Because all RC samples presented here were prepared without an internal standard, all detectable phases within the mixture were assumed to be identifiable and that their concentrations summed to 100 wt.%. As such, phase concentrations (X) were computed by:

where s and RIR denote vectors of the scaling coefficients (i.e. the parameters derived from NNLS and optimization of R wp) and RIRs covering all remaining phases, respectively.
At this point in the process, some phases, estimated to have very small concentrations, may, inevitably, have been selected in error. Whilst all phases below a defined limit (e.g. 0.1%) could be simply excluded, such an approach would not account for the way in which different phases diffract X-rays with different power (reflected in the RIRs) and, hence, have different limits of detection (LOD) (Hillier Reference Hillier2003). For example, a strong diffractor such as quartz, with a RIR (relative to corundum) of ~5.7, would have a smaller LOD than a weak diffractor such as muscovite (RIR ≈ 0.5). Thus the afps algorithm uses the RIRs to derive sensible estimations of LODs for all remaining phases via:

where LODstd is the LOD of the internal standard (defined by the lod and std arguments of the afps algorithm; Table 1), RIRstd is the RIR of the internal standard, and RIR is a vector of RIRs for all remaining phases. Upon calculating the LODs, all clay and non-clay phases below their respective LOD are removed from the process. For all RC samples presented here, the lod argument was based on the assumption that the LOD of quartz (RIR = 5.68) was 0.15%, from which the LODs of other internal standards used (fluorite, RIR = 4.9; anhydrite, RIR = 3.0; and dolomite, RIR = 2.3) were estimated via Eq 3. Note that the actual value for the LOD of any phase used as reference can be calculated if a sample is spiked with a known weight fraction of another phase as outlined by Hillier (Reference Hillier2003), but the simplified approach presented here is based on an arbitrary but realistic LOD for quartz.
Amorphous phases need to be treated slightly differently in the afps algorithm to account for the way in which their diffusely scattered signal can be difficult to detect in XRPD data, deeming the approach of Eq 3 as inappropriate. For this reason the amorphous phases defined by the amorphous argument are retained unless their estimated concentrations are lower than the value specified in the amorphous_lod argument (Table 1). For all RC samples presented here, nine phases in the reference library were defined in the amorphous argument (allophane, ferrihydrite, glass, obsidian, opal-CT, opal-A, aluminosilicate gel, organic matter, and graphite), and the amorphous_lod argument set to 2%.
After omission of phases based on LODs, a final re-optimization of R wp was applied until no negative parameters remained (Fig. 1). At this point the fitting process was considered complete, and final concentrations computed via Eq 2 in units of wt.%.
Computation
Application of the afps algorithm to each of the 27 RC samples was carried out in powdR version 1.2.3 (Butler and Hillier Reference Butler and Hillier2020; Butler and Hillier Reference Butler and Hillier2021) on a Windows 10 machine equipped with an Intel® CoreTM i7-6600U CPU @ 2.60 GHz. Computation time averaged ~1 h per sample. For faster computation time of a batch of samples, the afps algorithm can be used in combination with the foreach and doParallel R packages for parallel processing across multiple cores (Microsoft and Weston 2017, 2018).
With the exception of the specification of different ‘internal standards’ (used for alignment in this case) and limits of detection, the same parameters were used for all arguments of the afps algorithm for all 27 samples (Table 1). Further, no visual inspection or amendments to the output were carried out. Whilst it is always recommended to inspect visually outputs from full-pattern summation, the aim of the present study was to test whether an entirely automated approach to quantifying mineralogically diverse samples could yield accurate results.
Pre-requisites for Automated Full-Pattern Summation
Although running the afps algorithm is relatively simple, accurate quantification from it is ultimately facilitated by the combination of reproducible diffraction data and a comprehensive reference library that can account for all of the phases present within a given dataset. The quality of the XRPD data, both for the sample and the reference library, relates particularly to the potential effects of particle statistics and preferred orientation. Preferred orientation of minerals with prominent cleavage planes can be eliminated during sample preparation using techniques such as spray drying (Hillier Reference Hillier1999; Kleeberg et al. Reference Kleeberg, Monecke and Hillier2008), and the reproducibility of diffraction data as a result is a major advantage to methods using full-pattern summation of prior measured standards as presented here.
Although not tested in the present study, the size of the library can prove influential on the accuracy of the final output and the speed with which it can be obtained. More specifically, whilst larger libraries (hundreds of reference patterns) promote the selection of appropriate phases, it would be recommended that they are customized for a given dataset based on the minerals that are likely to be encountered. The presence of additional phases that would not be encountered within the samples simply acts to slow down the computation and/or increase the chance of misidentification. Aside from misidentifications, in some cases visual inspection of the output may identify that a sample contains a mineral that is not present within the library. This would require the user to source a suitable reference mineral and add it to the library using protocols outlined above. In either case the incidence of misidentified and/or unidentified phases can be assessed quickly via visual inspection of the outputs and residuals, which would always be recommended.
Reynolds Cup Accuracy Determination
The accuracy of the automated algorithm for all RC samples was assessed based on absolute bias (in wt.%) for all phases. In order to allow direct comparison with previous RC contestants (i.e. to derive comparative contest placings), these absolute bias values were summed to produce an overall score using the procedures applied in the judging of each previous contest. For RC1–RC3 placings were determined based on the sum of absolute bias for all known phases. For RC4–RC9 placings were determined based on the sum of bias for all known phases plus the summed weight percentages of any misidentified phases (i.e. phases not present within the sample). The mineralogical groupings used for each RC contest are provided in Tables S1–S9 in the Supplementary Material.
Results
Phase Selection and Overall Accuracy
As outlined above and illustrated in Fig. 1, the afps algorithm involves several steps that reduce the full reference library to an appropriate subset for each sample. These include the application of NNLS, removal of negative coefficients during optimization, and exclusion of phases estimated to be below the limit of detection. The number of phases remaining at various points in the afps process for the 27 RC samples is summarized in Fig. 2. From an initial library containing 201 reference patterns, application of NNLS and the associated exclusion of any phase with a parameter equal to zero (Fig. 1) yielded a reduced library containing a mean of 52 patterns. Subsequent optimization and removal of negative coefficients resulted in the removal of another seven patterns, on average. Shifting and reoptimizing the scaling coefficients until no negatives remained resulted in removal of a further three patterns, on average. Estimation of LODs and the associated removal of phases below their respective LOD (including any amorphous phases estimated to be below the amorphous_lod argument; Table 1) resulted in a further 43% reduction to the library, with a mean of 24 remaining phases. Lastly, re-optimization and the associated removal of phases with negative coefficients resulted in a final selection of 23 reference patterns, on average.
Phase selection at various stages of the afps algorithm for all 27 RC samples. Red line represents the mean at each stage

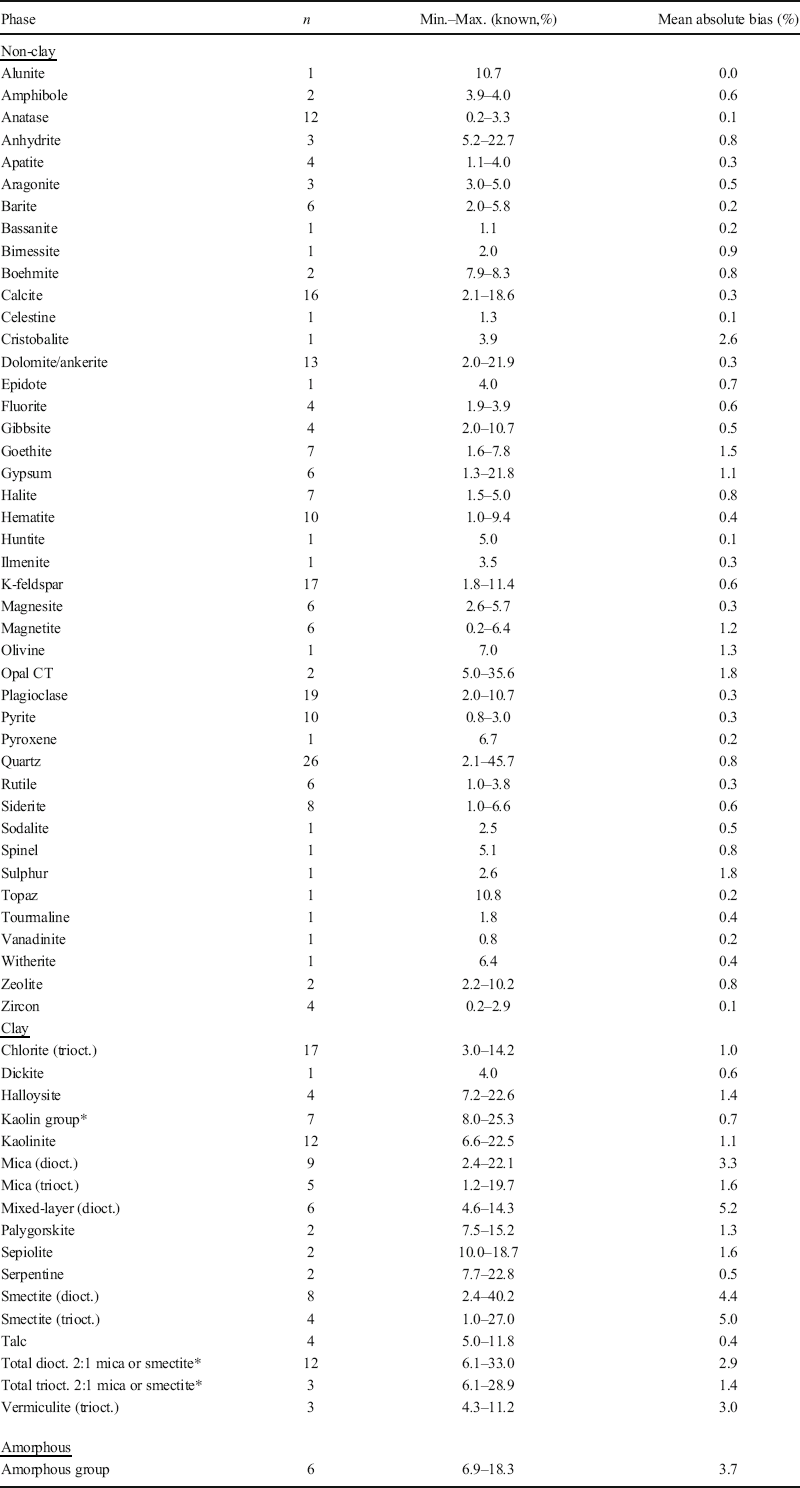
The resulting final phase selections across the 27 RC samples presented here covers 151 reference patterns from the full library, representative of 61 correctly identified (i.e. present within the sample and the afps output) clay/non-clay/amorphous groups (Table 2). This large number of reference patterns selected across the dataset illustrates the mineralogical diversity of the Reynolds Cup samples, whilst the relatively small mean number of reference patterns in the final selection from the afps algorithm indicates selectivity. The appropriateness of the final selection for each sample determines ultimately the quality of the fits and, therefore, the accuracy of the resulting quantification.
Summary of the accuracy for correctly identified phases present in the RC samples

*denotes clay mineral groupings that were used only in RC1–RC4.
All correctly identified, misidentified (i.e. not present within the sample but present within the afps output), and unidentified (i.e. present within the samples but not present within the afps output) phases encountered across the 27 RC samples are summarized in Fig. 3. Misidentified phases (Table 3) are scattered on the vertical at the intercept x = 0, whilst unidentified phases (Table 4) are scattered on the horizontal at the intercept y = 0. In summarizing all data displayed in Fig. 3, the mean absolute bias for non-clay, clay, and amorphous phases equates to 0.57% (n = 275), 2.37% (n = 120), and 4.43% (n = 14), respectively. Further exploration of these results is provided below according to the correctly identified, misidentified, and unidentified groupings.
Known concentrations of all phases (classified according to amorphous, clay, and non-clay groupings) from all 27 RC samples plotted against the estimated concentrations from the afps algorithm

Summary of the misidentified phases present in the outputs from afps

Summary of the accuracy for unidentified phases present in the RC samples but not in the respective afps output

*denotes phases that were not present within the reference library.
By comparing the overall accuracy for each contest to the anonymous results of all participants, the accuracy of the afps outputs presented here would have been sufficient for the following placings: RC1 = 2nd/15, RC2 = 2nd/35, RC3 = 1st/39; RC4 = 2nd/44; RC5 = 1st/64; RC6 = 3rd/63; RC7 = 3rd/68; RC8 = 1st/70; RC9 = 2nd/74 (Table 5). Given that the world’s leading mineralogists and laboratories are amongst the participants of each Reynolds Cup (based on the published top named finishers; www.clays.org/Reynolds.html), the competitive accuracy of the afps algorithm in combination with the small values of absolute bias together indicate that the approach can derive accurate quantitative mineralogical analysis from a single random powder XRPD measurement when provided with a suitable reference library.

Correctly Identified Phases
The absolute bias of all correctly identified phases is summarized in Table 2. The mean absolute bias of non-clay constituents was 0.55% across the 0.20% to 45.70% known concentration range (n = 222). In contrast, the mean absolute bias of the correctly identified clay constituents was 2.18% (n = 102) across the 1.00–40.20% known concentration range, with that of the amorphous constituents being even higher at 3.74% across the 6.90–18.27% known concentration range (n = 6).
Misidentified Phases
Across the 27 RC samples tested, the sum of misidentified phases averaged 3.13% per sample. All misidentified phases are presented in Tables S1–S9, and are summarized in Table 3. The majority of misidentified phases were non-clay minerals, with a mean misidentified concentration of 0.68% (n = 24). The number of misidentified clay minerals across the 27 samples was smaller than for non-clay minerals, but with a notably larger mean misidentified concentration of 4.33% (n = 11). Three cases of misidentified amorphous phases were found, all in RC1 samples, with a mean misidentified concentration of 6.76%.
Unidentified Phases
Across the 27 RC samples, there was a total of 41 cases where phases present within the samples remained unidentified in the outputs from the afps algorithm, with the sum of unidentified phases averaging 2.77% per sample. All unidentified phases are presented in Tables S1–S9, and are summarized in Table 4. As found for misidentifications, the majority of unidentified phases were non-clay minerals (n = 29), with a mean known concentration of 0.63%. Three of these unidentified non-clay minerals were not present within the reference library (cryolite, nahcolite, and vivianite; Table 4). In contrast to the number of unidentified non-clay minerals, only seven cases of unidentified clay minerals were identified across the 27 samples, with a mean known concentration of 2.18%. Further to non-clay and clay minerals, five cases emerged where amorphous phases within the sample were not identified by afps, with a mean known concentration of 4.37%.
Discussion
Reynolds Cup samples are prepared to be challenging mixtures to quantify – mainly due to the diversity of clay minerals that they may contain along with a relatively detailed clay-mineral classification system that is applied to the results (Raven and Self Reference Raven and Self2017). As would be expected, the accuracy of the afps outputs shows a notable difference between the non-clay and clay-mineral groupings (Fig. 3), with the mean absolute bias of all non-clay minerals being ~4.2 times less than that of clay minerals.
The inaccuracy of clay-mineral quantification relative to non-clay minerals may reflect, in part, the difficulty in identifying correctly clay minerals from a single bulk XRPD measurement, as the afps algorithm seeks to do, due to the way in which many clay minerals have many similar features in their bulk diffraction patterns. The even greater inaccuracy with respect to amorphous phases would also be expected given the often ambiguous ‘background’ signal associated with phases of this type which often lack any coherent Bragg diffraction. In relation to clay-mineral and amorphous-phase identification, the most successful participants of the Reynolds Cup used oriented specimens and successive treatments of these to identify precisely the clay-mineral components in a sample, whilst total elemental analysis of bulk samples was also often used to identify more accurately the nature of X-ray amorphous phases (Omotoso et al. Reference Omotoso, McCarty, Hillier and Kleeberg2006; Raven and Self Reference Raven and Self2017). The finding that the afps algorithm produces highly competitive results compared to other RC participants, even without these additional analyses, is particularly promising for the future of automated quantitative phase analysis by XRPD.
In addition to the bias associated with correctly identified phases, an important aspect of the results is the presence of misidentified phases (Tables 3, 5, and S1–S9), which can easily compromise the accuracy of quantitative analysis. Misidentified non-clay minerals were present in 21 of the 27 samples (Table 5), with an overall mean of 1.37% per sample. Misidentified clay minerals were present in 11 of the 27 samples (Table 5), with an overall mean of 1.76% per sample. The slightly higher concentrations for misidentified clay minerals compared to non-clay minerals again reflects the challenging nature of their identification from bulk XRPD data alone.
The presence of ~7% misidentified amorphous material in each of the 3 RC1 samples (Table S1) highlights the care needed when quantifying amorphous phases from bulk XRPD data alone, particularly since the reason for this consistent misidentification in RC1 samples remains unclear. Of the clay-mineral misidentifications, two stand out as being particularly high, relating to samples RC6-2 and RC7-2 (Tables 5, S6, and S7). The RC6-2 misidentification relates to selection of a trioctahedral smectite reference pattern (8.22%; Table S6), which, based on the true sample composition, is probably a misidentification against the dioctahedral smectite it contains. The RC7-2 misidentification relates to the selection of a sepiolite reference pattern (10.13%; Table S7), again probably instead of the dioctahedral smectite.
When using the afps algorithm, ultimately a balance must be struck between the number of misidentified phases and the number of unidentified phases, which is controlled largely by the appropriateness of the reference library and value that the user specifies in the lod argument (Table 1). With respect to lod, setting this parameter to a very small value or zero would promote increased numbers of misidentifications but may decrease the number of unidentified phases. The reverse applies if the lod value is excessively high. Thus, in the present case, the approximate balance of both misidentified and unidentified phases (3.5% and 2.6% per sample on average, respectively) may represent a reasonable compromise, based on the assumption that the LOD for quartz in all samples would be 0.15% (Table 1). Further reduction of the incidence of misidentified and unidentified phases would almost certainly be achieved by visual inspection of the results, which, as outlined above, was not undertaken in this study.
As previously mentioned, the clay-mineral classification of RC samples is relatively detailed, creating a challenge for the selection of appropriate reference patterns via an automated approach. If instead, a very coarse description of clay is applied, i.e. total clay minerals, the accuracy of the results can be improved (Fig. 4). Comparing the total clay mineral concentrations estimated by afps (including misidentified clay minerals) to the known total concentrations, the mean absolute bias across the 27 samples reduces to 2.13% in the known range of 14.20% to 67.80% total clay. It is, therefore, worth emphasizing that if a completely automated approach is going to be applied, the user may wish to adjust the clay-mineral classification system to best reflect the limitations of the method - with coarser descriptions providing greater accuracy in terms of total clay or related clay groupings at the compromise of detail.
Known concentration of total clay minerals for all 27 RC samples plotted against that estimated from the afps algorithm

Viewed as a whole, the accuracy of the afps algorithm presented here is promising, particularly as the results are derived from a single bulk XRPD measurement. This relative simplicity is important in the case of high-throughput datasets because additional mineralogical (i.e. clay fractions) and geochemical (e.g. total elemental) analyses are undoubtedly a time-consuming and expensive undertaking. Whilst one would not expect an automated approach to exceed the accuracy of that achieved from multiple forms of analyses combined with expert input, the present data illustrate that accurate results can still be obtained. For high-throughput cases, some accuracy will inevitably need to be compromised in order to quantify mineral concentrations in hundreds or thousands of samples. Expert input is still no doubt necessary in such high-throughput cases, and although not included within this investigation (outputs from the afps algorithm were not inspected or altered in any way), would probably act to enhance the accuracy of automated approaches. The most effective form of expert input is visual inspection of fitted patterns and their residuals relative to the original measurement (Butler and Hillier, Reference Butler and Hillier2021). Such inspection allows a trained user to identify phases that are missing from the analysis, or those that should be removed.
Applicability to Natural Samples
Whilst RC samples are prepared to represent naturally occurring clay-bearing mixtures, the challenging nature of sourcing pure clay mineral standards increases the likelihood that the standards in the reference library match exactly those used to prepare the samples – resulting in artificially enhanced accuracy compared to the quantification of natural samples. To assess for the occurrence of exact matching in the present study, available information on how RC samples were prepared was collated and contest organisers contacted where sufficient information was not available. Based on this information, the majority (50–92%) of reference patterns in the library supplied to the afps algorithm were not used to prepare the RC samples for each contest (Table 6), with the exception of RC5, which was organized by Stephen Hillier. The general absence of exact matching between reference library standards and RC sample constituents presented here indicates, therefore, that the approach should be suitable for natural clay-bearing samples if appropriate mineral standards can be sourced.
Summary of the clay mineral standards used to prepare the samples for each RC contest that are not present as reference patterns in the library supplied to the afps algorithm in this study

Natural clay-bearing mixtures may contain more complex clay minerals than those in RC samples, especially in relation to interstratified clay minerals that are more difficult to isolate as pure phases for use in round-robin contests. Furthermore, phases with a broad solid solution series may make it difficult to cover the whole range of each series without a large library of standards specially designed to do so. That said, neither of these issues is unsurmountable. The only way to gauge the likely accuracy of any form of quantitative mineralogical analysis on natural samples is indirectly, however, e.g. by comparing the measured bulk chemical composition to a bulk chemical composition generated from the mineralogical analysis by assuming, or obtaining, chemical compositions of the respective minerals quantified in any given sample. This approach was used, for example, by Casetou-Gustafson et al. (Reference Casetou-Gustafson, Hillier, Akselsson, Simonsson, Stendahl and Olsson2018) for soils quantified by the FPS approach using the same standard pattern library. Future testing of the afps algorithm will seek to assess its accuracy when applied to natural samples, but such assessments can never be as direct as those obtained from application to round robin samples where accuracy can be assessed precisely by comparison to the known mineralogical compositions.
Conclusions
An open source, automated, full-pattern summation algorithm has been shown to quantify accurately mineral concentrations in complex clay-bearing mixtures from the previous nine Reynolds Cup contests. The accuracy of the automated results would have been sufficient for the top three placings in all RC contests tested (RC1 = 2nd, RC2 = 2nd, RC3 = 1st; RC4 = 2nd; RC5 = 1st; RC6 = 3rd; RC7 = 3rd; RC8 = 1st; RC9 = 2nd). Non-clay minerals were quantified with a mean absolute bias of 0.57%, whilst that of the clay minerals was higher at 2.37%, and for amorphous phases was 4.43%. In some cases the incorrect identification of clay minerals was a key component of the overall bias; when comparing total clay content, however, the automated algorithm yielded very accurate values, suggesting that careful consideration should be given to the level of clay identification that can be expected of automated approaches based on a single bulk XRPD measurement. The detection and quantification of amorphous phases remains difficult from bulk XRPD data alone, especially when mixed into complex mineral assemblages. Although many ‘X-ray amorphous’ phases have quite distinctive features in their scattering/diffraction patterns, others can look very alike, and therefore manual inspection of afps outputs in combination with auxiliary analysis (e.g. total element analysis) remains beneficial and recommended for enhanced accuracy. The results are ultimately promising, and the proven accuracy justifies the potential for further application to high-throughput XRPD datasets. Future testing of the algorithm’s accuracy on natural samples via the use of total elemental analysis will act to assess further its performance and applicability for high-throughput mineral quantification of soils and sediments.
Supplementary Information
The online version contains supplementary material available at https://doi.org/10.1007/s42860-020-00105-6.
ACKNOWLEDGMENTS
This work was supported by a Macaulay Development Trust Fellowship, United Kingdom, Grant No. MDT-50. The support of the Scottish Government’s Rural and Environment Science and Analytical Services Division (RESAS) is also gratefully acknowledged. The authors thank the three anonymous reviewers and the Editorial Board for their useful comments which helped to improve this paper.
Funding
Funding sources are as stated in the Acknowledgments.
Compliance with Ethical Statements
Conflict of Interest
The authors declare that they have no conflict of interest.