


I. INTRODUCTION
Integrated spiral inductor is a key component in low noise amplifier, oscillators, filters, and impedance-matching networks. Therefore, inductor behavior studies in order to find out an equivalent electrical model should be considered. An accurate model will allow to anticipate and to improve the actual performance of the circuit.
Recently, a large number of works on integrated spiral inductors have been published [Reference Yu Cao1–Reference Ragonese, Biondi, Scuderi and Palmisano4]. However, lumped models were usually used for low frequencies (less than 10 GHz). Non-linear description of a circuit behavior needs a simulation up to the third-order harmonic. Starting with the introduction of new low-cost substrates such as silicon substrate, particular behaviors of inductor must be also considered and precisely described. The simplest model of an inductor on silicon substrate is given in Fig. 1 [Reference Yu Cao1, Reference Murphy, McCarthy, Delabie, Murphy and Murphy2], where L s and R s represent, respectively, series inductance and resistance of the integrated spiral inductor. The series feed forward capacitance C s accounts for the capacitance due to the overlaps between the spiral and the center-tap underpass and between the spiral turns. The parasitic C ox1,2 and C sub1,2 capacitances represent, respectively, the coupling effects across oxide layers and silicon layer. Losses due to conductive substrate are modeled by R sub1,2.
Classical model of spiral inductor on silicon substrate [Reference Yu Cao1, Reference Murphy, McCarthy, Delabie, Murphy and Murphy2].

One of the drawbacks about the use of silicon technology in the microwave field is the substrate conductivity which is much greater than for III–V materials. This involves many physical phenomena at high frequencies like proximity effects, and particularly eddy current in the silicon substrate.
However, the classical model (Fig. 1) is relatively simple and it does not contain elements that take into account the particular phenomena described above. Therefore, this model is only valid at lower frequencies and was then modified to many different types with different complexity to be more precise at higher frequencies. Generally, there are two major models: simple pi-model and double pi-model [Reference Fujishima and Kino3, Reference Ragonese, Biondi, Scuderi and Palmisano4]. Accuracy of these models compared to measurement is, therefore, significantly improved. Nevertheless, to achieve a greater accuracy, it is necessary to increase the model complexity [Reference Lee, Mohammadi, Bhattacharya and Katehi5–Reference Benaissa12]. Thus, elements in this kind of models are no more analytically extracted but are deduced by optimization procedure. Many elements are introduced by physical consideration but their value cannot be significantly reached from measurement [Reference Yu Cao1, Reference Lee, Mohammadi, Bhattacharya and Katehi5, Reference Chyurm Guo and Tan13].
In this paper, we propose a new pi-model deduced directly from measurements. Even if the usual inductance is used in a usual lower frequency band, we must not forget that non-linear simulations, using for instance harmonic balance, need an efficient description of the component up to the third or even fifth harmonic. Thus, all the elements in this model, which are frequency independent, are analytically extracted. The general approach consists of extracting a model directly from the measurement and interpreting each of its elements. This avoids having a large number of physically founded elements that remain impossible to reach from the measurements. The feasibility of this approach was verified by applying the obtained results on other inductors of different dimensions and different number of turns. We finally obtain an original equivalent scheme. The extraction method of the equivalent model and the comparison between the measurement results and those obtained from the extracted equivalent circuit is described in Section II. Section III describes an improved model of inductor whose elements are extracted by optimization procedure, simply to justify some previous results. In Section IV, we present the obtained results while applying the proposed equivalent model and extraction procedures to two other inductors. Finally, Section V draws conclusions.
II. EXTRACTION OF THE MODEL PARAMETERS
We have measured a two-turn spiral inductor on a silicon substrate as shown in Fig. 2.
Structure of the inductor on an SiGe substrate.

The outer diameter d is 200 µm, the strip width W, and the gap s between strips are, respectively, 20 and 3 µm which lead to a nominal inductance of 1 nH. The measurements have been carried out from 100 MHz to 40 GHz using a line-reflect-match calibration with an alumina calibration substrate [Reference Williams and Marks14]. The de-embedding process is based on a simplified representation of the accesses between the alumina substrate reference plane and the inductance reference planes as shown in Fig. 3. These accesses have been characterized by measuring a short in the inductor reference plane giving Z 1 and Z 3 then an open giving Z 1 + Z 2 and Z 3 + Z 4 [Reference Rockwell and Bosco15]. The accesses lengths have been optimized in order to minimize Z 1 and Z 3.
Representation of the accesses.

A conversion from the measured S-parameters to Y-parameters simply leads to the pi topology in Fig. 4 [Reference Yu Cao1, Reference Chyurm Guo and Tan13, Reference Ivan and Minoru16, Reference Adam, Watson, Pascale, Kyuwoon and Andreas17].
Equivalent scheme of the inductor seen as a two-port represented by its admittance matrix.

A) Analytical extraction of the series part elements
The series impedance Z S in Fig. 4 can be split into an inductive part L S and a resistive part R S in series, where


The L S and R S variations against frequency are shown in Figs 5 and 6 where three frequency bands can be defined with regard to the inductor behavior. In region I, at low frequencies, the equivalent inductance L S decreases from a quasi-static value to a constant value. In region II, it increases lightly. This equivalent inductance grows up quickly and then falls down in region III, like in a resonance. For the equivalent resistance R S, in regions II and III, it becomes negative. This phenomenon suggests that a pi representation leads to non-physical results. We will go back to this in Section III.
Variation of the equivalent series part versus frequency.

Variation of the equivalent series resistance at low frequency.

In region I, the behavior of Z S, especially for L S, suggests a magnetic coupling shown in the electrical scheme in Fig. 7 [Reference Murphy, McCarthy, Delabie, Murphy and Murphy2, Reference Lee, Mohammadi, Bhattacharya and Katehi5, Reference Nguyen Tran, Pasquet, Bourdel and Quintanel18–Reference Tai and Liao24]. The values of L 1 and R 1 appear, respectively, as quasi-static values of L S and R S. These values can be read directly on the ordinate axes of Figs 5 and 6.
Equivalent circuit of the series part of the inductor in regions I and II.

This kind of transformer describes the eddy currents in the silicon substrate and in the surrounding metals, including spiral metal and ground metal. L 2, R 2, and M are not significant by themselves because they are not related to well-defined voltages and currents. They are perceived from the primary of the transformer by the coupling coefficient k = (M 2 /L 1L 2) and the relaxation time τ = (L 2 /R 2). Hence, in the frequency band of region I, impedance of the series part of inductor, Z I could be approximated by

From equation (3), we can extract two parameters, k ex and τ ex as shown in equations (4) and (5). Then, k and τ are extracted from the curves of k ex and τ ex in region I where they become constant as shown in Figs 8 and 9 [Reference Nguyen Tran, Pasquet, Bourdel and Quintanel18]:

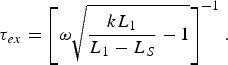
Extraction of k.

Extraction of τ.

In region II, from about 12 GHz, R S becomes negative whereas L S increases lightly. This is represented by the branch of a capacitance C 1 in series with a negative resistance R 3 [Reference Lee, Mohammadi, Bhattacharya and Katehi5], which appears at higher frequencies only, i.e. as shown in Fig. 10. This negative value for R s does not correspond to a physical phenomenon. This only proves that the physical behavior of the inductance is not completely described by a pi model. Actually, it is a combination of a pi and a tee models. We will return on this phenomenon at Section III.
Equivalent circuit of the series part of the inductor.

At higher frequencies (region III), we have a resonance behavior of L S. This behavior can be described by a series resonant L 3C 2 element in parallel as shown in Fig. 10.
Since the values for (C 1, R 3) and (C 2, L 3) are extracted independently, we perform the extraction of (C 1, R 3) at lower frequencies in region II, around 12 GHz to eliminate influence of C 2 and L 3. This extraction frequency must be also high enough to reduce the influence of the (L 1, R 1L 2, R 2) elements used for low frequencies, which can affect the extraction result for C 1 and R 3. The extraction frequency has been then chosen at 15 GHz and the values for R 3 and C 1 are obtained from the two following expressions:

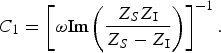
Finally, the product L 3C 2 can be evaluated by the resonance frequency extrapolated from Fig. 5. The values for the elements of Fig. 10 are given in Table 1.
Extracted values for the equivalent circuit elements of the series part of the inductor.

Figures 11 and 12 show the comparison up to 40 GHz for the series part of the inductor, represented by L S and R S, between the proposed model (Fig. 10) and the measurement results.
Comparison of the equivalent resistance for the series part of the inductor between measurement and equivalent circuit: (a) for the whole frequency band and (b) at low frequency.

Comparison of the equivalent inductance for the series part of the inductor between measurement and equivalent circuit.

B) Analytical extraction of the parallel part elements
The parallel admittance (Y P2) in the right part of Fig. 3 can be split into an equivalent capacitance C P and an equivalent resistance R P in series, where
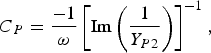

Figures 13 and 14 show their variations against frequency.
Variation of the equivalent capacitance of the right parallel part of the inductor versus frequency.

Variation of the equivalent resistance of the right parallel part of the inductor versus frequency.

After a quasi-static behavior (at lowest frequencies), both capacitance and resistance decrease and tend to be constant at higher frequencies. Their evolution shapes versus frequency suggest the equivalent circuit in Fig. 15 [Reference Chyurm Guo and Tan13–Reference Adam, Watson, Pascale, Kyuwoon and Andreas17, Reference Patrick Yue and Simon Wong19–Reference Melendy, Francis, Pichler, Hwang, Srinivasan and Weisshaar27].
Equivalent circuit of the parallel part of the inductor.

In Fig. 15C R1 corresponds to the part of electric field lines that pass through the SiO2 layer and (C R2, R R1, R R2) correspond to the other part in the silicon substrate. The parallel terms become

where C R1 and R R1 denote, respectively, the value of the C P and R P at low frequencies, which correspond to the quasi-static values on the ordinate axis. However, due to the calibration uncertainty at low frequencies, these quasi-static values are not precisely determined. We have taken the values for C R1 and R R1 at relatively low frequencies as shown in Figs 13 and 14. The tolerance of this extraction is not very important because the next extractions based on these values permit to approach the model from the measurement results for the whole frequency band.
The development of equation (10) gives the following expressions of C R2ex and R R2ex:


The product ωR R2C R2 in equation (10) could be negligible at low frequencies. Thus, to be more precise, the values of C R2 and R R2 are deduced at higher frequencies from the curves of C R2ex and R R2ex where they become constant (Figs 16 and 17).
Variation of C R2ex versus frequency.

Variation of R R2ex versus frequency.

The extracted values for the elements of Fig. 15 for both left and right parallel parts of the inductor are summarized in Table 2.
Extracted values for the elements of the equivalent circuits of the parallel parts of the inductor.

Finally, Figs 18 and 19 compare R P and C P extracted from the measurements to their values calculated by using the equivalent circuit in Fig. 15.
Comparison of the equivalent series resistance for the right parallel part of the inductor between measurement and equivalent circuit.

Comparison of the equivalent series capacitance for the right parallel part of the inductor between measurement and equivalent circuit.

C) Results
The complete equivalent scheme of inductors on silicon substrate is the association of series and parallel parts and is given in Fig. 20.
New model for inductors on lossy substrate.

The numerical results are given in Table 3.
Extracted values for the elements of the equivalent model of the inductor.

A commonly used parameter of a shorted inductor is its quality factor Q defined as

Figures 21–23 show the comparison between measurement and equivalent circuit in terms of quality factor Q and S-parameters.
Comparison of quality factor Q of inductance between measurement and equivalent circuit.

Magnitude comparison of S 11 and S 12 between measurement and equivalent circuit.

Phase comparison of S 11 and S 12 between measurement and equivalent circuit.

We obtain a good agreement between the measurement and the proposed model over the whole frequency band. This result allows applying the proposed model and the extraction procedure of elements to other inductors on lossy substrate.
III. COMPLETE MODEL OF INDUCTOR ON LOSSY SUBSTRATE
A more complete model has been studied in order to explain the negative value for R 3. It is shown in Fig. 24. The results for the element values have been obtained after an optimization. They are summarized in Table 4.
Complete equivalent scheme taking negative resistance R 3.

Extracted values for the elements of the complete equivalent model of the inductor without negative resistance.

All elements in the complete model of inductance proposed in Fig. 24 have realistic values. This model has thus taken the parasitic coupling effects in the silicon substrate into account. However, the elements cannot be analytically extracted, the model of Fig. 20 is preferred while modeling inductors.
IV. APPLICATION TO OTHER INDUCTORS
We have applied the model (Fig. 20) and the extraction procedures of elements presented in Section II to two other inductors with different geometrical parameters. We have obtained also a good agreement between the measurement results and the equivalent model. Tables 5 and 6 give the results for inductor 1 (d = 240 µm, N = 2, W = 20 µm, s = 3 µm) and inductor 2 (d = 240 µm, N = 3, W = 20 µm, s = 3 µm).
Values extracted of elements of the equivalent model of inductor 1.

Values extracted of elements of the equivalent model of inductor 2.

Figures 25–27 show the variation of the most significant elements of inductances, L HF, R 1, k, against the number of turns N whose diameter d, strip width W, and gap s are, respectively, 200, 20, and 3 µm. The preferred element L HF is the asymptotical value of L s in region I and corresponds to the nominal value of the inductance. It is determined as

Variation of LHF versus N for given d, s, and W.

Variation of R 1 versus N for given d, s, and W.

Variation of R 1 versus N for given d, s, and W.

These results may be interpolated by other on-wafer inductor characterizations and then by efficient electromagnetic simulation results. Thus, by using the extraction procedure that we propose, it will be possible to propose scalable models that are useful for circuit designers.
V. CONCLUSIONS
We have proposed, in Section II, a methodology to extract equivalent circuit of an inductor from 0.1 up to 40 GHz. The eddy currents, the electromagnetic parasitic coupling, and a parasitic resonance have been described in the series part. The different physical effects in the substrate are taken into account in the parallel parts of the model. The different parameters are analytically extracted without the need of an optimization procedure.
The complete model of Fig. 24 contains elements having physical values obtained by optimization procedure. This model allows us to explain the parasitic phenomena in the silicon substrate and the negative resistance R 3 of the model of Fig. 20 where all elements are analytically extracted.
However, our model is sufficient to describe the inductor behavior. Further extraction from electromagnetic simulation will allow our method to propose scale rules for each scheme element.
 Linh Nguyen Tran was born in HaiDuong, Vietnam, on June 15, 1980. He received the M.S. degree in information, system and technology from Ecole Normale Supérieure de Cachan, in 2005. He gained his Ph.D. degree in 2009 at ETIS laboratory.
 Emmanuelle Bourdel (M'04) received the Ph.D. degree from Institut National des Sciences Appliquées de Toulouse, France in 1989. She is currently at Ecole Nationale Supérieure de l'Electronique et de ses Applications as an assistant professor. Her current research interests are noise and electrical characterization of monolithic microwave integrated circuits and passive devices and interconnection on chip.
 Sébastien Quintanel received the Ph.D. degree in electronics from the University of Limoges, France in 2002. Since 2003 he is an assistant professor at Ecole Nationale Supérieure de l'Electronique et de ses Applications (ENSEA) in Cergy, France and is doing his research at the ETIS laboratory. His research activities concern principally the design and characterization of low noise devices for microwave and millimeter-wave applications.
 Daniel Pasquet (M'86, SM'96) is a professor at Ecole Nationale Supérieure de l'Electronique et de ses Applications in Cergy, France and has his research activity at LaMIPS in Caen, France. He gained his Ph.D. at Lille University in 1975. He is currently IEEE France Section chair, MTTS chapter coordinator for Region8, and member of MTT-S “Measurements” Technical Committee (TC-11).



