Ethnic minorities are consistently under-represented in all democracies,Footnote 1 perhaps in part because majority voters discriminate against minority candidates.Footnote 2 Conversely, some research shows that visible minorities are more likely to vote for members of their own ethnic or racial group in the United StatesFootnote 3 and in proportional representation systems that allow preference voting.Footnote 4 While there is also evidence that candidate ethnicity affects voting in British elections, with one exceptionFootnote 5 this evidence has thus far been based on aggregate data or qualitative reports. There are also some interesting questions about the effects of candidate ethnicity that arise from the British context that can only now be addressed with high-quality individual-level survey data from the 2010 Ethnic Minority British Election Study. This article considers whether white British voters are more reluctant to vote for non-white candidates, and whether ethnic minority voters are more inclined to support non-white candidates, perhaps especially those from the same ethnic group.
White British people perceive different minority groups differently, and Muslims receive among the most hostile reactions.Footnote 6 The terrorist attacks of 11 September 2001 in New York and on 7 July 2005 in London heightened Islamophobia,Footnote 7 and there have been claims that bigotry against Muslims is now socially acceptable.Footnote 8 This article considers whether Muslim candidates in particular suffer an electoral penalty from white voters, but also whether Muslim voters are more likely to support Muslim candidates.Footnote 9
The next section outlines some important features of the context before we discuss previous research and possible mechanisms by which candidate ethnicity might affect vote choice. The data and methodology sections then precede the results and concluding discussion.
Background on Ethnicity in British Electoral Politics
Britain's five main non-white minority groups as identified in the census question on ethnicity are Indian, Pakistani, Bangladeshi, black Caribbean and black African. Together they made up approximately 8 per cent of the electorate in 2010.Footnote 10 With the exception of some first-generation black Africans from non-Commonwealth countries, members of these groups are all entitled to vote and, if registered, they tend to vote at similar rates as the white British majority.Footnote 11 They have also consistently been much more likely to vote Labour than whites,Footnote 12 perhaps mainly because all of the legislation advancing the rights and opportunities of ethnic minorities has been passed by Labour governments.Footnote 13
As in other Western countries, there is evidence of discrimination against non-white ethnic minorities in the labour market in Britain.Footnote 14 Since the British Social Attitudes surveys began in 1985, they have shown around 30 per cent admitting to being at least somewhat ‘prejudiced against people from other races’ with relatively little variation.Footnote 15 This context raises the question of whether ethnic minorities are at a disadvantage in the political arena as a result of prejudice and discrimination.
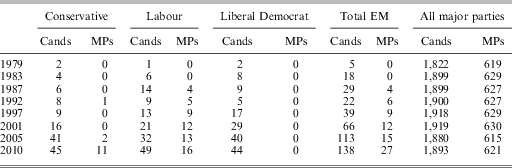
Record numbers of ethnic minority candidates stood and were elected in 2010 (see Table 1). However, the twenty-seven ethnic minority members of parliament (MPs) that were elected in 2010 constitute just 4 per cent of all MPs, but this figure is less than half of the proportion of ethnic minorities in the population as a whole.Footnote 16 Most of the increase in the number of ethnic minority MPs between 2005 and 2010 can be accounted for not by a simple increase in the number of minority candidates, but by a new strategy by the Conservatives to ensure that several were placed in safe seats.Footnote 17
Numbers of Ethnic Minority Candidates and MPs 1979–2010

Source: Rallings and Thrasher (Reference Rallings and Thrasher2007). GB, three main parties only, with authors’ own figures for 2010.
Before minority candidates face a penalty at the hand of the electorate, they may also be subject to particular difficulties and prejudice at the candidate-selection stage.Footnote 18 As a result, minority candidates who survive the selection process are likely to be at least as good (if not better) quality candidates as their white counterparts. Many will have important experience as a local councillorFootnote 19 or strong local support, especially in relatively high minority-density areas.Footnote 20
Previous Research on The Effects of Candidate Ethnicity In Britain
Although until recent elections there have been insufficient numbers of ethnic minority candidates for systematic analysis, there have been various cases in which non-white candidates appear to have done especially badly in the polls because of their race or ethnicity. The failure of black Conservative candidate John Taylor to win Cheltenham in 1992 is perhaps the most famous example. More comprehensive analysis of aggregate constituency election results shows that minority candidates from both the Conservative and Labour parties did worse (in terms of change in the constituency share of the vote since the previous election) than other candidates from their parties in the 1987, 1992 and 1997 elections.Footnote 21 Looking at how, between 1997 and 2001, changes in the share of the vote across constituencies varied according to changes in the ethnic status of the candidates, Mortimore found that ethnic minority candidates from Labour and the Liberal Democrats suffered an electoral penalty, but that Conservatives did not.Footnote 22 Similar analysis for 2005 suggested that Conservative ethnic minority candidates fared less well than others from their party, but this was not so for Labour ethnic minority candidates.Footnote 23 For the 2010 election, Stegmaier et al. found that incumbent party candidates benefited from having an ethnic minority challenger.Footnote 24 Also, Curtice et al. show that the fortunes of ethnic minority candidates relative to others from their party were sensitive to the ethnic composition of the constituencies.Footnote 25 Minority candidates from both the Conservative and Labour parties did worse than white candidates in areas with few non-white residents, but in constituencies with large minority populations being an ethnic minority candidate brought a slight advantage.Footnote 26
While these studies do not find consistent candidate ethnicity effects for all parties at all elections, this could be because the methodology relies on infrequent changes in ethnicity of a party's candidate to identify effects. The accumulated evidence suggests that white voters discriminate against non-white candidates, while ethnic minority voters may favour them. However, the ecological inference problemFootnote 27 means that we cannot necessarily draw this conclusion from the above-mentioned studies, with the exception of Stegmaier et al., who look at both aggregate- and individual-level data.Footnote 28 Most recently, an internet survey experiment showed a small negative effect of being Muslim, based on evaluations of hypothetical candidates rather than actual votes of non-Muslims.Footnote 29
In addition to white/non-white candidate effects, there is some sporadic evidence that in areas with large ethnic minority populations the particular ethnicity of a minority candidate can affect electoral performance. For example, in 1997 despite an 11 percentage point fall nationally in the Conservative share of the vote, the party were up by 5 points in Bethnal Green and Bow and down by less than a point in Bradford West. Both seats have large Muslim populations and saw Conservative Muslim candidates stand against non-Muslim Labour candidates.Footnote 30 In Bethnal Green and Bow the Labour candidate, Oona King, was from a mixed Jewish and African-American background, while in Bradford West, Labour fielded an Indian Sikh after a tense selection process. Such examples suggest that ethnic minority voters may prefer to vote for a co-ethnic candidate or one with the same religion, but in addition to the ecological inference problem the aggregate data on this issue are sparser.
Social Mechanisms That Might Generate or Moderate Candidate Ethnicity Effects
The general phenomenon that this article investigates is voting, by both white and ethnic minority voters, in favour of or against candidates based on their ethnic or religious characteristics. There are numerous mechanisms that might generate or moderate such candidate ethnicity effects. We start by discussing symmetrical and then asymmetrical mechanisms, before turning to group-specific issues and finally potential moderating factors.
Symmetrical Mechanisms
Sensitivity to candidate ethnicity may be driven by mechanisms that are symmetrical in the sense that they can, at least theoretically, apply to all groups and lead each group to favour its own to a similar extent. There are various potential symmetrical mechanisms for candidate ethnicity effects. First, there is pure prejudice for one's own group, what Becker described as a ‘taste for discrimination’.Footnote 31 A second possibility is that a voter might favour a candidate of the same ethnicity or religion in the belief that such a candidate will represent his or her views and interests better on the basis of shared experience. Thirdly, voters may trust co-ethnics (as in-group members) more than they do members of ethnic out-groups because of a shared social identity. In addition to trust, the social psychology literature also suggests that in-group members are likely to benefit from other positive attitudes, emotions and feelings.Footnote 32 For example, Tate found that black candidates sparked group loyalty, pride and political interest among black citizens in the United States.Footnote 33 A fourth mechanism suggests that voters are more likely to be mobilized by co-ethnic candidates,Footnote 34 perhaps because of their social networks or bonding social capital. In the United States there is evidence that minority candidates focus on voters from their group as core supporters and devote more effort to mobilizing them.Footnote 35
While these mechanisms are theoretically symmetrical, since they might be equally applicable to all groups, in practice, whether and how they operate is likely to depend on the groups involved and the context. More generally, because the overwhelming majority of candidates and MPs is white, minority candidates are likely to be seen by all kinds of voters as, to some extent, exceptional. This is true even in areas with large concentrations of minorities.Footnote 36 So it is more appropriate to assess the extent to which different groups of voters choose in favour of or against different kinds of ethnic minority candidates than it is to look for symmetrical patterns of preference for in-group over out-group members.
Asymmetrical Mechanisms
In addition to mechanisms that in theory are symmetrical but in practice might not be, there are mechanisms that might have asymmetrical candidate ethnicity effects even in theory. One of these would be an analogy of the idea of ‘statistical discrimination’ in the labour market, whereby employers discriminate on the basis of assumed productivity differences between ethnic or racial groups that cannot be linked to observable objective characteristics, such as educational attainment.Footnote 37 The analogous mechanism for electoral politics would suppose that candidates from different ethnic groups are not equally good (at least on average) at the generic tasks of being an MP, such as responding to constituent concerns. There is evidence from Canada and the United States that candidate quality affects electoral performance.Footnote 38 But without being able to control for candidate quality, we might expect all groups of voters to favour the ethnic group that fields, on average, the best candidates. As mentioned above, ethnic minority candidates are likely to be more positively selected based on quality than whites. If so, then statistical discrimination (by white and minority voters) should be in favour of minority candidates as they are likely to be better, on average, than white candidates.
A second asymmetrical mechanism is that candidate ethnicity might act as a heuristic for a candidate's traits, values or ideology in the context of a constituency contest in which British voters typically know very little about the candidates.Footnote 39 While in the United States voters perceive ideological and character differences between candidates according to race, and minority legislators do act more as trustees of minority interests,Footnote 40 in Britain, Buttice and Milazzo find that race has an insignificant effect on the ideological distance between the top two candidates in a constituency.Footnote 41
Group-specific Issues
The direction and strength of all the mechanisms described above could vary according to the specific ethnic or religious identities of the voters and candidates in question. Ford shows that whites are more opposed to immigration from South Asia than the West Indies.Footnote 42 We also expect whites to be especially unlikely to vote for Muslim candidates. Discrimination may be stronger because of greater social distance and distrust between these groups, which often falls into the category of Islamophobia.Footnote 43 In the United States, Benson et al. found that 40 per cent of survey respondents said they would be unwilling to vote for a Muslim candidate for president; in their experimental study, Muslims and atheists were the most discriminated against groups.Footnote 44 In their comparison of attitudes to religion in the United States and Britain, Voas and Ling found similarly negative attitudes to Islam in both countries.Footnote 45 Various opinion polls in Britain have also reported hostility to Islam; in 2006 and 2011 approximately 50 per cent reported that Islam was a threat to Western liberal democracy.Footnote 46
Although far from being a single homogenous group with a strong shared non-white immigrant-origin identity, a shared status and experience as visible minorities create a common interest in and concern for anti-discrimination legislation and race relations policy that may lead non-white voters to disproportionately support ethnic minority candidates generally. But minorities are perhaps most likely to vote for candidates from their own ethnic group. Such co-ethnic voting is likely to be stronger for Asian groups due to higher rates of intermarriage,Footnote 47 geographical segregationFootnote 48 and political organizationFootnote 49 than black groups. In their broad discussion of immigrant incorporation into European politics, Laurence and Maxwell remarked specifically on the extent to which Pakistanis and Bangladeshis in Britain have successfully organized and mobilized their own communities to elect their own members.Footnote 50 Similarly, Solomos and Back and Garbaye note that their qualitative research suggests that voting based on kinship networks is particularly strong among Pakistanis,Footnote 51 which is commonly referred to as part of the biraderi system.
Co-ethnic loyalties might even lead to discrimination against non-coethnic minority candidates.Footnote 52 For example, the attitudes of some people of Indian, Bangladeshi and Pakistani descent sometimes reflect the hostile sentiments of people in those countries to each other. There have also been tensions between Asian and black groups, including violence, such as in the 2005 Lozells riots. The Bradford West and Bethnal Green and Bow 1997 constituency results discussed above suggest that these differences may be important in elections.
Alongside ethnic identities, minority religious identities – especially Islam – may be the source of electoral support for in-group candidates. Islamophobia may provoke particularly strong solidarity among Muslims in Britain. But even without this, Muslims share strong religious beliefs, identity and policy concerns that could lead Muslim voters to support Muslim candidates. Mosques and Islamic organizations may reinforce these predispositions and processes. Statham argues that the Muslim identity is much stronger than the (South) Asian one as a basis for political claims making,Footnote 53 in part because Hindus and Sikhs have been more economically successful.Footnote 54
Potential Moderating Factors
To add to the complex set of potential mechanisms that might generate candidate ethnicity effects, there is also a series of factors that might moderate the strength of any candidate ethnicity effects. Such processes would be observed as interaction terms with candidate characteristics.
First, for both whites and minorities, we expect to see greater discrimination against out-group candidates among those who are more generally prejudiced against ethnic out-groups.Footnote 55 In addition, for ethnic minorities, strength of in-group identity and perceived racial discrimination may also be associated with greater support for co-ethnic or non-white candidates. Given recent debates about a backlash against the biraderi system, co-ethnic voting might be weaker for young and second-generation Pakistanis.Footnote 56
Secondly, preferences for descriptive (or symbolic) representation may have a moderating effect. Both advocacy organizations and an all-party committee of MPs have called for policies to improve the representation of ethnic minorities in the House of Commons.Footnote 57 The 2010 Ethnic Minority British Election Study (EMBES) found that 43 per cent of respondents agreed that ‘Black and Asian MPs can better represent black and Asian interests than white MPs can.’ Similarly, 60 per cent agreed that, ‘Getting more black and Asian people into Parliament would improve things for ethnic minorities in Britain.’Footnote 58 There should also be stronger candidate ethnicity effects for minority voters with these views.
Thirdly, discrimination by whites against non-white candidates might be weaker in constituencies with larger proportions of ethnic minority voters, along the lines found in the United States,Footnote 59 perhaps as a result of social contact reducing social distanceFootnote 60 or a greater acceptance of minority candidates.Footnote 61 Alternatively, the racial threat hypothesis suggests that more diverse areas lead whites to become more hostile to minorities and thus less likely to vote for minority candidates.Footnote 62 In line with this argument, hostility toward Muslims in Britain and voting for xenophobic parties is greater in areas with more Muslim residents.Footnote 63 This provides reason to expect a negative moderating effect of ethnic composition, which should decline after controlling for attitudes to minorities.
A fourth potentially moderating effect is constituency competitiveness. Voters should be less willing to compromise on voting for a party that best represents their views if there is serious competition for who actually gets elected. So candidate ethnicity effects ought to be weaker in constituencies where the winner had a relatively narrow margin of victory. Similarly with strong incentives to desert candidates running in third or lower place, candidate ethnicity might become a relatively stronger factor with greater distance from contention. Finally, incumbents are likely to be better known to their constituents, so their ethnicity is less likely to be used as a heuristic for judgements of their character, abilities or values.
To the extent that the British case can be viewed comparatively, one could also note that political institutions and social context also act as moderating variables. In comparison with most other European countries, where proportional representation is used, candidate ethnicity effects in Britain's simple plurality electoral system inevitably take a different form. While the United States has the same electoral system, the context of race and ethnicity is so different and the link between district ethnic composition and descriptive representation is so much strongerFootnote 64 that there is no question regarding the existence of candidate ethnicity effects. Also, whereas in Britain's parliamentary system the high levels of legislative party cohesion mean that policy outcomes depend almost entirely on which (usually single) party forms the government, candidate traits and ideology are clearly more important and legitimate concerns in US electoral behaviour because parties are weak and legislators frequently vote against their party. Although there are important differences, Canada is probably the most comparable country to Britain in terms of its political institutions and experience of non-white immigration. Canadian studies have typically found no significant candidate ethnicity effects,Footnote 65 and so we should perhaps expect similar null findings for Britain given the similar importance of parties. However this does mean that if there are candidate ethnicity effects after controlling for factors that affect party preference, they are particularly interesting since they suggest that voters are even willing to compromise on substantive representation in order to avoid voting for candidates from particular ethnic groups.
With the available data, we can test for all of the different mechanisms and moderating factors above, apart from those involving candidate quality and traits, or perceptions of candidates, for which we have no adequate measures. We are, however, able to test for the presence of candidate (co-)ethnicity and (co-)Muslim identity effects, and the extent to which these effects are mediated by contact with parties and co-ethnic activists or moderated by attitudes to immigration as a proxy for Islamophobia (for whites); by group identity measures and attitudes to descriptive representation (for minorities); by the ethnic composition of the constituency; by the competitiveness of the district; by distance from contention; and by incumbency.
DATA
Information on the ethnicity and religion of candidates comes from various sources, including the BBC, The Guardian and Pippa Norris.Footnote 66 It has been cross-checked and supplemented by searches of candidate websites and other online information. Candidates were coded as ethnic minorities if there was public information stating their background as such. These included candidates with mixed white and non-white minority backgrounds. Coding of the five main non-white minority groups sometimes relied on analysis of names and appearance. There were forty-five Indian, forty-two Pakistani, fifteen black African, eleven black Caribbean, seven Bangladeshi and seventeen other ethnic minority candidates for the three main parties, with similar distributions for each party.Footnote 67 Relative to their proportions in the electorate, it is most striking how few black Caribbean candidates there were.
It was possible to identify Muslim candidates mainly because of discussion on websites as to which candidates were Muslim. There were twenty Liberal Democrat, nineteen Labour and sixteen Conservative Muslim candidates, constituting 3 per cent of major party candidates.Footnote 68 It was not possible to consistently identify candidate membership of other religions, which is why this article does not consider candidate religion effects more generally.
Party constituency spending data are from the Electoral Commission. Data for other constituency-level characteristics come from the authors of Curtice et al.Footnote 69 These include election results, constituency census data, incumbency status and measures of the severity of the MPs expenses scandal.
The individual-level data on white voters come from the 2010 British Election Study (BES) campaign internet panel.Footnote 70 Data on ethnic minority voters are drawn from both the BES face-to-face post-election surveyFootnote 71 and the 2010 EMBES survey,Footnote 72 which is based on a face-to-face probability sample of the five main minority groups in Britain: black African, black Caribbean, Indian, Bangladeshi and Pakistani. The survey has at least 90 per cent coverage of these populations, but it is disproportionately drawn from areas with relatively large ethnic minority populations.
Methods
The statistical models used to estimate the effects of candidate ethnicity are alternative-specific multinomial probit models.Footnote 73 The model uses stacked data, with three rows for each respondent, one for each party. Let x ip be a matrix of alternative-specific variables (that is, party-respondent combination specific such as leader ratings) and εip be a normally distributed error term; the utility for voter i of voting for a particular party p = 1, 2 or 3, can be represented as:
 $${{u}_{ip}}\, = \,{{{\bf {{x}}}}_{ip}}\beta \, + \,{{{\epsilon}}_{ip}}{\rm{.}}$$
The probability that voter i chooses party p is:
 $${\rm{Pr}}({{y}_i}\, = \,p)\, = \,Pr({{u}_{ip}}\, \gt \,{{u}_{iq}}\,{\rm{for}}\,{\rm{all}}\,q\, \ne \,p).$$
This model differs from the conditional logit model in the functional form of the distribution of the error term and, more importantly, in allowing the errors to be correlated and thus relaxing the independence of irrelevant alternatives (IIA) condition.Footnote 74 Likelihood ratio tests for the violation of IIA proved highly statistically significant, but the choice of alternative-specific multinomial probit over conditional logit had implications only for the statistical significance of two control variables and no implications for the substantive conclusions regarding candidate ethnicity effects. All the main conclusions are robust to the exclusion of Scotland and Wales or any single constituency.Footnote 75
This model is similar to a multinomial probit model, but it allows alternative-specific variables as predictors. This enables a single coefficient for the effects of candidate ethnicity, or co-ethnicity, to be estimated regardless of the candidate's party. We also tested for evidence of variation in these coefficients across parties. The model set-up allows estimates and predicted probabilities to be appropriately sensitive to different candidature patterns within constituencies (for example, three minority candidates, one Muslim, one non-Muslim minority and one white candidate, etc.), but a modelling strategy that singles out particular combinations would be problematic because of the paucity of cases available to test any particular combination.
For white respondents, we consider the effects of a party having an Ethnic Minority Candidate, of having a Muslim Candidate and of having a candidate of a particular ethnic group. For ethnic minority voters, we consider the effects of having an ethnic minority candidate, a co-ethnic candidate, a Muslim candidate and a co-Muslim candidate. Thus the Co-ethnic Candidate variable takes the value 1 when the party has a candidate of the same ethnicity (Indian, Pakistani, Bangladeshi, black Caribbean or black African) as the respondent, and 0 otherwise. Similarly, the Co-Muslim Candidate variable is 1 only when both the candidate and the respondent were Muslim, and is otherwise 0.
In the interest of parsimony, the models below include only statistically significant variables that have also been established by previous research.Footnote 76 The control variables present in the models for both whites and ethnic minorities are Strength of Party Identification (a four-point scale from 0 = not an identifier, through to 3 = very strongly identify with the party); Party-like Score (an eleven-point scale from 0 = strongly dislike to 10 = strongly like the party); Leader-like Score (0 = strongly dislike to 10 = strongly like the party leader); Party Best on the Most Important Issue (1 if the party was thought to be most likely to solve what the respondent felt was the most important issue, and 0 otherwise); Contacted by Party (1 if the respondent was contacted by the party during the campaign, or 0 otherwise); and finally to capture Duvergerian strategic voting incentives, Distance from Contention (for third- and lower-placed parties, this is the difference between the party's 2010 share of the vote and that of the second-placed party, and 0 if the party came first or second in the constituency). All of these are alternative specific, so their values can vary across the party options for a given respondent.
Although party contact and orientations to parties and leaders are potential mediating factors between candidate ethnicity and vote choice, their inclusion in the model makes little difference to the estimated candidate effects. While candidate ethnicity effects may operate in part through the perceptions of parties, the danger of excluding attitudinal variables is that candidate ethnicity coefficients then more likely reflect the extent to which certain candidates stood where their party was (un)popular with particular groups (that is, the attitudinal variables help resolve a potential selection bias or non-random allocation problem).
Several other potential controls were also considered but found to be insignificant,Footnote 77 most likely because their effects are mediated by variables more proximate to vote choice in the causal chains. A few variables were statistically significant for the whites model but not for minorities (Public Sector Employment, Incumbent MP and Short Campaign Spend as a Proportion of the Legal Limit Footnote 78 ) and vice versa (region, operationalized as resident in Scotland, Wales or the North of England). Where a control variable (say, X) is respondent specific, two coefficients are estimated (Con × X and LD × X) in order to determine the effects on voting Conservative and Liberal Democrat, respectively, each relative to the baseline Labour (just as a regular multinomial logit/probit model would have two such coefficients).
The only attitudinal variable that was considered as a potential moderator of candidate ethnicity effects for whites was feelings toward immigration. Using responses to the question, ‘Which, if any, of the following words describe your feelings about immigration? (Please tick up to FOUR)’ we coded the 77 per cent of respondents that said they were angry, disgusted, uneasy or afraid as having Anti-immigrant sentiment.Footnote 79 This variable serves as a proxy for Islamophobia since Voas and Ling show that all Islamophobes are anti-immigrant and that there are relatively few anti-immigrants who are tolerant of Islam.Footnote 80
For minorities we considered various attitudinal variables as potential moderators, including the belief that Asian and black MPs represent minorities better, preferences for more Asian and black MPs, experience and frequency of discrimination, social distance from whites, strength of black/Asian identity relative to British identity and perceptions of racial prejudice. For Muslims we considered whether strength of Muslim identity relative to British identity, frequency of worship with others and importance of religion were moderators of co-Muslim candidate ethnicity effects.Footnote 81
Results
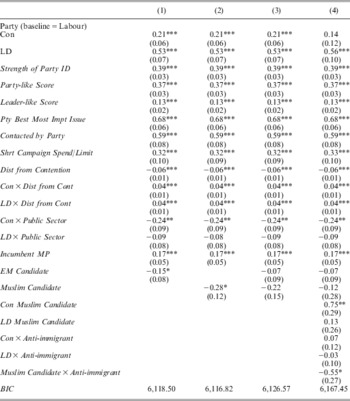
Table 2 shows the coefficients from four alternative-specific multinomial probit models of vote choice for whites who voted for the Conservatives, Labour or Liberal Democrats. The first two terms are alternative-specific intercepts. The main effects of the control variables (those from Strength of Party ID to Incumbent MP) operate in the directions expected. The coefficients for the only respondent-specific control show that public sector workers were less likely to vote Conservative than Labour. There was insufficient evidence that the effects of the alternative-specific controls depended on party, except for Distance from Contention, for which the fitted interaction terms are in the models.Footnote 82
Alternative-Specific Multinomial Probit Models of Major Party Vote Choice for Whites

Notes: N (respondents) = 10,131. Standard errors in parentheses.
Source: BES 2010 Campaign Internet Panel Study, post-wave. White respondents only. *p < 0.05, **p < 0.01, ***p < 0.001
The four models are based on the same sample with the same controls, but vary in their operationalization of candidate ethnicity effects. Model 1 shows that white voters were less likely to support ethnic minority candidates. The average electoral penalty was 4 percentage points of the three-party vote.Footnote 83 The coefficient is only just statistically significant at the 5 per cent level because the data are such that we do not have the statistical power to identify smaller effects.
Model 2 indicates that white voters were significantly less likely to vote for Muslim candidates. The average electoral penalty faced by Muslim candidates at the hands of white voters is 8 percentage points of the three-party vote, twice that of minorities on average. Model 3 suggests that most of the ethnic minority electoral penalty in Model 1 is specifically against Muslim candidates. The coefficient for ethnic minority candidature drops by one-half and ceases to be statistically significant after controlling for Muslim candidature. The effect of Muslim candidature relative to that of other minority candidates is not statistically significant, but the coefficient suggests a substantial difference.Footnote 84
Two refinements are introduced in Model 4.Footnote 85 First, we find that the effect of Muslim candidature differs between parties. The substantial positive coefficient of Conservative Muslim Candidate effectively means that Muslim candidates for the Tories did not suffer the same electoral penalty as those from the other two main parties. With only sixteen Muslim Conservative candidates, there could be some uncontrolled-for issues peculiar to these individuals that might account for this finding.Footnote 86
The second development in Model 4 tests the hypothesis that the anti-Muslim candidate effect is stronger for those who have anti-immigrant feelings. Thus Model 4 includes controls for the main effects of anti-immigrant feelingsFootnote 87 and an interaction between anti-immigrant sentiment and Muslim candidature, which is negative and statistically significant as expected.Footnote 88 Since the main effect of Muslim candidature in Model 4 is not significant, it appears that the anti-Muslim candidate effect is predominantly driven by those with anti-immigrant sentiments.
Other potential moderating variables, for both ethnic minority and Muslim candidate effects, were found to be statistically insignificant. Thus we found insufficient evidence that candidate ethnicity effects were weaker in marginal constituencies, or for those further from contention, or where the minority candidate was the incumbent MP (which contrasts with findings for US citiesFootnote 89 ). Similarly, ethnic electoral penalties are no weaker for those with strong party identification or those contacted by the minority candidate's party. Unlike Carsey or Avery and Fine, we found no tendency for the effect of minority candidature to depend on the ethnic composition of the constituency,Footnote 90 or for the Muslim candidate effect to be weaker where there is a greater proportion of Muslims, regardless of controlling for anti-immigrant sentiment.
Marginal effects (differences in predicted probabilities from the three-party choice) from Model 4 are presented in Table 3 for different scenarios chosen to elucidate how the Muslim electoral penalty varies by party and the feelings of the voter toward immigrants. Each figure shows how the probability of voting for a party would change if it fielded a Muslim instead of a white candidate while the other parties put up white candidates. The first row shows the effects for the three-quarters of voters that have a negative emotional reaction to immigration, and the second row gives the effects for those who do not. Control variables are set at their alternative-specific means (that is, average strength of party identification for Labour for the predicted probability of voting Labour, etc.)Footnote 91
Effects on Voting Probabilities for Whites in Response to Muslim Candidature (Relative to White Candidature) when other Parties have White Candidates

Note: Change figures are percentage points. Simulations from Model 4 in Table 2.
Conservative Muslim candidates were more popular than Conservative white candidates among those without anti-immigrant sentiment, but for those with anti-immigrant feelings Muslim candidature made no practical difference: the positive Muslim Conservative effect is cancelled out by the more general anti-Muslim penalty for anti-immigrant voters. While the model identifies different effects for Conservatives compared with the other two parties, differences between the effect sizes for Labour and Liberal Democrats are entirely to do with differences in baseline probabilities.Footnote 92 There is a negative effect of Muslim candidature for Labour and Liberal Democrats, which is weak and statistically insignificant for those without anti-immigrant feelings but over 10 points for Muslim candidates among anti-immigrant voters.
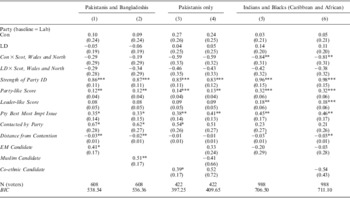
Turning to the electoral behaviour of ethnic minorities, Table 4 shows a similar set of alternative-specific multinomial probit models to those in Table 2, but estimated using only ethnic minorities who voted for one of the three main parties. The control variables are similar, but with some minor variations. Pooled analysis of ethnic minorities together revealed uniformly null results, albeit in the expected directions. These are not shown because they masked important differences between specific ethnic groups. The basis for each model is indicated in the first row. The control variables for all the models in Table 4 are the same and similar to those for the whites, but with some minor variations. The principle for selecting control variables was that anything significant for the pooled ethnic minority models should be included.
Alternative-Specific Multinomial Probit Models of Major Party Vote Choice for Ethnic Minorities

Notes: Muslims only in Models 1 to 4; non-Muslims only in Models 5 and 6. Standard errors in parentheses. *p < 0.05, **p < 0.01, ***p < 0.001.
Source: EMBES and BES 2010 post-election surveys.
Model 1 shows that Pakistani and Bangladeshi Muslim votersFootnote 93 were significantly more likely to vote for ethnic minority candidates overall if we ignore any tendency to prefer particular minorities. Model 2 shows a stronger tendency to vote for Muslim over non-Muslim candidates. But these co-minority and co-religion effects could both be driven by a co-ethnicity effect. Unfortunately, it is not possible to sensibly directly test for a co-ethnicity effect for Bangladeshis because of the paucity of candidates from that group.Footnote 94 So Models 3 and 4 are restricted to Pakistani Muslims only.
Model 3 shows that there is a strong co-ethnic candidate effect for Pakistanis, with an average bonus of 8 percentage points over non-co-ethnic candidates. Model 4 is designed to identify the relative importance of co-minority, co-Muslim and co-ethnic candidate effects. The positive coefficient for ethnic minority candidature generally suggests that Pakistanis are more likely to vote for non-Muslim (including co-ethnic) minority candidates than whites, but the effect is not statistically significant. The larger negative coefficient for Muslim candidates shows that Pakistanis are certainly not inclined to vote for non-Pakistani Muslim candidates, which undermines the idea that there is a co-Muslim effect that is separate from a co-ethnic effect.Footnote 95 Finally, despite the statistical insignificance of each separately, the combination of the substantial coefficient for minority candidates generally, and the bigger additional bonus for being a co-ethnic candidate, indicates that there is strong co-ethnic voting for Pakistanis.Footnote 96
In contrast to the strong co-ethnic candidate effects for Pakistanis, we found no candidate ethnicity effects of any kind for Indians, black Caribbeans or black Africans. Because the results are similarly null for each of these groups separately, Table 4 shows only two pooled models (5 and 6) for these groups. If anything, the co-minority and co-ethnicity effects are negative, even after excluding the small number of Muslim respondents that tends to weaken the chances of finding positive co-ethnic effects. Since the candidature coefficients in these and similar models are clearly statistically insignificant, there is insufficient evidence of candidate ethnicity effects for these groups.Footnote 97
The potential moderating effects discussed above were tested group by group, but all were found to be null or based on dangerously few cases.Footnote 98 There was insufficient evidence that sensitivity to candidate ethnicity depended on strength of party identification, age or generation of immigration,Footnote 99 education, religion, religiosity, relative strengths of ethnic and British identity, social distance from whites,Footnote 100 perceptions of discrimination (either personal or group based), ethnic density of the neighbourhood, marginality of the constituency, distance from contention, party and incumbency status of the ethnic minority candidate,Footnote 101 preferences for descriptive representation, or impressions of improved representation from black and Asian MPs. Collectively, these null findings suggest that co-ethnic voting is not the preserve of those who are least integrated and feel most alienated and discriminated against.
Perhaps the most striking of these null findings is that even those who thought that ‘black and Asian MPs can better represent black and Asian interests than white MPs can’ and ‘getting more black and Asian people into Parliament would improve things for ethnic minorities in Britain’ were not significantly more likely to vote for an ethnic minority candidate (when there was one) than those who did not express such views in favour of greater descriptive representation. Although there was some sign that co-ethnic voting was stronger for Pakistanis who wanted more descriptive representation for blacks and Asians, the effect was not statistically significant (perhaps largely because this question was on the mail-back supplement, which achieved a low response rate). Nonetheless, in general, demand for descriptive representation does not seem to generate more votes for Britain's ethnic minority candidates.
Conclusions
To summarize, the evidence from the last general election shows that white British voters, on average, are less willing to vote for ethnic minority candidates, especially Muslim candidates. The anti-Muslim-candidate effect was largely absent for the quarter of white voters that expressed no anti-immigrant sentiment. For reasons that are not clear from the data, the sixteen Muslim Conservative candidates were more popular than their white counterparts. Candidate ethnicity effects for ethnic minority voters seem to be limited to Pakistani and Bangladeshi voters. For Pakistanis, co-Muslim voting is entirely driven by strong co-ethnic voting. There were too few Bangladeshi candidates to test for co-ethnic voting for Bangladeshis, but they appear to respond to candidate ethnicity similarly.
The relative unwillingness of specifically anti-immigrant whites to vote for Muslim candidates, together with the known positive association between anti-immigrant sentiment and Islamophobia, suggests that the Muslim-candidate electoral penalty is driven by prejudice and discrimination. Our results are consistent with those who claim that Muslims face more hostility in general than other minority groups in Britain.
Although Conservative Muslim candidates did better than their white counterparts, our models suggest that they would have done even better were it not for the Muslim electoral penalty delivered by anti-immigrant whites. Among the possible explanations for the relative success of Conservative Muslims is that they were ‘better’ candidates than the Labour and Liberal Democrat Muslims. Perhaps Muslim Conservatives are much more highly assimilated into white society than Muslims in other parties, or maybe the Tories have a selection process that discriminates more heavily in favour of candidates who will be attractive to white voters.
The strong co-ethnic voting among Pakistanis (and perhaps Bangladeshis) accords with the qualitative evidence on the social and political organization of this group, including claims about the importance of kinship networks. Given the high demand among ethnic minorities in Britain for better descriptive representation, it is perhaps surprising that we did not find stronger and more widespread co-minority and co-ethnic candidate effects. In particular, why are those who want more descriptive representation not much more likely to vote for it? It could be that for minorities, switching parties to gain descriptive representation comes at too great a loss of substantive representation. Whereas white voters often view the parties as rather similar, and so incur little cost on substantive representation by reacting to candidate ethnicity, ethnic minority voters typically believe that Labour are much more likely than other parties to look after the interests of black and Asian people.Footnote 102 So, not only do they vote Labour disproportionately, but it is also a much greater compromise for ethnic minorities to desert Labour in the hope of securing another ethnic minority MP. Moreover, it is perhaps not surprising that candidate ethnicity does not matter so much for the minority of blacks and Asians that is not inclined to vote Labour despite the policy differences on issues of race relations.
Since there are good reasons why preferences for descriptive representation might not lead ethnic minorities to vote disproportionately for minority candidates, the absence of such behaviour provides no excuse for ignoring demands to redress the under-representation of ethnic minorities in parliament. Although it is not clear whether descriptive representation leads to better substantive representation,Footnote 103 cross-national panel data suggest that greater minority descriptive representation leads to greater social respect for marginalized groups.Footnote 104
Finally, while some research on the United States shows that fielding ethnic minority candidates has the benefit of generating support from minority voters, our null findings suggest that that any such benefits appear to be uncertain at best. Moreover, in the case of Muslim candidates, at least from Labour and the Liberal Democrats, any gains from co-ethnic Muslim voters would be outweighed by the costs associated with the loss of support from white voters in the vast majority of constituencies where whites are the overwhelming majority. Nonetheless, the fears of many local party candidate selectors that ethnic minority candidates generally will suffer substantial discrimination at the ballot box seem unfounded.