



1. Introduction
Blazars are a class of radio-loud active galactic nuclei where one of relativistic jets closely aligned towards the line of sight of the observer (Urry & Padovani Reference Urry and Padovani1995). The broadband spectral energy distribution (SED), extending from radio to
 $\gamma$
-ray energies, shows two prominent peaks (Ghisellini et al. Reference Ghisellini1997). The low-energy component is well understood as a synchrotron emission from a non-thermal electron distribution and peaks at IR to X-ray energies. The high-energy component, peaking at
 $\gamma$
-ray energies, remains less well understood. Under the leptonic scenario, the high-energy component is attributed to the inverse Compton (IC) scattering, and the seed photons for the IC process can be synchrotron photons themselves (Synchrotron Self Compton or SSC hereafter) (Maraschi, Ghisellini & Celotti Reference Maraschi, Ghisellini and Celotti1992; Dermer & Schlickeiser Reference Dermer and Schlickeiser1993; Begelman & Sikora Reference Begelman and Sikora1987; Marscher & Gear Reference Marscher and Gear1985) and/or the photons external to the jet (e.g. photons from the broad-line region and dust torus). The latter is commonly referred to as external Compton (EC) (Dermer, Schlickeiser, & Mastichiadis Reference Dermer, Schlickeiser and Mastichiadis1992; Costamante et al. Reference Costamante, Cutini, Tosti, Antolini and Tramacere2018). Alternatively, hadronic scenarios explain high-energy emissions from relativistic proton distribution through the processes such as proton-synchrotron (Aharonian Reference Aharonian2000) and/or hadronic cascades (Mannheim Reference Mannheim1993; Mücke et al. Reference Mücke, Protheroe, Engel, Rachen and Stanev2003). The prominent interactions through which protons can lose its energy includes proton-proton (pp) collision, Bethe-Heitler pair production and photo-meson (
 $p\gamma$
) process. The probability of
 $p\gamma$
process generally surpasses that of a pp interaction since the nuclear region of active galaxies are abundant in radiation. The pp interaction is limited due to low matter density in the jet. Intrestingly, hadronic emission scenario will be associated with the production of neutrinos. Therefore the detection of neutrinos from distant AGNs favours a hadronic scenario (IceCube Collaboration et al. 2018; Buson et al. Reference Buson2023; Prince et al. Reference Prince, Das, Gupta, Majumdar and Czerny2024; Plavin et al. Reference Plavin, Burenin, Kovalev, Lutovinov, Starobinsky, Troitsky and Zakharov2024). Even after decades of research, a strong evidence about the energetics of the jet matter remains an open question (Jagan et al. Reference Jagan, Sahayanathan, Rieger and Ravikumar2021).
Blazars are further classified into Flat Spectrum Radio Quasars (FSRQs) and BL Lacertae-type objects (BL Lacs), depending on the presence or absence of emission line features, respectively (Urry & Padovani Reference Urry and Padovani1995; Ghisellini et al. Reference Ghisellini, Tavecchio, Foschini and Ghirlanda2011). Based on their synchrotron peak frequency BL Lacs are further categorised as low-energy peaked BL Lac objects (LBL:
 $\nu_{syn,peak} \lt 10^{14}\,\textrm{Hz}$
), intermediate energy peaked BL Lac objects (IBL:
 $10^{14} \lt \nu_{syn,peak} \lt 10^{15}\,\textrm{Hz}$
) and high energy peaked BL Lac objects (HBL:
 $\nu_{syn,peak} \gt 10^{15}\,\textrm{Hz}$
) (Fan et al. Reference Fan2016; Abdo et al. Reference Abdo2010). The SED of HBLs can often be explained by considering the synchrotron and SSC emission processes (e.g. Bartoli et al. Reference Bartoli2012); whereas, the high-energy component of FSRQs, LBLs, and IBLs suggests significant contribution of the EC processes (e.g. Thekkoth et al. Reference Thekkoth, Sahayanathan, Shah, Paliya and Ravikumar2023; Malik et al. Reference Malik, Shah, Sahayanathan, Iqbal and Manzoor2022; Liao et al. Reference Liao, Bai, Liu, Weng, Chen and Li2014).
S5 0716+714 is one among the most active blazars discovered in the Bonn-NRAO radio survey (Kuehr et al. Reference Kuehr, Witzel, Pauliny-Toth and Nauber1981). The source is classified as an IBL (Giommi et al. Reference Giommi1999) and located at redshift,
 $z=0.31$
(Nilsson et al. Reference Nilsson, Pursimo, Sillanpää, Takalo and Lindfors2008). It has been extensively studied due to its significant variability on timescales ranging from hours to days across the entire electromagnetic spectrum (Raiteri et al. Reference Raiteri2003; Rani et al. Reference Rani2010
a; Larionov et al. Reference Larionov2013; Rani et al. Reference Rani, Gupta, Joshi, Ganesh and Wiita2010
b, 2013a,b; Gupta et al. Reference Gupta2012). Several optical monitoring campaigns of the source has been carried out (Wagner et al. Reference Wagner1996; Rani et al. Reference Rani2013
b, 2015; Tripathi et al. Reference Tripathi2024) and notably, a clear evidence of very short periodic oscillations (
 $\sim$
15 min) was reported (Rani et al. Reference Rani, Gupta, Joshi, Ganesh and Wiita2010
c). The optical colour versus magnitude plots of the source support a bluer when brighter trend (Rani et al. Reference Rani2010
a; Tripathi et al. Reference Tripathi2024) as well as a redder when brighter trend (Tripathi et al. Reference Tripathi2024). Recently, a long-term optical study has shown a stable colour index change with flux variability, and the authors explained this variability based on Doppler factor variation (Gorbachev et al. Reference Gorbachev, Butuzova, Sergeev, Nazarov and Zhovtan2022). A convex (concave-upward) X-ray spectrum of the source in the 0.1–10 keV band was observed by BeppoSAX (Giommi et al. Reference Giommi1999; Tagliaferri et al. Reference Tagliaferri2003) and XMM-Newton (Foschini et al. Reference Foschini2006; Ferrero et al. Reference Ferrero, Wagner, Emmanoulopoulos and Ostorero2006; Zhang Reference Zhang2010). During the period of 2015 January–February, Swift’s X-Ray Telescope (XRT) continuously monitored burst activity from this source and the 0.3–10 keV spectra were well fitted by a simple power-law function, with the spectral index reaching
 $\sim$
2.7 (Chandra et al. Reference Chandra, Zhang, Kushwaha, Singh, Bottcher, Kaur and Baliyan2015; MAGIC Collaboration 2018). A convex hard X-ray spectrum indicates the presence of both synchrotron and the inverse Compton processes, whereas a power-law soft X-ray spectrum suggests a dominant synchrotron emission. Modelling the convex X-ray spectrum with a broken power-law function showed that the break energy shifted towards higher energies as flux increased, suggesting that synchrotron radiation played a dominant role during high flux states (Wierzcholska & Siejkowski Reference Wierzcholska and Siejkowski2015). In
 $\gamma$
-rays, the source was initially detected by EGRET (Lin et al. Reference Lin1995), and later with the advent of high-sensitivity instruments like AGILE (Chen et al. Reference Chen2008), MAGIC (Anderhub et al. Reference Anderhub2009), and Fermi (Abdo et al. Reference Abdo2009) it was regularly monitored. Notably, this is one of the bright blazars in the Fermi/LAT (Large Area Telescope) Bright AGN Sample (LBAS) and the spectra in the energy range 0.1–300 GeV exhibited a power-law shape (Abdo et al. Reference Abdo2010). However, in the Second LAT AGN Catalogue, the
 $\gamma$
-ray spectrum is described using the log-parabola function due to the significant curvature observed (Ackermann et al. Reference Ackermann2011). Nevertheless, the source is highly variable in
 $\gamma$
-rays, the fastest variability timescale being 1.5 h (Geng et al. Reference Geng2020).
The coordinated multi-wavelength observations of the source in optical and
 $\gamma$
-ray frequencies suggest a significant correlation between optical and
 $\gamma$
-ray fluxes. However, an orphan X-ray flare has also been detected from the source, and this questions the validity of the co-spatial origin of X-ray and other bands (Rani et al. Reference Rani2013
b; Larionov et al. Reference Larionov2013). A multi-wavelength study of the source revealed that the characteristic variability timescales in radio, optical, X-ray, and
 $\gamma$
-ray bands are comparable. The highest variability amplitude was found in optical and
 $\gamma$
-ray regions, whereas it was lower in X-ray and radio regions (Liao et al. Reference Liao, Bai, Liu, Weng, Chen and Li2014). Further, a detailed multi-wavelength cross correlation function analysis of the source was performed by Wierzcholska & Siejkowski (Reference Wierzcholska and Siejkowski2016) during January and February 2015. They showed strong association among optical, UV, and
 $\gamma$
-ray fluxes with no appreciable time lag. However, no significant correlation was identified between X-ray and the other wavelengths. The study also suggested a common region for the observed optical, UV, and
 $\gamma$
-ray emissions. Studies on the broadband SED of the source found a simple SSC model to be insufficient and favoured a combination of SSC and EC processes or a two-zone model (see, e.g. Rani et al. Reference Rani2013
b; Liao et al. Reference Liao, Bai, Liu, Weng, Chen and Li2014; MAGIC Collaboration 2018).
In spite of significant progress in the observational study of the blazar S5 0716+714, a clear understanding of the physical scenario of the source during these multi-wavelength spectral variations has not been achieved. The availability of long-term multi-wavelength observations of the source in optical/UV, X-ray, and
 $\gamma$
-ray wavelengths offers an excellent opportunity to perform a detailed spectral and temporal study. In particular, we analysed the simultaneous observations of the source by Swift and Fermi, spanning a period of
 $\sim$
18 yr, and performed a statistical study to identify the possible reasons for the spectral variations. The correlations between various spectral fit parameters are investigated under a scenario where the broadband SED shifts towards the blue side during high flux states. We also explore the long-term flux and spectral index distributions to determine whether these distributions have any connection with the correlation results. A broadband spectral study of the source, utilising synchrotron, SSC, and EC processes, is also performed for the epochs with simultaneous NuSTAR observations. We further investigated the dominant source parameter responsible for the flux variations using the best-fit model SED. The paper is organised as follows: In Section 2, we discuss the observation and data reduction procedures for various instruments employed. The multi-wavelength analysis and discussion are outlined in Sections 3 and 4, respectively. A summary of the work is presented in Section 5. Throughout this work, we adopt a cosmological framework with
 $\Omega_{\textrm{m}}$
= 0.3,
 $\Omega_{\lambda}$
= 0.7, and H
 $_0$
= 71 km s−1 Mpc−1.
2. Observation and data analysis
We conducted a detailed analysis of S5 0716+714 to investigate its spectral characteristics in differrent wavebands: optical/UV, X-ray, and
 $\gamma$
-ray. We utilised all the observations of the source by Swift-UVOT, Swift-XRT, NuSTAR, and Fermi-LAT telescopes till January 2023.
2.1. Swift-XRT
We conducted an X-ray spectral analysis of the source S5 0716+714 within the 0.3–10 keV range, utilising all the data recorded from April 2005 to January 2023, totalling 361 observations. The X-ray spectra were obtained using the automated online tool ‘Swift-XRT data products generator’ (Evans et al. Reference Evans2009). This tool generates X-ray light curves, spectra, and images for any point source within the Swift-XRT field of view. It automatically selects source and background regions based on the count rate and correct the products for instrumental artefacts, such as photon pile-up and CCD bad columns. The spectra were binned into groups of 20 photons using grppha to improve
 $\chi^2$
statistics.
Table showing best-fit parameters of power-law spectral fitting of Swift-XRT observations.

(Table is available in its entirety in the supplementary material.)
Table showing best-fit parameters of selected Swift-XRT observations using log-parabola model.

(Table is available in its entirety in the supplementary material.)
All spectra were fitted using the power-law (PL) and log-parabola (LP) models within XSPEC. The neutral hydrogen column density was fixed at
 $N_H = 3.11\times 10^{20} \, {\textrm{cm}}^{-2}$
(Kalberla et al. Reference Kalberla, Burton, Hartmann, Arnal, Bajaja, Morras and Pöppel2005). We discarded all observations with degrees of freedom less than 4. We have also excluded all spectra which rendered a reduced chi-square (
 $\chi_{red}^2$
) value greater than 2. With these criteria, we obtained 302 spectra. F-tests were performed to determine the statistical significance of the log-parabola model compared to the power-law model for each individual observation. The best-fit parameters for the power-law model and F-test details are provided in Table 1. In Table 2, we present the best-fit parameters of the log-parabola model for the 35 spectra for which the F-statistic value (F-value) was
 $ \gt $
5 and the null hypothesis probability (P-value)
 $ \lt $
0.05 (these observations are not used in the correlation studies).
2.2. Swift-UVOT
We downloaded all Swift-UVOT (Ultra-Violet and Optical Telescope) observations of S5 0716+714 from the HEASARC archive. UVOT has three optical filters; u (3465 Å), b (4392 Å), and v (5468 Å), and three UV filters; uvw1 (2600 Å), uvm2 (2246 Å), and uvw2 (1928 Å). Standard data reduction proceduresFootnote a were followed to obtain the spectral files. Multiple images in each filter were summed over the extensions using the uvotimsum tool for each observations. A circular region with a 5 arcsec radius centred at the source was used to extract the source counts. A circular region with a radius of about 20 arcsec, free from source contamination, was used for background estimation. The spectral products for each filter were then generated using the uvot2pha tool.
To perform a power-law spectral fit in XSPEC, we considered only the observations for which images were available in at least four filters (249/361). The optical/UV data were corrected for Galactic reddening using the UVRED model, with the parameter
 $E_{B-V}$
fixed at 0.027 (Schlafly & Finkbeiner Reference Schlafly and Finkbeiner2011). We found that some observations required the addition of systematic error to achieve better fit statistics. We discarded those data which demands more than 5% of the systematic error to obtain
 $\chi_{red}^2$
less than 2. After these selection criteria, we got 235 UVOT observations, and the best-fit parameters of the spectral fit are provided in Table 3.
Table showing best-fit parameters of power-law spectral fitting of Swift-UVOT observations.

(Table is available in its entirety in the supplementary material.)
2.3. NuSTAR
The source S5 0716+714 was observed by NuSTAR (Harrison et al. Reference Harrison2013) on 2015 January 24 (MJD 57 046.11) and on 2022 April 4 (MJD 59673.39). This epochs are marked with solid orange vertical lines in Fig. 1. The observations were downloaded through NASA’s HEASARC interface, and the data processing utilised the NuSTARDAS software package (Version 2.1.1) within the HEASoft environment (Version 6.29). For ObsID 90002003002 (MJD 57 046.11), the source spectrum was extracted from a circular region with 45 arcsec radius, while for ObsID 60701037002 (MJD 59 673.39), a radius of 20 arcsec was used. Background estimation was performed using circular regions with radii of 70 arcsec and 50 arcsec, respectively, for ObsIDs 90002003002 and 60701037002. The nuproduct (Version 0.3.3) tool was employed to derive the source and background spectra after running nupipeline (Version 0.4.9) on each observation. Subsequently, the FPMA and FPMB source spectra were individually binned using the grppha tool to ensure a minimum of 30 counts per bin. The final spectra were fitted with an absorbed log-parabola model and the unabsorbed fluxes in the 3–79 keV energy range were used for the broadband spectral study.
Multi-wavelength light curve of S5 0716+714. From top to bottom: panel 1 shows 3-day binned
 $\gamma$
-ray light curve using Fermi-LAT observations in the energy range 0.1–300 GeV. Second panel shows 2-day binned
 $\gamma$
-ray light curve simultaneous with Swift observations. X-ray light curve in 0.3–10 keV energy range using Swift-XRT observations is shown in panel 3 (solid circles in red and open circles in magenta colour corresponds to the observations with power-law and log-parabola models, respectively) and optical/UV light curve in the 2–7 eV energy band using Swift-UVOT observations is given in the fourth panel. The dashed blue lines represent the average flux in each energy bands. The vertical lines in orange colour represent the epochs where NuSTAR observations were available.

Table showing best-fit parameters of spectral fitting using a power-law model (along with TS values) for selected
 $\gamma$
-ray observational data (in 2-day bins) simultaneous with Swift observations.

(Table is available in its entirety in the supplementary material.)
2.4 Fermi-LAT
LAT (Large Area Telescope) is the primary instrument on board Fermi
 $\gamma$
-ray space telescope. In this study, we have determined 2-day binned Fermi-LAT data in the energy range of 0.1–300 GeV to match the Swift observations. To perform data reduction, we employed Fermitools and followed the standard proceduresFootnote b. Photons within a circular region of interest (ROI) with a 10 degree radius, centred on the position of S5 0716+714 were chosen. Only photon-like events falling under the category evclass=128 and evtype= 3 were included. Additionally, a zenith angle cut off (less than 90 degree) was employed to eliminate background
 $\gamma$
-ray contamination originating from the Earth’s limb. We conducted a binned likelihood analysis method to fit the data across the entire time interval. We used the standard templates iso_P8R3_SOURCE_V3_v1.txt and gll_iem_v07.fits as the isotropic background model and Galactic diffuse-emission model, respectivelyFootnote c. We included all
 $\gamma$
-ray sources within a circular region of 20 degree radius from the central point in the fitting process, and their spectral characteristics were adopted from fourth Fermi Large Area Telescope (4FGL) catalogue. The parameters of all sources within the ROI were left as free variables, whereas those of sources outside the ROI were set to their catalogue values. To evaluate the significance of detecting each source within the ROI, we employed the test statistic (TS), defined as TS=2
 $\log (\mathcal{L})$
, where
 $\mathcal{L}$
represents the likelihood parameter of the analysis. We froze the spectral parameters of all sources with TS
 $ \lt $
25. The resulting output file was used as the input sky model for the unbinned likelihood analysis, which was then employed to determine the
 $\gamma$
-ray flux and spectral index for the 2-day time bins that were simultaneous with Swift observations. We opted for the PowerLaw2 function to model the
 $\gamma$
-ray spectrum of S5 0716+714 within each selected time bin, as it provided a good fit for these short time intervals. We started with the ‘DRMNFB’ optimiser, and sources with a TS value less than 9 were removed when they did not converge during the fitting process. Furthermore, for sources with TS values between 9 and 25, all parameters except the normalisation were held constant. The obtained fits were then optimised using the ‘Newminuit’. The
 $\gamma$
-ray spectrum of the source in the 4FGL catalogue is described by a log-parabola model. In order to determine whether there is a significant curvature in the
 $\gamma$
-ray spectrum within the selected time bins, we computed the test statistics for both power-law (TS
 $_{\textrm{pl}}$
) and log-parabola (TS
 $_{\textrm{lp}}$
) functions. The significance of spectral curvature (TS
 $_{\textrm{c}}$
) is then calculated as TS
 $_{\textrm{c}}$
= TS
 $_{\textrm{lp}}$
- TS
 $_{\textrm{pl}}$
. The best-fit parameters along with the TS values are provided in Table 4. A significant spectral curvature will result in a large positive value for TS
 $_{\textrm{c}}$
. Further, we produced a 3-day binned light curve for the entire period (till MJD 59975), and the obtained fluxes and indices were then used for the flux and index distribution study (Section 3.4).
3. Multi-wavelength analysis
The multi-wavelength light curve of the source S5 0716+714 from April 2005 to January 2023 (MJD 53461–59975) is shown in Fig. 1. The approximate average flux values estimated in optical/UV (2–7 eV), X-ray (0.3–10 keV) and
 $\gamma$
-ray (0.1–300 GeV) are
 $1.16\times10^{-10} \, \textrm{erg cm}^{-2} \textrm{s}^{-1}$
,
 $2.12\times10^{-11} \, \textrm{erg cm}^{-2} \textrm{s}^{-1}$
, and
 $2.24\times10^{-7} \, \textrm{ph cm}^{-2} \textrm{s}^{-1}$
, respectively. In Fig. 2, the spectral indices in the respective waveband are plotted against time in MJD. The average photon spectral index in the optical/UV and X-ray bands
 $\sim$
2.22, while that in
 $\gamma$
-ray is
 $\sim$
2.09. Figs. 1 and 2 clearly show that the source exhibits significant fluctuation in flux and spectral indices across all energy bands.
The spectral indices corresponding to the observations shown in Fig. 1. Top panel shows the
 $\gamma$
-ray index (
 $\alpha_{\gamma}$
) for 3-day binned data and the second panel is for 2-day binned data simultaneous with Swift observations, third panel is for X-ray (
 $\alpha_{\textrm{X}}$
), and fouth panel is for optical/UV (
 $\alpha_{\textrm{O/UV}}$
). The open circles in magenta colour are log-parabola index at 1 keV corresponding to the observations fitted by log-parabola model. The dashed blue lines represent the average spectral index in each energy bands.

3.1. Flux-index correlation
The scatter plots of the integrated fluxes in optical/UV, X-ray, and
 $\gamma$
-ray energies with their corresponding photon indices
 $\alpha_{\textrm{O/UV}},\alpha_{\textrm{X}}\, \textrm{and} \, \alpha_{\gamma}$
, respectively, are shown in Fig. 3. We observe a significant negative correlation between the optical/UV flux and
 $\alpha_{\textrm{O/UV}}$
. A Spearman rank correlation study between these quantities yield a correlation coefficient,
 $r=-0.66$
with a null hypothesis probability,
 $p \lt 0.0001$
. This negative correlation suggests a harder when brighter behaviour. Whereas, a mild positive correlation is observed between the X-ray flux in the 0.3–10 keV range and
 $\alpha_{\textrm{X}}$
(
 $r=0.38$
,
 $p \lt 0.0001$
), which implies a softer when brighter behaviour of the source. These correlation results are consistent with the broadband SED of the blazar shifting towards blue end during flux enhancement as shown in Fig. 6. The spread of
 $\alpha_{\textrm{X}}$
around 2 suggests the presence of both steep synchrotron and hard inverse Compton components in the X-ray band. Also, the number of observations with
 $\alpha_{\textrm{X}}$
 $ \gt $
2 is high compared to those with
 $\alpha_{\textrm{X}}$
 $ \lt $
2, suggesting that the synchrotron spectral component often dominates in this energy range (Fig. 6). The observed softer when brighter trend may then indicate a shift of the spectrum to high energies during flux enhancement (bluer when brighter) (Giommi et al. Reference Giommi1999). Similar behaviour of the source in the X-ray region was also reported in earlier studies by measuring the hardness ratio (Giommi et al. Reference Giommi1999; Zhang Reference Zhang2010; Wierzcholska & Siejkowski Reference Wierzcholska and Siejkowski2015). In the
 $\gamma$
-ray region, we did not find any significant correlation between flux and
 $\alpha_{\gamma}$
(
 $r=-0.001$
,
 $p=0.987$
). However, Geng et al. (Reference Geng2020) reported a significant spectral hardening of the
 $\gamma$
-ray spectrum with an increase in flux during certain outbursts. The absence of such a correlation over a long period, regardless of the flux states, could also suggest that the source displays either softer or harder when brighter behaviour during different flaring events. Alternatively, the presence of a peak or a break in the
 $\gamma$
-ray energy region can destroy the possible correlation. The latter inference is further asserted by the distribution of the
 $\gamma$
-ray spectral index around 2 (bottom panel of Fig. 3).
Scatter plots of the fluxes and indices in optical/UV, X-ray and
 $\gamma$
-ray energies. The upper left panel is for optical/UV, the upper right is for X-ray (data points in orange colour filled circles correspond to the X-ray observations with log-parabola model), the lower left is for
 $\gamma$
-ray in the 0.1–300 GeV energy range for 2-day binned data simultaneous with Swift observations, and the lower right is for 3-day binned
 $\gamma$
-ray data for the entire epoch. The red and blue coloured lines represent the flux-index relation in each energy-band with the variation in Lorentz factor and magnetic field, respectively. The shaded regions represent the maximum attainable flux at a viewing angle of
 $\theta$
= 2 degrees in each energy band (see Section 4).

Scatter plots between fluxes in optical/UV, X-ray and
 $\gamma$
-ray energies. The upper panel is for optical/UV (2–7 eV) and X-ray (0.3–10 keV), the lower left is for optical/UV (2–7 eV) and
 $\gamma$
-ray (0.1–300 GeV), and the lower right is for X-ray (0.3–10 keV) and
 $\gamma$
-ray (0.1–300 GeV). Data points in violet colour filled circles correspond to the X-ray observations with the log-parabola model. The red and blue colour lines represent the flux-flux relation with the variation in Lorentz factor and magnetic field, respectively.

Scatter plots between the spectral indices. The upper panel is for optical/UV (
 $\alpha_{\textrm{O/UV}}$
) and X-ray (
 $\alpha_{\textrm{X}}$
)(filled triangles in dark-grey colour and filled inverted triangles in dark-yellow colour represent the observations with low and high X-ray fluxes, respectively), the lower left is for optical/UV (
 $\alpha_{\textrm{O/UV}}$
) and
 $\gamma$
-ray (
 $\alpha_{\gamma}$
), and the lower right is for X-ray (
 $\alpha_{\textrm{X}}$
) and
 $\gamma$
-ray (
 $\alpha_{\gamma}$
). The red and blue coloured lines represent the index-index relation with variation in Lorentz factor and magnetic field, respectively.

3.2. Flux-Flux correlation
The scatter plots between the integrated fluxes of optical/UV, X-ray, and
 $\gamma$
-ray energies are shown in Fig. 4. A significant positive correlation is observed between the X-ray flux and optical/UV flux, with
 $r=0.74$
and
 $p \lt 0.0001$
, whereas a moderate correlation is observed between the X-ray and
 $\gamma$
-ray flux (
 $r=0.42$
,
 $p \lt 0.0001$
). A moderate correlation is also observed between the optical/UV and
 $\gamma$
-ray fluxes (
 $r=0.49$
,
 $p \lt 0.0001$
). The latter correlation was also reported before, though it was performed for short time periods (Larionov et al. Reference Larionov2013; Reference RaniRani et al. 2013b). This study identifies for the first time a strong correlation between optical/UV and X-ray flux over a long duration for the source S5 0716+714. These flux correlations are also consistent with the bluer when brighter behaviour of the source which can be visualised from Fig. 6. The correlations between the
 $\gamma$
-ray flux and the low-energy fluxes are often interpreted as supporting a leptonic origin for the
 $\gamma$
-rays, as the same electron population is responsible for both low-energy photons (through synchrotron processes) and high-energy photons (through inverse Compton processes). However, the observed correlations do not eliminate the possibility of hadronic models. Additionally, a correlation between hard X-ray and neutrino emission in blazars was reported recently (Plavin et al. Reference Plavin, Burenin, Kovalev, Lutovinov, Starobinsky, Troitsky and Zakharov2024). This, in turn, may suggest a possible correlation between low- and high-energy emissions. The observed correlations between the fluxes thus do not allow us to confirm the origin of
 $\gamma$
-ray emission mechanism.
3.3. Index-Index correlation
The scatter plots illustrating the relationships between the optical/UV, X-ray, and
 $\gamma$
-ray indices are presented in Fig. 5. In contrast to the positive correlation between X-ray and optical/UV fluxes, the X-ray index shows a significant negative correlation with the optical/UV index. The Spearman rank correlation analysis yielded a coefficient of
 $r=-0.69$
, with
 $p \lt 0.0001$
. On the other hand, a mild correlation is found between the optical/UV and the
 $\gamma$
-ray indices (
 $r=0.32$
,
 $p \lt 0.0001$
), while a mild negative correlation between the X-ray and
 $\gamma$
-ray indices (
 ${r=-0.32}$
,
 $p=0.0001$
). The observed anti-correlation between the optical/UV and X-ray indices may be associated with the harder when brighter behaviour in optical/UV and softer when brighter behaviour in the X-ray region. This is again consistent with the spectrum shifting towards the blue end during high flux states (Fig. 6).
To investigate whether the correlation between X-ray and optical/UV indices depends upon the flux state of the source, we repeated the study for those observations with X-ray flux above and below the average flux. Interestingly, we found that both these states support the negative correlation; however, it is more prominent for low-flux states, the correlation coefficient being
 $r=-0.72$
(
 $p \lt 0.0001$
) while that for the high flux states is
 $r=-0.42$
(
 $p \lt 0.0001$
).
The power-law fit to the optical/UV spectrum mostly results with index
 $\alpha_{\textrm{O/UV}}$
 $\gtrsim$
2. This indicates that the optical/UV emission mostly falls on the decaying part of the synchrotron spectral component. The X-ray spectral indices, on the other hand, have both cases with
 $\alpha_{\textrm{X}}$
 $ \lt $
2 and
 $\alpha_{\textrm{X}}$
 $ \gt $
2. This suggests that the X-ray energy region may fall either on the raising part of the Compton spectral component (
 $\alpha_{\textrm{X}}$
 $ \lt $
2) or decaying part of the synchrotron spectral component (
 $\alpha_{\textrm{X}}$
 $ \gt $
2). If we assume the underlying electron distribution responsible for the broadband emission as a broken power-law, then
 $\alpha_{\textrm{X}}$
 $ \gt $
2 maps the high energy end of the particle distribution, while
 $\alpha_{\textrm{X}}$
 $ \lt $
2 maps the low energy end of the particle distribution. Since the condition
 $\alpha_{\textrm{O/UV}}$
 $\gtrsim$
2 was true for majority of the observations, the optical region maps the particle distribution immediately after the break energy. In Fig. 5 (upper panel), we marked this region by vertical and horizontal dashed lines.
The correlation study between
 $\alpha_{\textrm{O/UV}}$
and
 $\alpha_{\textrm{X}}$
for those observation having
 $\alpha_{\textrm{X}}$
 $ \lt $
2, resulted in a moderate negative correlation with
 $r=-0.46$
(
 $p=0.001$
). This result is consistent with earlier study for the blazar Mkn 421 (Baheeja et al. Reference Baheeja, Sahayanathan, Rieger, Jagan and Ravikumar2022). Such a correlation strongly disagrees with the radiative loss origin of the broken power-law electron distribution (Kardashev Reference Kardashev1962; Rybicki & Lightman Reference Rybicki and Lightman1986). We also performed the
 $\alpha_{\textrm{O/UV}}$
–
 $\alpha_{\textrm{X}}$
correlation study for the observations with
 $\alpha_{\textrm{X}}$
 $ \gt $
2. Again we found a moderate negative correlation with
 $r=-0.49$
(
 $p \lt 0.0001$
). This observed correlation may possibly be associated with a shift in the spectrum towards blue or red side. For instance, shift towards the bluer end will harden the optical/UV index (optical/UV flux close to the peak) while softening the X-ray index (the X-ray flux falling at the synchrotron tail) as shown in Fig. 6.
Our correlation analysis suggests that the dominant spectral changes encountered during different flux states may be associated with the shift in the SED towards bluer/redder end. Interestingly, this also indicates the spectral variation in blazar due to the changes in the underlying electron distribution may not be substantial. We explore the possible scenario under which these correlation results can be inferred in Section 4. The correlation between different observed quantities are summarised in Table 5.
3.4. Distribution of fluxes and indices
A long term flux distribution study has the potential to understand the process responsible for the flux variations in blazars. Studies conducted on blazar light curves across different energy bands largely support a log-normal variability (Vaughan et al. Reference Vaughan, Edelson, Warwick and Uttley2003; Romoli et al. Reference Romoli, Chakraborty, Dorner, Taylor and Blank2018; Sinha et al. Reference Sinha, Khatoon, Misra, Sahayanathan, Mandal, Gogoi and Bhatt2018; Rieger Reference Rieger2019; Khatoon et al. Reference Khatoon, Shah, Misra and Gogoi2020). Such a variability can be associated with the moving perturbation in the accretion disc (multiplicative process) or a large ensemble of mini-jets buried with in the blazar jet (Narayan & Piran Reference Narayan and Piran2012). Alternatively, for a power-law spectrum, a log-normal variability in flux can be an outcome of normal variation in the photon index (Sinha et al. Reference Sinha, Khatoon, Misra, Sahayanathan, Mandal, Gogoi and Bhatt2018; Khatoon et al. Reference Khatoon, Shah, Misra and Gogoi2020). The flux distribution of certain blazar light curves also support a double log-normal behaviour (Sinha et al. Reference Sinha, Khatoon, Misra, Sahayanathan, Mandal, Gogoi and Bhatt2018; Khatoon et al. Reference Khatoon, Shah, Misra and Gogoi2020; Thekkoth et al. Reference Thekkoth, Sahayanathan, Shah, Paliya and Ravikumar2023).
To investigate the behaviour of the flux and spectral variability, we performed Anderson-Darling (AD) tests on the logarithm of fluxes and the spectral indices (Press et al. Reference Press, Teukolsky, Vetterling and Flannery1992). Under the AD test, the deviation of a given distribution from normality is prominent when the test statistics exceed a critical value. In Table 6, we present the details of the AD test for spectral indices and the logarithm of fluxes, with critical values calculated at a 5% significance level for the null hypothesis. From the AD test, we find that only the optical/UV and X-ray index distributions satisfy the normal behaviour, while the distributions of the logarithm of fluxes in optical/UV, X-ray, and
 $\gamma$
-ray energies, as well as the
 $\gamma$
-ray index are inconclusive.
We extended the study on the distribution of indices and the logarithm of fluxes by analysing the corresponding histograms. These histograms were first fitted using a single Gaussian probability density function (PDF) defined as
 \begin{align} {f(x)} = \frac{a}{\sqrt{2\pi \sigma^2}} \,\,\textrm{exp}\left[- \frac{(x-\mu)^2}{2\sigma^2}\right]\end{align}
where, a is the normalisation factor,
 $\mu$
and
 $\sigma$
are the mean and standard deviation of the distribution, respectively. In case of poor fit statistics, the fitting is repeated with a double Gaussian PDF given by
 \begin{align} g(x) =& \frac{a}{\sqrt{2\pi \sigma_1^2}}\,\, \textrm{exp}\left[-\frac{(x-\mu_1)^2}{2\sigma_1^2}\right] \nonumber \\ +& \frac{1-a}{\sqrt{2\pi \sigma_2^2}}\,\, \textrm{exp}\left[-\frac{(x-\mu_2)^2}{2\sigma_2^2} \right]\end{align}
where,
 $\mu_1$
and
 $\mu_2$
are the means of the distribution with standard deviations
 $\sigma_1$
and
 $\sigma_2$
, respectively. The histograms of the logarithm of fluxes and indices along with the best-fit PDF are shown in Fig. 7. The parameters obtained from the fitting are provided in Table 7. Contrary to the AD test, we find the histogram of the logarithm of optical/UV fluxes can be well-fitted with a single Gaussian PDF with reduced chi-square,
 $\chi_{red}^2$
= 1.14. A plausible reason for this can be the non-availability of high flux states that govern the tail of the distribution and which is evident from the histogram (top left panel of Fig. 7). Since the AD test is sensitive to the tails of the distribution, the test results are inconclusive. The distributions of optical/UV and X-ray spectral indices, on the other hand, support a single Gaussian PDF with
 $\chi_{red}^2$
values 0.82 and 0.90, respectively. This is consistent with the conclusion drawn from the AD test. Nevertheless, if the results obtained from the histogram analysis were correct then we could extend our inference that the log-normal variabitly of the optical/UV fluxes may be associated with the normal variations in the spectral index.
The shift of the SED towards the bluer end as the source becomes brighter is demonstrated. The hardening of the optical spectrum and the steepening of the X-ray spectrum are associated with the blue shift.

A single Gaussian PDF did not provide a satisfactory fit to the histogram of logarithm of X-ray fluxes (
 $\chi_{red}^2$
= 1.99). Instead, the double Gaussian PDF was able to provide a better fit (
 $\chi_{red}^2$
= 1.47). The double Gaussian behaviour of the logarithm of X-ray fluxes may be associated with the presence of two emission processes (synchrotron and SSC) active at this energy band. However, such a feature does not appear in the index distribution. Extending this study to hard X-rays (with predominant emission from SSC process) can probably provide a better answer to this unusual behaviour. At the
 $\gamma$
-ray energies, the histograms of both indices and the logarithm of fluxes deviate from a Gaussian nature but can closely represent a double Gaussian PDF. The best fit reduced chi-squares obtained for a double Gaussian fit to indices and fluxes being 1.83 and 1.42, respectively. These fit results are better than the ones obtained for a single Gaussian fit (5.33 and 2.82, respectively). This is consistent with the conclusion drawn from the AD test as well.
3.5. Broadband spectral energy distribution
To examine the broadband emission mechanisms responsible for the optical/UV–X-ray–
 $\gamma$
-ray emissions from S5 0716+714, we fitted the observed SED using synchrotron, SSC and EC processes. We considered only those epochs for which NuSTAR observations were available. Among the selected epochs, X-ray and gamma-ray flux during MJD 57045–57048 is large compared to the epoch MJD 59640–59699. To model the broadband SED, we considered the emission region to be a spherical blob of radius R and embedded with a tangled magnetic field B. The emission region is assumed to be populated homogeneously by a broken power-law electron distribution of the form
 \begin{align} n(\gamma)\,d\gamma = K\times\left\{ \begin{array}{ll} \left(\frac{\gamma}{\gamma_b}\right)^{-p}\,d\gamma&\textrm{for}\quad \mbox {$\gamma_\textrm{min} \lt \gamma \lt \gamma_b$} \\ \left(\frac{\gamma}{\gamma_b}\right)^{-q}\,d\gamma&\textrm{for}\quad \mbox {$\gamma_b \lt \gamma \lt \gamma_\textrm{ max}$} \end{array}\quad {{\textrm{cm}}}^{-3} \right.\end{align}
where, p and q are the low and high energy indices, respectively, of the broken power-law electron distribution,
 $\gamma_b$
the break energy with K the corresponding number density, and
 $\gamma_\textrm{min}$
and
 $\gamma_\textrm{max}$
are the available minimum and maximum electron energies, respectively. The emission region moves down the blazar jet at relativistic speed with a bulk Lorentz factor
 $\Gamma$
at a viewing angle
 $\theta$
. The electron distribution undergoes energy losses through synchrotron, SSC, and EC processes. The source of external radiation field considered is the thermal IR photons from the dusty torus (EC/IR) at temperature
 $T\sim 1000$
K (Ghisellini & Tavecchio Reference Ghisellini and Tavecchio2009; Bła˙zejowski et al. 2000).
Spearman correlations coefficient (
 $r_s$
) and null hypothesis probability (p) of various relations among fluxes and indices.

Anderson Darling test results of index/flux distributions in optical/UV, X-ray and
 $\gamma$
-ray bands.

The observed synchrotron flux, after accounting for the relativistic and cosmological effects, can be estimated from the single particle emissivity (
 $f_s$
), following Rybicki & Lightman (Reference Rybicki and Lightman1986) as
 \begin{align} F_{syn}(\nu)=\frac{4\pi\delta^3(1+z)}{3d_L^2} R^3 \frac{\sqrt{3} e^3 B}{16m_ec^2} \int_{\gamma_\textrm{min}}^{\gamma_\textrm{max}} f_s(\nu/ \kappa\gamma^2)n(\gamma)d\gamma,\end{align}
where,
 $\delta\, ([\Gamma(1-\beta_\Gamma\, \textrm{cos} \theta)]^{-1})$
is the jet Doppler factor, z the redshift of the source and
 $d_L$
the luminosity distance. The quantity
 $\kappa$
is given by
 \begin{align}\kappa = \frac{ 3 e \delta B }{16 m_e c (1+z)} \nonumber\end{align}
The observed SSC flux can be estimated (Blumenthal & Gould Reference Blumenthal and Gould1970; Sahayanathan, Sinha, & Misra Reference Sahayanathan, Sinha and Misra2018) as
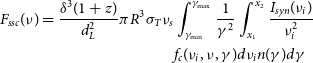 \begin{align} \begin{split} F_{ssc}(\nu) =\frac{\delta^3(1+z)}{d_L^2} \pi R^3 \sigma_T \nu_s & \int_{\gamma_\textrm{min}}^{\gamma_\textrm{max}} \frac{1}{\gamma^2} \int_{x_1}^{x_2} \frac{I_{syn}(\nu_i)}{\nu_i^2} \\& f_c(\nu_i, \nu, \gamma) d\nu_i n(\gamma)d\gamma \end{split} \end{align}
where,
 $\nu_s$
is the frequency of the scattered photon,
 $I_{syn}(\nu_i)$
is the synchrotron intensity at photon frequency
 $\nu_i$
, and the limits
 $x_1$
and
 $x_2$
decide the maximum and minimum frequency, respectively, of the synchrotron photons involved in the scattering process (Blumenthal & Gould Reference Blumenthal and Gould1970; Jones Reference Jones1968)
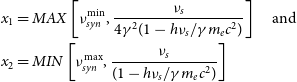 \begin{align} x_1&= MAX \left[\nu_{syn}^\textrm{min}, \frac{ \nu_s}{4\gamma^2(1-h\nu_s/\gamma m_ec^2)}\right] \quad \textrm{and} \nonumber \\ x_2&= MIN \left[\nu_{syn}^\textrm{max},\frac{\nu_s}{(1-h \nu_s/\gamma m_e c^2)}\right] \nonumber\end{align}
The emissivity function
 $f_c$
given by
 \begin{equation}f_c(\nu_i, \nu, \gamma)= 2r\log r+ (1+2r)(1-r)+\frac{\zeta^2r^2(1-r)}{2(1+\zeta r)} \nonumber\end{equation}
with
 \begin{align} r=\frac{\nu_s}{4\nu_i\gamma^2(1- h \nu_s/\gamma m_ec^2)} \nonumber\end{align}
and
 \begin{align}\zeta=\frac{4 h \nu_i\gamma}{ m_e c^2}\end{align}
For
 $\Gamma\gg1$
, the observed EC flux can be obtained as (Dermer & Schlickeiser Reference Dermer and Schlickeiser1993; Dermer & Menon Reference Dermer and Menon2009; Finke Reference Finke2016)
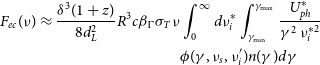 \begin{equation} \begin{split} F_{ec}(\nu) \approx \frac{\delta^3(1+z)}{8d_L^2} R^3c \beta_{\Gamma} \sigma_T \nu & \int_{0}^{\infty} d\nu_i^* \int_{\gamma_\textrm{min}}^{\gamma_\textrm{max}} \frac{U_{ph}^*}{\gamma^2 \,\nu_i^{*2}} \\ & \phi(\gamma,\nu_s, \nu_i') n(\gamma)d\gamma \end{split}\end{equation}
where,
 $U_{ ph}^*$
is target photon energy density at frequency
 $\nu_i^*$
measured in the rest frame of the AGN. The emissivity function
 $\phi$
is given by
 \begin{align} \phi(\gamma,\nu_s, \nu_i') =\left[y+\frac{1}{y}+\frac{\nu_s^2}{\gamma^2\nu_i'^2y^2}- \frac{2 \nu_s}{\gamma\nu_i'y}\right]\end{align}
with
 \begin{align} y=1-\frac{ h\nu_s}{\gamma m_ec^2} \nonumber\end{align}
Histograms of logarithmic flux (left) and index (right) in optical/UV (top panel), X-ray (middle panel) and
 $\gamma$
-ray (bottom panel) spectra of S5 0716+714. The solid red and orange curves represent the best-fit single Gaussian function and double Gaussian function, respectively, and dotted curves represent the two components of double Gaussian function.

Best fit parameter values of the probability density functions fitted to the logarithm of flux and spectral indices in optical/UV, X-ray, and
 $\gamma$
-ray.

The broadband spectral fit is performed by coupling the numerical routines used for calculating the observed fluxes due to synchrotron, SSC, and EC processes with the statistical spectral fitting code XSPEC. The main parameters governing the observed broadband SED of the source are K,
 $\gamma_\textrm{b}$
, p, q, B, R,
 $\Gamma$
,
 $\theta$
,
 $\gamma_\textrm{min}$
,
 $\gamma_\textrm{max}$
and the energy density of the external target photon field
 $U_{ph}^*$
. However, due to the limited information available in the narrow optical/UV, X-ray, and
 $\gamma$
-ray energy bands, all these parameters cannot be simultaneously constrained. Nevertheless, additional constraints are imposed in the form of near equipartition between the non-thermal particle and magnetic field energy densities. We defined the equipartition parameter
 $\eta$
as the ratio of magnetic field energy density (
 $U_m$
) to electron energy density (
 $U_e$
). The initial fit was performed for the low-flux state by letting the parameters p, q,
 $\gamma_b$
, B,
 $\Gamma$
,
 $\eta$
, and
 $U_{ph}^*$
as free, while the parameters
 $\gamma_\textrm{min}$
,
 $\gamma_\textrm{max}$
,
 $\theta$
, and R were fixed at values 10,
 $10^6$
, 1.3 deg (see Section 4), and 4
 $\times$
1016 cm, respectively. However, the confidence intervals on the fit parameters were obtained only for p, q,
 $\gamma_b$
,
 $\Gamma$
, and B while the rest of the parameters were frozen to their best fit values. We found that the broadband SED of S5 0716+714 can be fitted reasonably well by considering synchrotron, SSC, and EC/IR processes and the corresponding source parameters are provided in Table 8. The model fit to the observed fluxes along with the residuals are shown in upper panel of Fig. 8.
Best fit values of the model parameters from broadband SED fitting.

We repeated the fitting for the high-flux state with the parameters corresponding to the low-flux state set as an initial guess. The fitting was performed only on the parameters p, q,
 $\gamma_b$
, B,
 $\Gamma$
, and
 $U_{ph}^*$
and the best-fit model parameters are provided in Table 8. The model fit to the observed fluxes, along with the residuals are shown in lower panel of Fig. 8. Interestingly, we find the flux enhancement is predominatly associated with an increase in
 $\Gamma$
which will blue-shift the spectrum. Hence this result is consistent with our correlation study; however, the absence of low energy information (infrared) and the plausible degeneracy among the source parameters does not let us assert this conclusion. Further, the increase in
 $\Gamma$
did not cause a significant shift in the peak frequencies of the synchrotron and EC spectral component due to minor reduction in B and
 $\gamma_b$
during the high flux states.
4. Discussion
The broadband non-thermal spectrum of the blazar S5 0716+714 can be modelled assuming synchrotron and inverse Compton emission processes. The narrow band spectra in optical/UV, X-rays, and
 $\gamma$
-rays show extreme flux and spectral variations. The broadband spectral modelling of the simultaneous multi-wavelength observations during selected flux states provided hints about the plausible reasons for these spectral variations. However, a strong consensus regarding the origin of these variations is not possible. A detailed study of the long-term spectral variations of the source in different wavelengths has the potential to shed more light on the physics behind these spectral variations.
The upper panel shows broadband SED fitting of S5 0716+714 during the epoch MJD 59640–59699 (low-flux state) and the lower panel is for the epoch MJD 57045–57048 (high-flux state). Left panel: The unfolded spectrum with residuals obtained from XSPEC fitting. Right panel: Synchrotron, SSC, and EC/IR components are represented by dashed curve, dotted curve, and dashed dotted curve, respectively. The solid red curve represents the sum of the three components.

The broadband SED fitting of S5 0716+714 during the epoch 59640–59699 MJD (low-flux state) with viewing angle,
 $\theta = 2$
degree. The labels are same as that of Fig. 8.

In an attempt to understand this, we performed detailed statistical and spectral studies of the blazar S5 0716+714 using its long-term observations in optical/UV, X-ray, and
 $\gamma$
-ray. Our studies suggest that the source shows significant harder when brighter behaviour in the optical/UV band and a mild softer when brighter behaviour in the X-ray band. This behaviour can be interpreted as an outcome of the broadband spectrum following a bluer when brighter trend, as shown in Fig. 6. The plausible physical scenarios of the source that can initiate such a behaviour are: (1) an increase in the jet Lorentz factor, and (2) an amplification of the magnetic field in the emission region. The latter scenario primarily affects the synchrotron and SSC components of the SED and may not have much effect on the EC. However, the variation in the SSC component can also lead to changes in the total Compton spectral component, and hence the behaviour of the broadband SED under this condition is worth investigating. Since the jet is aligned to the observer at a small angle
 $\theta$
, the blue/red shift and the flux amplification will be governed by the Doppler factor
 $\delta$
rather than the Lorentz factor
 $\Gamma$
alone. Therefore, the viewing angle will also affect the shift and amplification in the spectrum. Hence, we performed this study using different values of
 $\theta$
(2, 1.8, 1.6, 1.4, and 1.3 degrees). The broadband spectral modelling of the source supports the first scenario mentioned above; however, a firm conclusion cannot be drawn by just reproducing the SED corresponding to two different flux states. Additionally, the variation in the rest of the source parameters (Table 8) did not result in a significant blue shift of the SED during the high flux state.
To investigate these two scenarios that can imitate the bluer when brighter behaviour of the source, we selected the best-fit model spectrum corresponding to the period MJD 59640–59699 (low flux state) as a template SED and study the integrated fluxes at energies 2–7 eV, 0.3–10 keV, and 0.1–300 GeV. The study is performed by varying either
 $\Gamma$
or B while freezing the rest of the parameters to their best-fit values. The average spectral indices are used for optical/UV and X-ray spectra, while for
 $\gamma$
-ray, the spectral slope at 1 GeV is considered. The range of variation in this parameter (
 $\Gamma$
or B) is selected such that they can reproduce the observed maximum and minimum integrated fluxes (Fig. 3). Interestingly, this also imposes constraints on the jet viewing angle when the spectral variations are attributed to changes in the jet Lorentz factor alone. Since the Doppler factor for a given
 $\Gamma$
peaks only at a certain value of
 $\theta$
, we find that the maximum observed flux can be obtained only when
 $\theta \lt 1.4$
degrees, irrespective of the choice of
 $\Gamma$
. In Fig. 3, we marked the maximum integrated flux in each energy band obtainable for different choices of
 $\theta$
as red dotted lines. Remarkably, this constraint on
 $\theta$
cannot be obtained by broadband spectral fitting of the source using synchrotron, SSC, and EC emission processes. In Fig. 9, we show that the best-fit SED for
 $\theta = 2$
degrees, and in Table 9, we provide the best-fit parameters. Although the fit results in a
 $\chi_{red}^2$
= 1.81, it fails to reproduce the maximum integrated fluxes (the shaded regions in each plot of Fig. 3 represent the maximum attainable flux in different energy bands with
 $\theta = 2$
degrees).
Best fit values of the model parameters from broadband SED fitting for the epoch MJD 59640–59699 with
 $\theta$
= 2 degree.

For both the scenarios considered here (variation in
 $\Gamma$
or B), the optical flux indicates a decreasing trend with its index, which is consistent with the observations (top left of Fig. 3). However, the mild positive correlation observed between the X-ray flux and the indices is consistant with variation in
 $\Gamma$
and not with B variation (top right of Fig. 3). In the
 $\gamma$
-ray band, variation in B predicts a mild positive trend between the flux and index, while
 $\Gamma$
variation predicts a mild negative trend. However, the observed data do not support any such correlations. It is also possible that the correlation is not visible in the data due to variations in other source parameters. The observed positive correlations between optical/UV, X-ray, and
 $\gamma$
-ray fluxes are consistent with the variations in
 $\Gamma$
or B (Fig. 4). Interestingly, the
 $\Gamma$
variation predicts a negative correlation between the optical/UV and the X-ray spectral indices (top panel of Fig. 5). This is strongly supported by the observations, whereas the trend predicted by B variation is opposite. The moderate positive correlation observed between the
 $\gamma$
-ray and optical/UV indices is again supported only by the
 $\Gamma$
variation. The mild negative correlation observed between the
 $\gamma$
-ray and the X-ray spectral indices is supported under both scenarios. Hence, by comparing the correlation between the observed quantities with the trends predicted by the variations in B and
 $\Gamma$
, we can conclude that the bluer when brighter behaviour of the source during different flux states is predominantly associated with the variation in the bulk Lorentz factor of the blazar jet. Our results obtained through the multi-wavelength data is also consistent with the narrow band optical study performed by Gorbachev et al. (Reference Gorbachev, Butuzova, Sergeev, Nazarov and Zhovtan2022). We find that in many cases, the curves representing the trend between observed quantities show a moderate shift from a majority of the data points. This shift can be due to the choice of the template SED and can be reduced by modifying the base parameters.
Our study on flux and index distributions suggest that the index variation follows a normal behaviour, whereas the fluxes follow a log-normal one. This can again be consistent with the bluer when brighter behaviour of the source. During high flux states, the spectrum shifts toward the bluer end, and hence the spectral index measured at a given energy band will vary normally. This normal variation in the index can result in log-normal variation in the flux. This interpretation differs from the earlier reported ones where the normal variation in the indices are treated as a result of the fluctuation in the acceleration process (Sinha et al. Reference Sinha, Khatoon, Misra, Sahayanathan, Mandal, Gogoi and Bhatt2018; Khatoon et al. Reference Khatoon, Shah, Misra and Gogoi2020). Again, the observed bluer when brighter trend of the broadband SED cannot be easily comprehended with the effects of the underlying acceleration process. Our interpretation based on the
 $\Gamma$
variation cannot explain the presence of double normal
 $\gamma$
-ray index distribution and double log-normal
 $\gamma$
-ray and X-ray flux distributions.
5. Summary
We have performed a detailed long-term study of the blazar S5 0716+714, spanning the period from April 2005 to January 2023, in optical/UV, X-ray, and
 $\gamma$
-ray wavelengths using Swift-UVOT/XRT and Fermi-LAT observations. The spectra in each waveband were fitted with a power-law/log-parabola model, and the correlation between the long-term variations in flux and spectral indices were examined. Our result indicates:
-
• A significant anti-correlation between flux and spectral index in the optical/UV range.
-
• A mild positive correlation between flux and index in the X-ray energy band.
-
• A significant correlation between the fluxes at optical/UV, X-ray, and
 $\gamma$
-ray energies.
-
• The X-ray and optical/UV indices are anti-correlated.
-
• A mild correlation between optical/UV and
$\gamma$
-ray indices. -
• A mild anti-correlation between X-ray and
$\gamma$
-ray indices.


The present correlation study cannot validate between the leptonic or hadronic origin of the
 $\gamma$
-ray emission. However, the bluer when brighter behaviour of the source may suggest a variation in the Lorentz factor. We also studied the distribution of fluxes and indices in these energy bands and found the following:
-
• The optical/UV fluxes followed a log-normal variability.
-
• The X-ray and the
$\gamma$
-ray fluxes indicate a double log-normal variability. -
• The optical/UV and X-ray index distributions support a normal behaviour.
-
• The
$\gamma$
-ray index distribution suggests a double normal behaviour.


Our study suggests that the log-normal flux variability of the source may be associated with a normal variations in the spectral indices. When combined with our correlation study, the bluer when brighter trend of the source results in normal variations in the optical/UV, X-ray, and
 $\gamma$
-ray indices, which in turn produce log-normal variability in the fluxes (Fig. 6). The limited information available did not allow us to draw conclusions on the double normal/double log-normal behaviour of the indices/fluxes.
We also studied the broadband spectral energy distribution for two different flux states during which simultaneous observations by NuSTAR were available. The broadband spectra can be well fitted using synchrotron, SSC, and EC processes during both states. The
 $\gamma$
-ray emission can be explained by the EC scattering of infrared photons from the dust torus. Our spectral fitting results suggest that the flux enhancement of the source is primarily linked to an increase in the bulk Lorentz factor of the blazar jet. The increase in the bulk Lorentz factor of the jet can also be a plausible reason for the bluer when brighter trend of the source. This was further confirmed by varying the bulk Lorentz factor of the low flux state SED (template SED) and comparing the results with the correlation studies. However, the wide spread in the data around the model curve suggests that different flux states may be associated with variations in parameters besides the Lorentz factor. This procedure also allows us to draw constraints on the jet viewing angle as
 $\theta \lesssim 1.4$
degrees, though this estimate depends on the choice of the template SED considered.
The statistical and spectral analysis of the blazar S5 0716+714 leads us to conclude that the variability of the source is predominantly associated with changes in the bulk Lorentz factor of the jet. This study can be extended to other blazars to draw a global picture regarding AGN variability. The blazar emission zone falls within a few Schwarzschild radii (
 $\sim$
parsecs) of the central black hole, which cannot be resolved through radio interferometry studies. The ejection of superluminal knots from the jets of radio galaxies also supports the variations in the jet Lorentz factor, but at a length scale much farther away from the blazar emission zone (D’arcangelo et al. Reference D’arcangelo2009; Jorstad et al. Reference Jorstad2017; Kun et al. Reference Kun, Britzen, Frey, Gabányi and Gergely2023).
Supplementary material
The supplementary material for this article can be found at https://doi.org/10.1017/pasa.2024.106
Acknowledgements
We gratefully acknowledge the anonymous referee for the valuable suggestions. This research has made use of data obtained from Fermi
 $\gamma$
-ray telescope Support centre and NASA’s High Energy Astrophysics Science Archive Research Center (HEASARC), a service of the Goddard Space Flight Center and the Smithsonian Astrophysical Observatory. CB wishes to thank CSIR, New Delhi (09/043(0198)/2018-EMR-I) for financial support. CB is thankful to UGC-SAP and FIST 2 (SR/FIST/PS1-159/2010) (DST, Government of India) for the research facilities in the Department of Physics, University of Calicut.
Data availability statement
The data underlying this paper are publicly available from the HEASARC archive at https://heasarc.gsfc.nasa.gov/ and https://Fermi.gsfc.nasa.gov/.



