Between 1650 and 1680 there was a revolution in naval warfare. The great battle fleets that were to dominate the age of sail were created; state navies replaced armed merchantmen with highly specialized warships; the line of battle was introduced; and the broadside became the dominant method of dispensing firepower. These developments were the product of a rapid maturation of the state as an organization of taxation and control, and led to state monopolization of force at sea. They also yielded a struggle at sea sufficiently intense and protracted to be labeled the “Second Hundred Years War.”Footnote 1 Despite massive naval investment by the French and Dutch in the late seventeenth century, and by the Spanish and French after 1720, Britain ultimately established itself as the undisputed ruler of the world's oceans—a position it maintained into the twentieth century.
The narrative history of this struggle has been well documented and ably told by naval historians.Footnote 2 Our intent is to supplement the literature in three ways. First, the existing historical narratives are qualitative in nature; we seek to quantify the process by which Britain took command of the ocean. Second, we hope to show that despite British setbacks (such as those suffered during the War of American Independence) the origins of the process that culminated in victory over Napoleon in 1815 can be traced to the First Dutch War 150 years before. Most importantly, we show that Britain's ultimate dominance at sea was the culmination of a long process of learning, one in which both experience and incentives played crucial roles.
We do not seek to rewrite British naval history. Nothing that follows denies the importance of the geographical, political, and financial forces that long have been central to the histories of this period. Indeed, as we shall make clear, many of the familiar themes, including Britain's island status and the backdrop of continental land wars, are essential to our story. We focus on the mechanism by which these larger forces manifested themselves in the outcomes of warfare at sea, and thus show in fairly precise terms the fundamental continuity of the underlying process.
The hallmark of the sea battles fought in the decades after 1650 was widespread carnage. Comprehensive casualty counts are not readily available, but casualties among commanding officers in the Royal Navy were reliably recorded, and they speak unequivocally. In a single engagement, the Four Days' Battle in June 1666, 10 Royal Navy post-captains died in combat; this was nearly 8 percent of all English post-captains afloat at the time.Footnote 3 During the two wars with the Dutch in the 1660s and 1670s, more than 60 English post-captains were killed in action, a time when there were an average of but 114 rated ships in the English navy. Published battle narratives plus the limited casualty data available in published sources suggest that the butcher's bill on the quarterdeck had its counterpart between decks.Footnote 4
There are many reasons for the high casualty rates of these years, including the close quarters of the North Sea and the English Channel, where the key battles took place, and the fact that the English and Dutch were eager to stand and fight. We argue that one other factor was at work. Between 1650 and 1680, firepower became concentrated as never before, and delivered by ships built to administer and withstand more punishment than ever before. Commanders erred often in dispensing this firepower and avoiding its adverse consequences, mistakes that proved fatal for them and their crews. The result was high casualty rates. As tactics were learned and improved, fewer mistakes were made and casualties declined. Among British captains, who are the focus of our study, much of the learning took place rapidly, but it continued well into the eighteenth century. By the Great Wars of 1793–1815, although ships were at least twice as powerful as their predecessors of a century before, combat at sea was far less deadly for British captains: they had learned how to win—or lose—without killing nearly as many of themselves or their men.
The learning that reduced fatality rates among captains is also evident in the combat success of the Royal Navy. Over the 150 years covered by our study, the British navy markedly increased the losses it inflicted on enemy fleets, relative to the combat losses it suffered. And although the performance of the navy's command structure improved most rapidly in the first half of our sample, improvement continued throughout the period we study. The culminating triumph of the Napoleonic wars is thus traceable in the data back to the initial engagements of the first Anglo-Dutch war, more than 150 years before.
We focus on the British navy for two reasons. First, systematic data on battle outcomes during this period are of higher quality for it than for other navies—perhaps because Britain succeeded, and thus more avidly recorded its activities. Second, by 1815 no one doubted Britain's dominance at sea, yet in 1650 no one could have predicted that outcome. In quantifying the process by which Britain prevailed we also suggest factors we believe should be given more weight in discussions of this period. Specifically, we argue that the ability of British captains to transform experience into success stemmed from two key facts: the officers and men of the British navy had far more opportunity than enemy crews to develop their combat skills, and they were given unparalleled financial incentives to succeed. This combination of opportunity and motive thus helped fuel the Royal Navy's rise to greatness.
HISTORICAL PERSPECTIVE
The execution of King Charles on 30 January 1649 marked the culmination of the English Revolution and presaged the dawn of a new era in naval warfare. The Revolutionary government of England saw the navy as a means of solidifying its rule and accomplishing a variety of political and religious objectives. Mercantile interests were ardent backers of a stronger navy, for they sought a greater share of world trade, perhaps even the displacement of the Netherlands as the world's dominant carrier of goods at sea. The efforts of the new government and its mercantilist supporters led in passage of the Navigation Act of 1651, which helped precipitate the first Anglo-Dutch war of 1652/53.Footnote 5
The Dutch navy at this time consisted chiefly of cruisers, speedy vessels optimized for convoy escort duty and keeping open the sea lanes vital to trade. Most English vessels were comparably sized, but the English also had a small contingent of “great ships,” battleships optimized for firepower and the ability to withstand intense combat. Perhaps most crucially, the English discovered the line of battle, which was an effective defense against the Dutch melee tactics, and a devastating means of delivering concentrated firepower.Footnote 6 Despite unremitting willingness of the Dutch to fight, the English tactics and battleships tipped the balance, and the Battle of Scheveningen in 1653 sealed an English victory.
The war brought several lessons. Both sides relied heavily on armed merchantmen to supplement their state navies, standard practice at that time.Footnote 7 But in this war, the weaknesses of the armed merchant ships were painfully obvious: they were slower and less maneuverable than specialized warships, and too lightly armed and built to inflict or withstand intense firepower. Moreover, the small warships of the Dutch were no match for the English battleships. And finally, as the English demonstrated at Gabbard Shoals in 1653, the tactic of fighting in line-ahead—what was to become known as the line of battle—was an enormously effective means of concentrating firepower.
These lessons induced the Dutch to cut their reliance on armed merchant ships in favor of specialized warships, and to increase the number of battleships in their fleet. Meanwhile, political turmoil in England attenuated the English response to the war's lessons. Thus, by the onset of the second war in 1664, although both fleets were more powerful than in 1652, the Dutch were no longer at a substantial disadvantage. Most importantly, by the Four Days' Battle of June 1666 the Dutch finally concluded that the line of battle was superior to melee tactics. By the war's end in 1667, it was clear that specialized warships, headed by powerful battleships arrayed in the line of battle, were the future of naval warfare.Footnote 8
Mindful of these events, France was transforming its navy into a modern force, investing heavily in ships, particularly battleships, and creating a permanent officer corps and a series of permanent naval dockyards.Footnote 9 These developments in turn set the stage for Samuel Pepys's successful campaign to upgrade the British fleet through a large-scale building program.Footnote 10 On a smaller scale, Denmark-Norway and Sweden were also strengthening their state navies, both in number and average size of ships.
Widespread warfare in the 1670s put the new fleets and their tactics to the test, with England, France, and Sweden allied against Spain, Netherlands, and Denmark-Norway. The battles proved to be tactically indecisive, but they cemented the lessons of the first two Anglo-Dutch wars: Coordinated, concentrated firepower and the ability to withstand it were the keys to victory. By 1680 the major powers of Europe had established the character of the ships and tactics that dominated naval warfare for the next century and a half. It was a world that the captains of 1650 would have had trouble recognizing.
All of this had come at substantial cost. Aside from the resources devoted to the unprecedented ship-building programs, the battles of this era had been bloody and destructive. Numerous Dutch ships had been sunk in the first two Anglo-Dutch wars, an outcome routinely fatal for many of the crew. During the second Anglo-Dutch war of 1664–1667, more British post-captains were killed in combat than were to die in combat during all of the Great Wars of 1793–1815, and the carnage during the third Anglo-Dutch war of 1672/73 fully matched that of the years 1793–1815. How would the British commanders of the future put to work their ships, their tactics, and their knowledge of both during future wars?
THE COMBAT DECISION
Contact between hostile sailing vessels did not always result in combat. Except in conditions of greatly reduced visibility, vessels did not simply materialize next to one another. Instead, they sighted each other from a distance of several miles, well beyond the range of their cannons. For combat to occur, at least one commanding officer (admiral or commodore of a fleet or squadron, or captain of an individual vessel) had to choose it. Even this was only a necessary condition. If one commander demurred and was properly situated (e.g., to windward), even a determined effort by the other to engage might prove futile.
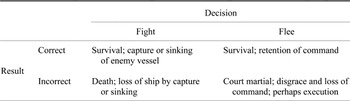
We characterize the combat decision of a commanding officer as a binary choice to “fight” or “flee.” We also treat the outcome as binary: either “correct” or “incorrect.” The 2 × 2 matrix in Table 1 summarizes this view. The entries in the interior are the consequences of the commanding officer's decision and whether it was correct. Thus, as shown in the northwest quadrant, the choice to fight, if correct, resulted in survival for the commanding officer and victory for his ship, squadron, or fleet. The other entries are to be interpreted similarly (see Appendix I for a more complete analysis).
THE OUTCOMES OF COMMAND DECISIONS

Notes:
See the text for discussion.
Clearly, there are potential ambiguities. A commander might “decide” to flee, yet be compelled to engage in combat by an enemy commander who chose to fight. What we observe is combat and its outcome, not the mental states of the participants, so we record an entry in the left column of the table. Similarly, the decision to fight could yield survival for the commanding officer, despite the loss of his ship, just as it could lead to his demise, despite victory for his ship or fleet (as in the famous case of Nelson at Trafalgar). In our empirical work, we thus treat the individual outcomes of decision-making (survival or death) separately from the tactical outcomes (victory or defeat).
In the early years of the revolution in naval warfare, commanders made numerous mistakes, fighting when they should have fled, and fleeing when they should have fought. But for those who survived, there was an opportunity to learn: from their own mistakes and those of their predecessors. Learning could even be institutional, as in the creation of Fighting Instructions, official documents that summarized the general principles according to which combat should be conducted. As knowledge accumulated, the error rate of commanders should have fallen. The result would be fewer combat fatalities and greater success in combat.
Another type of learning surely occurred during the century and a half covered by our data, namely a rise in the effective strength (combat ability) of a vessel or fleet of any given nominal strength. Indeed, historical accounts suggest that British commanders were sharpening those skills relevant once combat was imminent or underway. For example, improvements were clearly discernable in ship handling, gunnery, tactics, navigation, signaling, fleet command and control, and victualing and health.Footnote 11 In each case, the ability of British commanders to administer, concentrate, and avoid lethal firepower was enhanced. If such learning occurred at a rate faster than among Britain's enemies the result would be an increase in the relative strength of British ships, and growing British combat success.
LEARNING BY DOING
Productivity increases have been seen in some industries even absent explicit investment in physical or human capital. The explanation for such observations has been that as firms produce more goods they learn to improve the production process, i.e., there is accumulation of knowledge as a side effect of economic activity. Such knowledge accumulation is known as learning by doing.
Learning is the product of experience and takes place during or as a result of an activity.Footnote 12 The first explicit empirical work on learning by doing was by T. P. Wright, who observed that labor-hours necessary to produce an airframe was a decreasing function of the cumulative number of airframes produced in prior periods. Allan Searle investigated learning in the shipbuilding industry. Kenneth Arrow developed a theoretical model of the process, emphasizing that learning by doing is the product of experience, and is subject to sharply diminishing returns. Subsequent studies have elaborated on Arrow's model, and extended our empirical knowledge. Armen Alchian analyzed airframe production, and Leonard Rapping focused on shipbuilding; both used data from World War II. Paul David and Jeffrey Williamson assessed the extent of learning by doing in the American textile industry during the early nineteenth century. More recent papers by Byong-Hyong Bahk and Michael Gort and by Lanier Benkard have examined in more detail the empirical findings of earlier studies.Footnote 13
Learning by doing can be analyzed by assuming a production function as simple as the Cobb-Douglas, y t = AK tαL tβE tγ, where A is technology, y t is production at time t, K t is capital, L t is labor, and E t is a measure of experience. The most common measures of experience have been cumulative output, cumulative investment, or time elapsed since the beginning of the activity.Footnote 14
In examining learning by doing, it is possible to investigate how the firm obtains more output from given inputs or how it reduces the costs of producing a given output. In our case, the available data dictate the approach we take. The records of failure—captains who were killed in combat and ships that were either sunk or captured in combat—are available, so we use them. We think of the cost of production (combat) as being the loss of a captain or ship, and the experience that helps determine this cost as being the cumulative sum of such losses in the past. Thus, we view the captains of the Royal Navy as collectively learning from the past failures of their predecessors. Although individual captains surely did learn from their own experiences, the learning in which we are interested here took place over a great span of time (a century and a half) and was the product of the experiences of the thousands of Royal Navy captains who served over this period. That is, we view the captains of 1800 as benefiting from their own experience, and from the experience of the captains of 1740 and those of 1680. Some of this knowledge was passed along formally in the Fighting Instructions. But more importantly, it was accumulated and transmitted through the extraordinary mentoring and evaluation process of the Royal Navy, as we discuss below. In essence, the command structure of the navy, from Admiralty Board to midshipman, was organized to ensure that the necessary elements of success—and survival—were passed from one generation of commanders to the next.Footnote 15
COMBAT FATALITIES
Published data on total casualties are sporadic, even for the British navy during the well-documented wars of 1793–1815, so our focus is on two measures for which data are available—fatalities among captains and ships captured or sunk in action. Nevertheless, there are compelling reasons why our measures are informative and valuable. Warships were the most complex and costly pieces of capital extant during this period. The capture or sinking of one in combat was an important accomplishment for the victor and a serious loss for the vanquished. Successful captains were valuable instruments of war, and their skills arguably had the largest effects on the outcomes of battles. Given their exposed positions directing combat from the quarterdeck, captains had strong incentives to learn more effective means of combat, and we expect their learning—or lack thereof—to show up in their combat fatality rates.
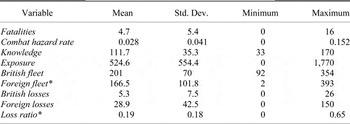
We argue that three factors determine combat fatalities among captains: their exposure to combat, the stock of knowledge possessed by them, and the intensity of the wars in which they fought. To construct fatalities we aggregate data on captains killed in action over five year periods, because reliable data on rated ships is available only at five year intervals, evenly divisible by five.Footnote 16 For a given year of ship data, fatalities are thus the combat fatalities during the five years centered on the year in question. As an alternative measure of the combat outcomes of captains we also examine the combat hazard rate among them, which we define as fatalities divided by the number of rated ships in the British fleet. Summary statistics on this and other key variables are shown in Table 2.
SUMMARY STATISTICS, 1670–1815 (N = 30)

* Foreign fleet and the ratio of British to combined British and foreign losses are defined only during time of war, so N = 22 for these variables.
Notes:
The minimum reported value of 2 for foreign fleet refers to the American fleet in 1775, prior to France's entry into the war.
Source:
See the text and Appendix 2.
The exposure of captains to combat is the product of the number of rated ships and the number of years of combat during the five years centering on each observation. When exposure to the hazards of war is higher, the number of captains killed in action should be higher, whether the added exposure is due to more ships in action, or to a longer period of war during the five year span of measurement.
The captains of 1690, we argue, knew more about modern combat techniques than did their predecessors who fought in the 1660s or 1670s. They were thus less likely to fight when they should flee, and hence less likely to errantly die in combat. They also knew better how to conduct their combat, and thus were more likely to be victorious over their enemies. As our measure of the growing stock of knowledge about modern combat, we compute the cumulative fatalities prior to the observation in question.Footnote 17
Not all wars are the same, and hard-fought wars are likely to produce more casualties. Measuring the intensity of combat is not easy, and we have tried several alternatives. The measure of intensity on which we have settled is, for each five year period, the log of the number of pages of combat descriptions in William Laird Clowes's seven-volume history of the Royal Navy. Although this measure is crude and imperfect, it is statistically superior to the other measures we have examined.Footnote 18 It also has conceptual reasons to recommend it. For example, more important battles are likely to be more fiercely contested and also are likely to be more closely examined and extensively written about by historians. Moreover, even if a protracted, intensive engagement turns out that way simply by chance, it is still likely to produce both more casualties and damage, and more material suitable for historical narrative.
Estimates
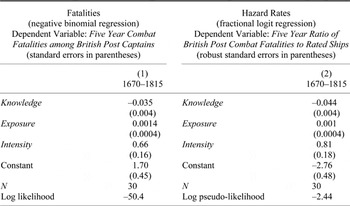
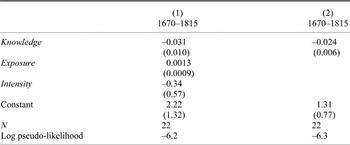
The data on captains killed in action are a classic example of count data. Like much count data, ours exhibit over-dispersion relative to a Poisson distribution, with a variance about six times the mean. To estimate the determinants of captains killed in action, fatalities, we thus use negative binomial (rather than Poisson) regression. The results are shown in column (1) of Table 3.Footnote 19 The signs of the estimated coefficients of exposure and knowledge are clearly consistent with the combat decision model: exposure to greater hazards led to higher fatalities, yet over time captains were building on the accumulated knowledge of their predecessors, so the fatalities associated with any given combat exposure were falling.Footnote 20 The estimated coefficient of intensity is also as one would expect: fatalities were higher in wars in which combat was more intense.Footnote 21
FATALITY AND HAZARD RATE ESTIMATES

Notes:
Estimates are substantively unaffected if linear, quadratic, or cubic functions of time are included in the regressions, or if estimates are performed for subsamples 1690–1815 or 1710–1815. See the text for discussion.
Source:
See the text and Appendix 2.
An alternative measure of the risks of combat is the hazard rate, defined as ratio of captains killed in each period to the number of rated ships in the British fleet during that period. Thus, in column (2) of Table 3, using fractional logit regression, we examine how the hazard rate was affected by knowledge, exposure, and intensity.Footnote 22 Again we see that exposure to more combat led to a higher hazard rate, yet over time the hazard rate was falling as captains built on the accumulated knowledge of their predecessors.Footnote 23
Knowledge is highly correlated with time (r = 0.97), so we have re-estimated the regressions in columns (1) and (2) with linear, quadratic, and cubic functions of time included. In each case, the estimated values of the coefficients of knowledge, intensity, and exposure are substantively unaffected, and the coefficients of these variables remain statistically significant at conventional levels (p < 0.05). In no case are any of the coefficients of the time variables statistically different from zero.Footnote 24
The high fatality rates of the early years of our sample account for an important component of the variance in the observed fatalities; indeed, 36 percent of the fatalities in our sample occur before 1680. We have therefore re-estimated the regressions in columns (1) and (2) excluding all of the seventeenth century data. Doing so has substantively no effect on the estimates of either equation. We infer that the early, high-fatality years of our sample were not fundamentally different from later years—except that captains initially had little knowledge of how to survive the rigors of modern combat, and so were much more likely to be killed for their efforts.Footnote 25
Empirical Implications
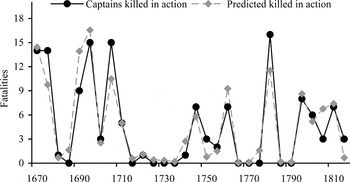
The regression results in column (1) enable us to predict the expected fatalities for each five year period, and thus compare these predictions with the observed data. Figure 1 shows the results of doing so. Despite the abrupt and large period-to-period swings in fatalities, it is evident that the estimated model closely tracks both the timing and magnitude of those changes.
ACTUAL AND PREDICTED COMBAT FATALITIES, 1670–1815

We can also use the estimates in column (1) to deduce the implied elasticities of fatalities with respect to knowledge, exposure, and intensity. These elasticities, evaluated at the sample means, are shown in Table 4. Although intensity and exposure each have only modest effects on fatalities, knowledge has quite a large impact. The importance of learning in determining fatalities can be confirmed by considering a simple counterfactual experiment: Ceteris paribus, if the captains of the Revolutionary and Napoleonic Wars (1793–1815) had possessed the same combat knowledge as their counterparts of 100 years before (1693–1715), how many would have died in combat? The answer is that instead of 27 being killed, 208 would have died.Footnote 26
IMPLIED ELASTICITIES OF FATALITIES WITH RESPECT TO KNOWLEDGE, EXPOSURE, AND INTENSITY

Notes:
Estimates are based on column (1), Table 3.
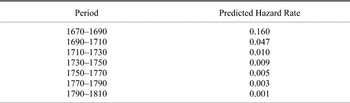
It is also useful to isolate the effects of learning on hazard rates over time. Using the estimates shown in column (2) of Table 3, we set the values of exposure and intensity equal to their means for our full sample, and predict hazard rates as a function of the varying stock of knowledge over the period. We average these predictions over each of the 20 year subperiods of our era. As the first row of Table 5 reveals, during the early years of our sample a post-captain had about a 16 percent chance of being killed in any five year time period in which exposure and intensity were at their means. As is apparent from the steep initial declines in the hazard rate, roughly 90 percent of the captains' learning took place during the first 60 years of our sample. Nevertheless, learning continued through the eighteenth century, albeit at a much slower rate. The last row of Table 5 reveals that by the Napoleonic War, the combat hazard rate for captains had fallen to about one chance in a thousand.Footnote 27
THE EFFECTS OF LEARNING ON HAZARD RATES, 1670–1810

Notes:
Hazard rates are obtained from column (2), Table 3, by setting intensity and exposure equal to their mean values and allowing knowledge to vary over time. For each 20 year block of time, the predicted five year hazard rates are averaged to yield the numbers shown here.
Source:
See the text.
THE OUTCOMES OF BATTLE
The results thus far must be tempered by two considerations. We cannot reliably observe instances in which captains correctly chose to flee in the face of a superior enemy force (the northeast quadrant of Table 1). If there were many such encounters for our period, then a declining fatality rate among captains would be of little value to the Crown. Moreover, aside from draws, every observable contact between two enemies results in a victory or defeat. Skillful, knowledgeable captains are more likely to survive even unsuccessful combat than are unskilled, ignorant captains, because able captains will refrain from errantly extending losing combat. Yet one of the two captains must lose, regardless of ability. When it comes to victories and losses, it is relative skill or ability that is important, and over time it is relative rates of learning that determine the ebb and flow of victories and losses. Even if British captains were learning—and learning rapidly—if their enemies (most notably the French) were learning even faster, combat fatality rates among British captains could be declining, even though they were losing more often.
Countering such a view is that this period of falling British fatalities culminated with record-low levels of combat hazard rates, and a crushing British victory at sea over her enemies—and a subsequent century of hegemony at sea. Indeed, M. A. J. Palmer characterizes the eighteenth century as a era in which the Royal Navy won “victory after victory.”Footnote 28 Still, it is useful to examine other evidence.
Victory at Sea
Most of the ships lost at sea during the age of sail were victims of adverse weather or navigational errors. As with combat fatalities, we focus here solely on losses that were the direct result of combat. As discussed in Appendix 2, there was little overlap between British ships lost in combat and combat fatalities among British captains, making combat ship losses a largely independent measure of the learning process.Footnote 29 For each five year period we sum the British post ships sunk or captured by the enemy, and for Britain's enemies we sum their ships of 20 guns or more sunk or captured in combat.Footnote 30 We then compute the loss ratio as British combat losses in combat divided by the total combat losses (British plus foreign), a number that can range from zero to one (see Table 2); hypotheses regarding the determinants of this ratio can be tested using fractional logit.
Although the theory implies that knowledge should reduce British losses relative to foreign losses, the theory is silent on whether exposure or intensity should affect this ratio, so we estimate the effects of knowledge both including and excluding these variables. The resulting fractional logit estimates are in Table 6, where we see that knowledge importantly enhanced British success in combat. Because neither intensity nor exposure have statistically significant effects on British success, we exclude them in column (2). The results are the same: as the knowledge of British captains grew, their success improved.
BRITISH COMBAT LOSSES AS A FRACTION OF TOTAL COMBAT LOSSES (fractional logit regressions) Dependent Variable: Ratio of British Losses to Combined Losses (robust standard errors in parentheses)

Notes:
Observations are weighted by total ships (British plus foreign) lost in combat.
Source:
See the text and Appendix 2.
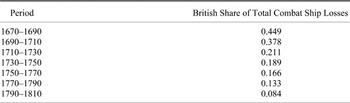
There are some noteworthy features of this measure of learning, highlighted in Table 7. The right hand column shows the predicted proportion of the ships lost in combat that would be British. Thus a number equal to 0.5 would imply that Britain would be expected to suffer losses equal to those she inflicted on her enemies, because half of all losses would be British ships. We see in the first row that during the early years of our period, England was in fact suffering almost the same number of ship losses as she was inflicting. By the 1710–1730 period, however, learning had brought Britain almost a four-to-one advantage in combat outcomes. By the Napoleonic War, Britain was inflicting losses more than ten times as great as she was suffering. If we compare these numbers with those in Table 5 showing fatality rates we see another feature. Although most of the decline in fatality rates comes during the first third of our period, the improvement in relative combat performance is spread more evenly over the entire period 1670 to 1810.
PREDICTED BRITISH SHARE OF COMBAT SHIP LOSSES, 1670–1810

Notes:
Predictions are based on estimates in column (2), Table 6, with the predicted British share of losses averaged for each 20 year period.
Source:
See the text.
Comparing Combat Losses
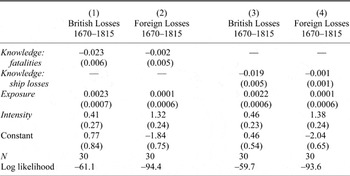
The results thus far are consistent with a process in which British captains were learning faster than their foreign counterparts. Here we separately investigate British losses and foreign losses, in an effort to refine our understanding of this process. We begin with a simple question: Does our measure of knowledge, which we claim reflects the state of knowledge among British captains, have an effect on foreign losses?Footnote 31 We then construct an alternative measure of knowledge, based on data that is available for both British and foreign fleets. Under both approaches, our dependent variable is the number of ships lost in combat (British or foreign), and our measures of exposure and intensity are the same, except that the measure of foreign exposure entails multiplying the size of foreign fleets by the duration of the war.
The dependent variables in Table 8 are the number of ships lost in combat by Britain (columns (1) and (3)) and by her enemies (columns (2) and (4)). In columns (1) and (2) our measure of knowledge is the lagged sum of fatalities among British captains, as it was in our estimates of combat fatalities. This measure has a large statistical and substantive impact on British losses, but effectively no impact on foreign losses, either numerically or statistically. Given our interpretation of this measure of British knowledge, this is not surprising, but it is reassuring.Footnote 32
COMBAT LOSSES OF RATED SHIPS (negative binomial regressions) Dependent Variable: Rated Ships Sunk or Captured in Battle (standard errors in parentheses)

Source:
See the text and Appendix 2.
Notes:
In columns (1) and (2) our measure of knowledge is the lagged sum of fatalities among British captains, as it was in our estimates of combat fatalities. In columns (3) and (4) our measure of knowledge is the lagged sum of past ships lost in combat—cumulative British losses in column (3) and cumulative foreign losses in column (4). See text for discussion.
In columns (3) and (4) knowledge is the lagged sum of past ships lost in combat—cumulative British losses in column (3) and cumulative foreign losses in column (4). Again, we see strong evidence of learning by doing in the British estimates: as knowledge accumulates over time, expected losses fall.Footnote 33 In sharp contrast, although there is a hint of learning among foreign commanders, the evidence is weak. The coefficient of knowledge in equation (4) is one-twentieth the magnitude found in equation (3), and although negative, it is not statistically different from zero at conventional levels. If we pool the data on ship losses for British and foreign, and estimate a combined ship-loss regression, allowing for clustering of residuals by year, we confirm the results of Table 8: the coefficient of knowledge is not statistically different from zero for foreign nations, while the coefficient of knowledge for Britain is negative and statistically different from zero and from the coefficient of knowledge for foreign nations: Britain was learning faster than her enemies.Footnote 34
We have examined two other approaches to foreign losses. The foreign nations we treat as Britain's enemies sometimes battled among themselves, engaged in warfare against other nations, and (as with the Anglo-Dutch alliance against the French in the 1690s) sometimes allied themselves with Britain. Potentially, they gained valuable knowledge in such endeavors, knowledge not reflected in the estimates of column (4) of Table 8. Hence, we have collected foreign ship losses from engagements other than those in which Britain was the foe.Footnote 35 Cumulating these with the losses suffered against Britain gives us an alternative and more comprehensive measure of the knowledge of foreign commanders. Nevertheless, even when we use this potentially superior measure in re-estimating equation (4) of Table 8, the results are substantively and statistically the same: there is essentially no evidence of learning on the part of foreign commanders.Footnote 36 We also have created a panel data set in which there are three comparison foreign fleets: French, Spanish, and “all other” enemies. The results are substantively identical to those reported in Table 8: Britain was learning, while her enemies were not.
THE INNOVATION PROCESS
Naval warfare is a complex endeavor and the 150 years covered by our study witnessed political, administrative, and logistical changes on a huge scale. We have developed important new quantitative measures of the progress of naval warfare over this period, and presented compelling evidence that Britain's success may be viewed as the proximate result of learning by doing over a long span of time. We cannot hope to illuminate every element of why Britain succeeded where her enemies did not. But we can suggest two key factors that have not received sufficient attention in the existing literature: opportunity and motive.
Opportunity
The British navy spent more time at war than did any of her enemies, and did so actively at sea, rather than bottled up in port by continental strategic considerations, inadequate finances, or enemy blockade. Year after year of convoy, patrol, blockade duty, and combat in all seasons enabled the commanders and sailors of the British fleet to master
the real essentials of naval tactics . . ., the well drilled line of battle and such flexibility as would enable advantage to be taken of any opportunities the enemy might offer.Footnote 37
The line of battle was both the supreme offensive and defensive weapon of the era; hence, it was prone to yield inconclusive encounters, particularly when one of the fleets was French, for a fundamental French strategy of much of the era was to avoid decisive combat.Footnote 38 As Admiral Sir John Jervis, writing when he was a post captain, remarked after the battle of Ushant in 1778:
. . . two fleets of equal force can never produce decisive events, unless they are equally determined to fight it out, or the commander-in-chief of one of them bitches it so as to misconduct his line.Footnote 39
In Jervis's view (shared by others) decisiveness required avoiding mistakes and capitalizing on the enemy's mistakes. The way to do both was practice and more practice: learning by doing.
The British were at war at sea during 77 of the 156 years between 1660 and 1815, some 20 percent more than France or Spain, and vastly more than any of her other enemies. Britain also enjoyed a relatively stable political system and a strong financial system, and her two chief opponents of the eighteenth century were hamstrung by other factors. Crucially, in all of the wars with Britain except the War of American Independence, the resources of the continental powers were drained by the necessity of fielding large land forces; conflict at sea was only part of a larger struggle. The realities of geography meant that island Britain could—indeed had to—focus much more of her resources on the sea. This not only meant a larger navy; it also meant a navy that spent much more of its time at sea.Footnote 40
Spain's position was complicated by the fact that it had let its navy sink into ruin during the seventeenth century. A concerted effort to rebuild during the eighteenth century brought the Spanish fleet much closer to parity with the British. Yet Spain suffered from chronic manning problems that sharply hampered her ability to bring an experienced, effective fighting force to bear against Britain.Footnote 41 France had enlarged and modernized its fleet late in the seventeenth century, and quickly adopted the line of battle, but financial exigencies in the 1690s caused it to redirect resources to the army; by 1720 the French navy was a shadow of its former self. A renewed French commitment to its navy, particularly after the debacle of the Seven Years War, finally bore fruit during the War of American Independence, when it was freed of the demands of large-scale continental conflict.Footnote 42 But French designs for parity were dashed early in the French Revolution, when the mostly aristocratic officers of the French navy were either chased out of the service or executed, eliminating much of that navy's collective experience.Footnote 43
Overall, Britain's advantage measured by years of combat thus understates the British edge in relevant experience, because financial, strategic, and manning considerations sharply cut the sea time of enemy fleets. In addition, the British navy did its best—with some success in the Seven Years War, and much more success from 1793 onwards—to keep enemy fleets bottled up in port. As John Creswell notes:
Here, in respect of experience, British admirals usually had advantages over their enemies. In the fifty years up to Trafalgar the British and French had been at war during twenty-three of them and during those years the British fleets had often been at sea for long periods while the enemy remained blockaded in Brest or Toulon even when they were more numerous than their blockaders.Footnote 44
Blockade duty, combined with the incessant requirements of patrol and convoy duty, took a tremendous toll, injuring and killing men and damaging ships; but it built the British navy into a formidable fighting machine, with “the self-confidence nurtured by long months at sea, often in foul weather.”Footnote 45 Crews became expert at handling their vessels and training for combat, while the squadrons and fleets were drilled into ruthless efficiency. The Spanish and French, meanwhile, were sitting at anchor. When battle was joined, the fight was between men and ships honed and hardened to the task at hand, against opponents who had barely gained their sea legs. The outcomes are clear in the data.Footnote 46
Motive
It is not obvious that a fleet long at sea would consistently win against a freshly provisioned fleet manned by well-rested crews.Footnote 47 Sea duty was hard on ships and men; a fleet emerging from port with well-maintained ships and fresh crews might have found—and defeated—worn-out ships and disgruntled sailors in the fleet long at sea. The genius of the British Navy in preventing this lay in an incentive system that supplied its officers and men with the motivation needed to outperform their foes. Footnote 48
Officers and men of the Royal Navy received pay from two sources. During both war and peace, they were paid monthly wages that were highly skewed by rank and, except at the very lowest ranks, higher on larger ships. During war, wages were supplemented with a prize system in which rewards included the economic value of enemy vessels captured, and “head money” paid for the capture or death of sailors aboard enemy warships. Prize earnings were even more sharply skewed than wages. For example, although a captain's wages averaged perhaps 20 times that of an able bodied seaman, a captain's share of prize money was typically more than 200 times the share going to a seaman.Footnote 49
Benjamin and Christopher Thornberg have shown that the shipboard organization of the lower deck of the Royal Navy in the age of sail usefully may be thought of as a hierarchical tournament: Noncommissioned officers competed for promotions that brought sharply higher wages and larger prize shares. Tom Wareham makes clear there was also a tournament among commissioned officers, in which superior performance yielded promotion, which in turn led to opportunities for substantially higher income.Footnote 50
All authorities agree that patronage was essential to the promotion system of the Royal Navy.Footnote 51 But one must recognize its meaning in this context. It is normal today to think in terms of political patronage, in which individuals are granted choice positions because they have politically powerful allies. Such “interest” (as it was called) was no stranger to the Royal Navy. Indeed, during the 1650s, loyalty to the new Republic was essential, and this was reflected in Cromwell's choice of captains.Footnote 52 But as early as the 1660s, the casualties of the first Anglo-Dutch war made it possible for command openings to be filled with men who had distinguished themselves in action. The growing professionalism of the navy was enhanced by Charles II's 1677 decision to require candidates for lieutenant not merely to pass an examination in seamanship conducted by senior officers, but to have served at least three years at sea, including one as a midshipman, before being allowed to stand for the exam.
Notwithstanding some well-publicized exceptions, during the height of Britain's success in the age of sail, political patronage played a role chiefly in speeding (rather than creating) promotions. Even more important, when it came to command, the Admiralty was zealous in ensuring that only naval patronage—that is, the influence of superior officers—was relied upon.Footnote 53
An essential ingredient in the promotion process was the certification of officers as being prepared for advancement and command. Crucially, the certifying senior officers put their own reputations on the line. If the officers they recommended did not live up to expectations, their future recommendations were heavily discounted by the Admiralty. Because the best men were drawn to serve under those officers who could further their careers, loss of credibility with the Admiralty could seriously hamper the subsequent career of the senior officer in question.Footnote 54
Quite apart from honor and pride, there were large financial stakes involved when men made promotion recommendations or decisions. Success in battle—and thus prize money—depended on the quality of the men one commanded. At each critical stage in the evaluation and recommendation process, the decision-makers had compelling self-interests to ensure that the best men were promoted and given command responsibility.
Successful command was substantively the only way that a commoner could expect to rise in British society. And time at sea was the only way a man could earn prize money. Over the years 1793–1815, captains could expect to earn prize money two to five times greater than their monthly wages.Footnote 55 But—and this is critical—it was command of a vessel or squadron that offered the promise of riches, not merely rank, and command was given only in the expectation of superior performance.Footnote 56 Long-term retention of command was heavily dependent on a captain's continued performance in accomplishing the specific objectives of the Crown.Footnote 57 Captains who performed well were rewarded with prize money, honors, and the continued command necessary to ensure future prize money and honors. Those who did not were returned to the shore and half pay. For island Britain, survival was possible only by victory at sea, and all elements of the Royal Navy's organization and incentives were structured accordingly.Footnote 58
CONCLUSIONS AND IMPLICATIONS
When Spain's 1796 declaration of war forced the Royal Navy to withdraw from the Mediterranean, the notion that Britain soon would crush her adversaries would have seemed wishful thinking, even to the eternally optimistic Nelson. Yet less than 20 years later, victory was so complete that Britain's worldwide dominance at sea went unchallenged for a century. If our evidence is correct, the gloom of 1796 was unwarranted in the historical context that preceded it.
The Royal Navy did not win every battle in which it engaged during the modern age of combat sail, and its performance during the War of American Independence was less than spectacular. Moreover, in the waning years of the Napoleonic Wars, losing engagements with the radical new American super-frigates (such as the Constitution) gave British commanders pause. Yet the final resolution of the “Second Hundred Years War” was no fluke. It was instead the cumulative effect of decades of experience, hard-won in the crucible of combat.
Over the years from 1660 to 1815—spanning the height of modern combat under sail—commanders in the British navy learned how to fight and win, one engagement at a time, one war at a time. As British commanders learned from their past mistakes, their combat fatality rate declined dramatically, on such a sustained basis that between 1660 and 1815 it fell 98 percent. Moreover, this learning manifested itself in other measures of combat performance: British combat losses relative to the losses they inflicted on their enemies declined by 80 percent.
These developments were no accident. Britain was compelled by its insular status to devise successful strategies for combat at sea. This entailed keeping ships at sea, on convoy, patrol, and blockade duty. Meanwhile, enemy fleets were bottled up by financial and strategic considerations of their own—and eventually by British blockade. The combination enabled British crews to hone their skills, even as the enemy's were atrophying. But what made this tactic possible was the other element of British strategy—a compensation and promotion system that gave commander and crewman alike the incentive to behave as though he were the King himself. Driven by the demands of nearly incessant warfare, and encouraged by organizational supremacy and financial incentives, British commanders outperformed their enemy counterparts because in learning by doing they accumulated a stock of combat knowledge that made them the best in the world.
Appendix I: Types of Learning
Learning When to Fight
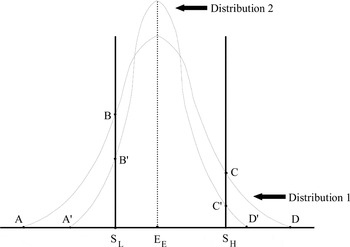
The implications of learning can be seen with the aid of Appendix Figure 1. Consider a commander with a force of known fighting strength S i, where i = L, H, and the value L indicates low strength and H indicates high strength. Suppose his estimate of the enemy's fighting strength is characterized by distribution 1, with expected value E E and variance σ 12. Also assume the following:
1 the decision to fight is solely that of this commander;
2 the commander fights if he believes he is stronger than the enemy (Si > EE) and flees otherwise;
3 a commander wins if he fights and Si > EA (where EA, the actual strength of the enemy, is not shown in the figure) and is disgraced if he flees and Si > EA.
ACTUAL BRITISH STRENGTH (IS) AND THE DISTRIBUTION OF EXPECTED ENEMY STRENGTH (E)

A commander with a relatively low level of strength, S L, will clearly flee, because S L < E E; in doing so, he accepts the probability of disgrace shown by the area ABS L. A commander with a high level of strength, S H, facing the same expected enemy force would fight, because S H > E E. In doing so, he faces a probability of defeat given by CDS H, because this is the probability that the enemy will in fact be stronger than S H.
In this context we assume that learning causes a mean-preserving reduction (to σ 22) in the variance of the commander's estimate of enemy strength. Thus, learning is shown by the shift from distribution 1 to distribution 2. A better-informed commander with strength S L who flees will bear a reduced probability of disgrace (A′ B′ S L < ABS L). Similarly, a more knowledgeable commander of strength S H who fights will bear a reduced probability of defeat, given by C′ D′ S H < CDS H.
Because knowledge reduces the probability of defeat, two key predictions follow. First, as commanders learned, their combat fatality rate (and, presumably, that of the men who served under them) should have declined. Second, as combat knowledge was accumulated, British losses (vessels sunk or captured by the enemy) should have declined relative to the losses inflicted on the enemy.Footnote 59
The preceding discussion treats the decision to fight as that of the British commander alone. Clearly, there could be cases where British and enemy commanders would have to “concur” before combat could commence.Footnote 60 If both commanders had unbiased beliefs about their opponents' strengths, and if both followed a decision rule of only fighting when they judged themselves superior to their opponent, then no combat would have occurred. But in the age of sail, the windward ship (or fleet) generally had the de facto option to fight or not. British commanders sought and most often achieved the windward advantage over their opponents, implying British commanders generally made the decision whether and when to engage combat.Footnote 61 Hence, our characterization of the combat decision as one made by British commanders is likely to be a good approximation of the circumstances in which we test our theory.
There is an interesting implication of this behavior of British commanders. Given our presumed decision rule, a commander in the windward position chooses to fight only if S i > E E. Assuming commanders' expectations were unbiased, British commanders would win more than half the time, even if a randomly selected British ship or fleet were no better than a randomly selected enemy ship or fleet. This “selection bias” in the outcomes of battles likely accounts for some of the observed advantage of the windward position in combat under sail; moreover, because the British most often sought and obtained the weather gage, the observed performance of British ships in combat was an upward-biased measure of the combat effectiveness of a randomly selected British ship.
Learning How to Fight
There is another type of learning that surely took place during the period of our data, and that is a rise in the average combat ability (effective strength) of a vessel or fleet of any given nominal strength. Indeed, historical accounts suggest that British commanders were sharpening those skills that were relevant once combat was imminent or underway, and the main text offers specific examples of such learning.
If such learning occurred faster than among Britain's enemies, this would have raised the strength of British ships relative to the enemy's. In terms of Appendix Figure 1, S i would move to the right relative to the distribution of E. Several implications follow. First, for encounters in which a British ship previously would have fought (S i > E E), a rise in strength increased the probability of British victory: the area between E E and S i rises. Second, a rise in the effective strength of British ships implies that some encounters for which S i < E E prior to learning now have S i > E E. Hence, British ships should have become more aggressive, choosing to fight more often, and choosing to fight ships (or fleets) that were increasingly powerful relative to their own nominal strength. Third, the Admiralty should have raised the standard to which British captains were held: for encounters in which S i < E E, a rise in S i due to learning would have produced a higher probability of disgrace in the event of flight.
Learning without Choice
The discussion in the text supposes that British commanders unilaterally decided whether to fight. How did learning affect outcomes when enemy commanders made this choice? In such cases the British commander's expectations were irrelevant; all that mattered was the strength of the British commander's force relative to the actual strength of the enemy. If S i > E A, the British won; if the inequality was reversed, so too was the outcome.
Any British ship (or fleet) of actual strength S i could be expected to encounter some distribution of enemy vessels, whose commanders would have expectations regarding the strength of the British. We let S i* represent the expected strength of the British, as perceived by the enemy. We assume that enemy estimates of British strength are unbiased, i.e., that E(S i) = S i*, but we also recognize that some British ships (50 percent if the distribution is symmetric) will turn out to be stronger than anticipated by the enemy. If enemy ships follow the rule of fighting only when their strength is greater than the expected strength of their British opponent, then all enemy ships weaker than S i* will decline to fight. Remaining enemy ships will fight and expect to win, but not all of them will in fact win, because half of their British opponents will turn out to be stronger than anticipated.
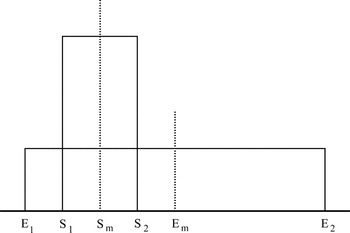
As the British become stronger over time due to learning, they will win an increasing proportion of the battles in which they are engaged, even though the enemy are aware of Britain's growing strength and are altering their behavior accordingly. This result is most easily seen in Appendix Figure 2, under the assumption that enemy strength is distributed uniformly over the range from E 1 to E 2, with a mean of E m. The strength of a British opponent, as perceived by the enemy, is distributed over the range from S 1 to S 2, with a mean of S m. Given that the enemy declines to engage if its strength is less than S m, the only foreign ships that fight will have strengths ranging from S m up to E 2. Overlap of British strength over enemy strength (and thus British victory) occurs with probability P b = (S 2 – S m) / (E 2 – S m). We assume that when British strength increases, the entire distribution of S shifts up, implying that both S 2 and S m change. Given this assumption, the marginal effect of a change in British strength is given by

Thus, as the British grew stronger, they would win an increasing proportion of the battles in which they were engaged, even thought the enemy was quite sensibly declining a growing proportion of the opportunities for engagement.
DISTRIBUTIONS OF ACTUAL ENEMY STRENGTH (E) AND EXPECTED BRITISH STRENGTH (S)

Appendix 2: Data Sources
David Syrett and R. L. DiNardo track careers of commissioned officers of the Royal Navy. In addition to recording dates of commission and promotion, they record those officers killed in combat, including the dates on which these men were killed. There are four commissioned ranks: admiral (including vice admiral and rear admiral), post-captain, commander, and lieutenant. We focus exclusively on fatalities among post-captains, because it is possible to measure their potential combat exposure with the greatest precision. For the years 1660–1815, some 173 British post-captains died in combat, an average of about one per year. In most years, none were killed; in the most lethal year (1666), 16 were killed in action, ten of them in the same battle.Footnote 62
Post-captains commanded “rated” ships, which for most of our period were ships carrying 20 or more cannons (referred to as guns). These ships were grouped into six rates, the largest of which, the first rates, carried at least 100 guns; the smallest of the rated ships, the sixth rates, carried 20 to 28 guns. The standard source on the size of the British fleet, and the fleets of its enemies, is Jan Glete, who records this information at five year intervals, in years evenly divisible by five.Footnote 63 As shown in Table 2 of the text, the fleet of rated British ships—and thus the number of British captains and ships who might have been subjected to combat—averaged 201 during our sample period, ranging from a low of 92 in 1670 to a high of 354 in 1810. On average, the British fleet grew at a rate of about 0.7 percent per year during our period (t = 11.1), rising sharply during war and declining during peace.
David Hepper records dates of combat between Britain and her various enemies during the years of our study.Footnote 64 Britain was at war for 77 of the 156 years between 1660 and 1815. Historical accounts suggest that these wars differed in their intensity, which we take into account as noted in the text.
Losses of British ships are summarized by Hepper, whose data we cross-checked with that of Clowes, being careful to distinguish combat losses from the far more numerous losses due to storm, navigational error, or other accidents.Footnote 65 We examine losses of rated ships, because the data are most reliable, and these ships were commanded by post-captains. There was only about 20 percent overlap between British ships lost in combat and combat fatalities among British captains, so combat losses of ships provides a largely independent measure of the process of learning in the Royal Navy.Footnote 66 Finally, Clowes has compiled combat vessel losses (captured or sunk) for nations engaged in combat with Britain, and we have extracted these for all ships of 20 or more guns. Again, Glete enables us to determine fleet sizes for the various combatant navies, albeit with some imprecision, a matter discussed in the text.Footnote 67