Studies of changes in the social bases underlying political divisions in contemporary democracies have been more successful at description than explanation. Even this is qualified by continued controversy over measurement and specification in the assessment of class, party choice and patterns of change over time. Current opinion would seem to indicate, however, that social class, typically the most commonly used indicator of social position, is no longer as closely linked with party choice as it used to be. Moreover, this linkage has demonstrated pronounced decline in those countries where its presence was historically greatest, such as Norway, Sweden and, of course, Britain, which has been the site of the most intense academic disputes over this issue. In the 1960s it was generally agreed that class was ‘pre-eminent among the factors used to explain party allegiance in Britain’.Footnote 1 Since then class has lost much of its ability to condition electoral behaviour, so that even proponents of the ‘trendless fluctuation’ interpretation of class voting patterns, advocated by Heath et al. in the 1980sFootnote 2 and taken to characterize the period from the 1960s to the early 1990s,Footnote 3 concede that by the late 1990s there had indeed been a decline.Footnote 4 The issue is not yet resolved, and the primary focus of this article is why this decline has occurred.
Specifying models of cleavage change
Models of cleavage change can be summarized as of two kinds. The dominant perspective starts from the assumption that political cleavages are shaped from the ‘bottom up’, with political divisions along occupational, religious, ethnic or linguistic lines influencing interests, values and party preferences. The decline of the class basis of politics is usually thought to derive from processes of economic development leading to the emergence of a less structured society. This has been attributed to rising living standards and the spread of affluence through the class structure, the changing gender composition of occupations, the growth of alternative social bases of interests that cross-cut class position such as private–public distinctions, increasing home ownership, the expansion of mass higher education and increased social mobility.Footnote 5 Sometimes it is also argued that these changes reflect a generic process of individualization endemic in modern societies that weakens the effect not only of class position, but of all traditional, group-based sources of identity and political preferences.Footnote 6 These ideas share the assumption that the fracturing of class distinctiveness is the source of changes in the relationship between class position and party choice. Classes are no longer monolithic sources of identity and interests; they are cross-cut by other influences and have in consequence lost their distinctiveness as sources of political preferences. As a result, ‘Few individuals now possess exclusively middle-class or working class social characteristics, and the degree of class overlap is increasing over time’.Footnote 7 This we term the ‘class heterogeneity’ model.
The class heterogeneity model is predicated on the assumption that classes are losing their distinctiveness, and that the class structure is fracturing as multiple influences on political orientations cross-cut classes and provide alternative sources of party support. It is the current orthodoxy in the study of British political behaviour. Thus Political Choice in Britain begins with an illustrative story of a hypothetical 1950s welder and his (customer services manager) granddaughter, whose ‘world lacks the social and economic certainty and cohesion that characterized her grandfather's life’, having ‘grown up in a world where … class boundaries have become increasingly fluid; where alternative lifestyles have abounded’.Footnote 8 After presenting evidence that there has been a decline in voting differences between manual workers and non-manual workers Clarke et al. conclude that: ‘At the end of the twentieth century class had come to play a very limited role in determining the voting preferences of the British electorate.’Footnote 9 In this respect the current authors of the British Election Study echo the interpretations of observers from earlier periods such as Butler and Kavanagh,Footnote 10 with their notion of a ‘loosening’ of the social structure, and Rose and McAllister, who refer to the ‘opening up of the electorate’,Footnote 11 in assuming that classes, particularly the working class, have lost their social cohesion and distinctiveness.
The second perspective emphasizes the ‘top down’ structuring of cleavages by the actions of parties. In this ‘political choice’ model, the extent of social divisions to political preferences derives from the actions of political parties and their strategic positioning. This view has influential advocates; for Przeworski: ‘individual voting behaviour is an effect of the activities of political parties.’Footnote 12 More precisely, the relative salience of class as a determinant of voting behaviour is a cumulative consequence of strategies pursued by political parties of the left so that ‘efforts by left-wing parties to find electoral support profoundly undermine the salience of class as a cause of individual voting’.Footnote 13 Parties influence the extent of social divisions by differentiating themselves in ways that are relevant to the choices of voters on relevant axes of competition or, conversely, minimizing their differences on these axes so that they are less relevant to party preference. The agent of change is political rather than social. However, strategic shifts in party positions are themselves assumed to be conditioned at least in part by changes in social structural composition – particularly the decline in the size of the manual working class – as de-industrialization and globalization have transformed the industrial societies of the 1960s into post-industrial societies with an associated expansion of the service sector.Footnote 14 This process of ‘structural transformation’ does not imply the blurring of social divisions, as in the class heterogeneity model, but only that classes have changed their sizes. As a result, the logic of political appeals made by parties, particularly those of the left, has changed as ‘confronted by either a shrinking base of core voters … parties are obliged to develop new responses and new strategies’.Footnote 15 In general then, the logic of median voter competition and ‘catch all’ strategies in conjunction with changes in the class structure provides grounds for expecting political convergence resulting from shifts to the ideological centre by parties of the left as a result of the decline in the size of the working class.
In Britain, the Labour party's move to the centre in the last two decades on issues that have traditionally divided the classes has put this question into sharp focus. Surprisingly, there is little systematic empirical research into how parties perceive the changing electoral environment and how they react to these changes,Footnote 16 but there is evidence of strategic manœuvring by both Labour and the Conservatives.Footnote 17 Extensive evidence collected by the Comparative Manifesto Project (CMP),Footnote 18 which has placed parties on a left–right dimension for each election in the post-war era, likewise depicts a pattern of convergence as ‘New’ Labour followed several other West European parties of the left down the road to centrist social democracy.Footnote 19 The momentum for this shift came from four consecutive election defeats for the Labour party, though its deeper origins lie arguably in the changing shape of the social structure that made a parliamentary majority derived from a working-class base far less likely than it would have been only twenty years previously. Far from being the representative of the working class, this transformation has recast Labour as a ‘catch-all’ party.Footnote 20 In doing so, it can be expected to have weakened the ideological distinctiveness of the signals sent to the electorate by the two main parties, which, in the context of a growth in electoral responsiveness, may have in turn weakened the link between social class and party choice.
Mechanisms linking class to party choice
Clearly the two accounts described above provide very different ways of understanding the relationship between social and political change. The task in this article is to discern which most accurately describes the British case. How do we disentangle their implications and provide appropriate tests?
The first issue to consider is the models of individual party choice underpinning these competing accounts. In the relevant literature these have not always been explicitly stated. The voter, it was typically assumed in the earlier British literature on class dealignment, was one for whom voting was an expressive act of the voter's social group allegiance and thus vulnerable to any breakdown in the intergenerational transmission of partisan identification as a result of the social changes described above. However, as the decline of party identification and the breakdown of the post-war consensus in the 1970s ushered in a period of more intense competition for votes,Footnote 21 the model was updated. Ideological polarization in conjunction with higher levels of education, media consumption and attendant ‘cognitive mobilization’ sensitized voters to their interests and in turn increased the impact of issues and ideology on electoral outcomes,Footnote 22 so that this revised version of the class heterogeneity model became recognizable as a form of instrumental voting.
The political choice model also emphasizes instrumental and responsive voters. Drawing on ideas of spatial voting, people are assumed to support a party when they perceive a difference between the platforms of the main parties and believe their vote will make a difference in terms of which party wins. For voters to respond to parties’ programmatic positions, there must be meaningful differences between parties. For these to then translate into class differences in party preference, there must be differences between classes in preferences for more or less redistributive political programmes. This seems reasonable, as class position is associated with inequality of current resources and future prospects, which shape voters’ perceptions of their interests. The final condition of this supply–demand relationship is that voters respond to party signals. If party preferences are purely the expression of identity or socialized affective attachments, then ideological positions would not impact on voters’ choices.
The basic premise on the supply side – that parties need to diverge on matters of relevance to people in different classes to generate class differences in party preferences – is not new. Even in the 1950s, Converse reasoned that if parties do not take distinct positions on questions relating to class, voters will be unable to use their class position as a guide for voting.Footnote 23 Nonetheless, the increases in electoral responsiveness in the 1970s noted above, in which party choice became more instrumental and less an expression of partisan loyalty, should have served to increase the significance of class-based responsiveness to parties’ ideological signals as a mechanism linking class position to party choice.
Typically the growth of a responsive electorate has been pitted against the idea that class position matters for party preference. With the emergence of issue attentiveness ‘voters begin to choose’ and are no longer locked into a class-dictated pattern of voting.Footnote 24 Yet there is no reason to assume that a responsive electorate is inconsistent with substantial class differences in party preference. Instrumental class voting was, for example, a key theme of the influential ‘Affluent Worker’ project, in which this form of class political allegiance was identified as the defining characteristic of the emerging affluent working class of the period,Footnote 25 and the degree to which this characterizes the motivation underlying class support for parties is likely to have increased as issue voting has become a more significant influence on parties’ electoral fortunes.
In summary, voter responsiveness to party polarization and the extent to which this drives changes in class-based preferences depends both upon the choices voters are offered (the supply side) and the class distribution of ideological preferences (the demand side), as well as the degree to which voters are responsive rather than passive. Without parties emphasizing choices that have differential appeal to responsive voters in different class positions, class is much less likely to be associated with party preference. Shifts to centralist ideological platforms weaken the signals relating to divergent ideological orientations derived from class differences in resources, and weaken class differences in political choices.
Improving upon previous attempts at testing explanations of cleavage change
Although most debates in the class voting literature have focused on measurement issues in the estimation of trends,Footnote 26 arguably the primary deficiency in previous research into the consequences of increasing class heterogeneity is that the blurring and fracturing of class boundaries have usually been inferred from an observed decline in the class–party association, rather than being measured independently and then used to account for such declines. Recent studies emphasizing political choice explanations of class voting have also not included the key explanatory construct: they do not measure what it is about party behaviour that influences cleavage strength.Footnote 27 They have instead relied on evidence concerning the volatility and abruptness of changes in the class–vote association to indicate the likelihood that changes in association can be seen as political rather than social in origin. Thus, social change is assumed to be relatively gradualist and uni-directional, whereas political change is considered to take a more discrete form, traceable to political events, especially changes in party strategies and the emergence of new parties who shape the focus of political debates and interest representation. In this view, changes in the association between social structure and voting would be unlikely to follow a gradual decline, instead showing abrupt patterns of change that include increases as well as decreases in the strength of the class–party association. These sorts of tests have provided preliminary indications of the viability of the political choice model. Nonetheless, it is not clear which level of change is to count as a ‘discontinuity’, nor which level of volatility is consistent with the political choice model versus the class heterogeneity model. Indeed, identifying meaningful change versus trendless fluctuation has proven an area of heated debate.Footnote 28 A further limitation of these tests is the limited set of independent variables employed in models of vote or party preference. In contrast to earlier work,Footnote 29 it has not been customary to include statistical controls in the empirical analyses.Footnote 30 Even when care is taken to measure ideological divisions as sources of change in the class–party association, this has not been accompanied by tests of the relative importance of this form of explanation versus others.Footnote 31
Therefore, there is no consensus on which of these models of change best accounts for observed patterns of cleavage decline. There is sporadic evidence of an association between party locations on ideological dimensions and the extent of class voting,Footnote 32 but this has not so far impacted greatly on the general belief held by behavioural political scientists that ‘the bonds linking voters to politically relevant class groups are weakening, even while the political cues provided by traditional class groups (and parties) persist … Instead, these cues are simply less relevant to today's voters’.Footnote 33 This is in part because much research has lacked an explicit measure of party positional change and an explicit operationalization of the effects of class heterogeneity. In this article we address this lack of resolution by providing a simultaneous test of the two approaches in which we estimate the effect of the growing heterogeneity of classes on changes in the class–party association and also estimate the impact on such association of parties’ left–right ideological movements. We also do so over a longer time period than other studies and use a far more extensive dataset.
Hypotheses
How do we adjudicate empirically between the class heterogeneity and political choice models? On the one hand, the class heterogeneity account would hold that any decline in class voting would need to be explained by reference to changing social characteristics. On the other hand, the political choice model would point to the strategies of parties or elites, usually in response to structural transformation. Generally speaking, both predict a decline in the social bases of voting in Western societies in recent decades, but the mechanisms are different. Therefore, we need to tease out their empirical implications.
The approach adopted here is first to describe the pattern of change in the observed class–party association. This pattern of change then becomes the variation to be explained through the introduction of control variables with which we try to remove trends in levels of class–party support. These controls are not being pitted against class effects in a ‘variable race’, but are being used to estimate the impact on trends in observed class effects of changes in the patterning and effects of these control variables. If increases in class heterogeneity account for a decline over time in the class–party association, then controlling for these changes should remove trends in that association. Alternatively, if convergence in party left–right platforms accounts for convergence in the class–party association, then controlling for the left–right positions of parties should transform any observed slope into a flat line.
Class Heterogeneity
The class heterogeneity model contends that the blurring of social boundaries through increased social heterogeneity can be expected to have weakened the effects of class position on party choice:
HYPOTHESIS 1: Controlling for changes in the relationship between other social characteristics and social class should weaken the observed pattern of changes in the class–party association.
Political Choice
In the political choice model the extent of party polarization along salient dimensions of ideology is a key variable conditioning the extent of social bases to voting. In the British context this implies that Labour versus Conservative competition on the dominant left–right dimension should be the prime mover with respect to levels of class differences in party preferences. Party polarization should increase the magnitude of the association between social position and party choice; party convergence should reduce it. When there is ideological convergence the strength of the signals from parties to voters is weakened and the motivation for choosing parties on interest/ideological grounds derived from class position is reduced, and vice versa:
HYPOTHESIS 2: The pattern of change in the class-party association should be associated with shifts in positions on left-right ideology of the two main parties.
The political choice model also requires that classes respond to party signals. If party preference were purely the expression of identity or socialized affective attachments, then parties’ ideological positions would not impact on voter responsiveness. The shift in the balance of expressive versus instrumental voting and the concomitant observed growth in electoral responsiveness that occurred in the 1970s implies that prior to that time voters, and therefore classes, were less likely to respond to party signals. Party polarization on the left–right dimension should therefore be a conditioning factor for class differences in party preferences only after responsiveness has increased:
HYPOTHESIS 3: Ideological convergence/polarization by the two main political parties along the left–right dimension affects the strength of the class–party association only from the mid-1970s onwards.
Methods and data
We use data from two sources: (1) the British Election Studies (BES) carried out at every general election between 1964 and 2005 with an additional survey in 1963, and recall data from this survey on party choice in 1959; and (2) the British Social Attitudes (BSA) surveys carried out between 1983 and 2006. The BSAs are yearly, apart from 1988 and 1992. Our dependent variable is partisanship rather than vote choice.Footnote 34 Using partisanship allows us to have a consistently measured dependent variable that enables party preference to be operationalized meaningfully even during non-election years. Moreover, partisanship is in some ways more closely aligned with our theoretical expectations: our focus is on long-term links between parties and classes, and a party choice variable that is less amenable to short-term change is more appropriate. For comparison, we also ran models with reported vote in those surveys where it was available, which give the same substantive findings as the primary analysis.Footnote 35 The wording of the partisanship questions in the BES and BSA series is slightly different; the BES asks:
‘Generally speaking, do you think of yourself as Conservative, Labour, Liberal Democrat or what?’Footnote 36
Whereas we use a series of questions from the BSA:
‘Generally speaking do you think of yourself as a supporter of any one political party?’
[IF NO] ‘Do you think of yourself as a little closer to one political party than to others?’
[IF NO] ‘If there were a general election tomorrow, which political party do you think you would be most likely to support?’
As the BSA does not prompt with party names, respondents are much less likely to give an initial party identification. However, combining the three questions gives a very similar number of non-identifiers to the single BES question, to which the vast majority of respondents were willing to answer with a party label. For example, in the 1997 BES 13 per cent of respondents gave no identity in reply to the BES question. In the 1997 BSA, 56 per cent of respondents gave no identity in reply to the first BSA question, 30 per cent still gave no identity in reply to the second question and slightly under 14 per cent were left as non-identifiers after the third and final question.
Overall non-identifiers make up only 10 per cent of respondents in the pooled BES data, although as would be expected this has steadily increased from around 7 per cent of respondents in the first few surveys to 19 per cent at the last election in 2005. Using the three questions from the BSA gives similar numbers with 15 per cent of non-identifiers overall, again increasing from 12 per cent in the first survey in 1983 to 21 per cent in the last survey in 2006.Footnote 37 We have excluded the small numbers of respondents who identified with a party other than one of the three main parties. These respondents make up only 2 per cent of the whole sample, and less than 4 per cent in all individual surveys apart from the BSA in 2005 and 2006.
Measuring Class and Other Structural Variables
We measure social class using a slightly modified version of the commonly employed Erikson–Goldthorpe seven-class schema, which categorizes people by occupation into upper service (higher professional and managerial workers), lower service (lower professional and managerial workers), routine non-manual, petty bourgeois (the self-employed, small businessmen and farmers), foremen and supervisors, skilled manual, and semi/unskilled manual workers (including agricultural workers).Footnote 38 Individuals not currently working, due for example to unemployment or retirement, are assigned to their last occupation, and those who have never had a job or who are unable to be assigned to a class are assigned to their husband's or wife's class. Here we combine the last two classes of skilled and semi/unskilled workers into a broader working class, giving a six-category class variable. This is because of methodological concerns regarding how well the skilled and semi-skilled categories are actually distinguished. These two categories of manual workers are also not strongly distinguishable with respect to the principles the class schema is designed to operationalize.Footnote 39
The Goldthorpe schema is particularly suited for our purposes as it has frequently been employed in research into class dealignment and thus allows comparability with earlier published work. It is preferable to using the traditional manual/non-manual dichotomy because the latter would not allow the effects of variations in class position within the manual and non-manual categories to be measured.Footnote 40 The emphasis in the schema on material matters concerning employment conditions, promotion prospects, job uncertainty, pension provision and the like also chimes well with our emphasis on the instrumental, responsive nature of class–party preferences rather than social identities, which would seem to relate more closely to subjective measures of class identification.
We also include a large number of other independent variables in our models. Of most importance are those that capture those aspects of social change in Britain over the last half a century that have been thought to reduce the association between class and party by increasing the heterogeneity of classes. Taking our cue from the sources of heterogeneity identified in the introduction, we include changes in:
— Trade-union membership (current or not current member)
— Housing type (council tenant, private tenant or owner-occupier)
— Income (top decile, 9th decile, 4th quintile, 3rd quintile, 2nd quintile and 1st quintile)Footnote 41
— Educational qualifications (degree, some higher education, more than minimum school leaving age, minimum school leaving age)
— Private schooling (attended private primary or secondary school, only attended state schools).
— The gender composition of occupations.
We also include some other controls that, while not central to accounts of class convergence, are likely to be related to both party choice and class, and whose inclusion therefore provides an even more comprehensive test of the heterogeneity argument: these are religion (Church of England, Catholic, Church of Scotland, non-conformist, non-specified Christian, no religion or non-Christian);Footnote 42 ethnicity (white or non-white); and birth-year (categorized into eight ten-year birth cohorts).Footnote 43
Operationalizing Party Ideological Positions
Our primary indicators of party ideological positions are measures of party manifesto positions on a left–right dimension constructed by Budge and colleagues as part of the Comparative Manifesto Project.Footnote 44 We use this instrument because ‘the basic logic of party competition in Britain remains similar to that which held in the 1950s: in policy terms at least, it is largely about vote-maximizing by finding a location relatively close to the median voter on a predominantly left–right dimension of competition’.Footnote 45 The CMP measures are based on content analyses of the programmes of the main political parties at every post-war election. The quantity and direction of statements by parties, measured in (‘quasi-’) sentences, are classified into fifty-six policy categories over seven policy domains.Footnote 46
Analysis
The analysis proceeds in three stages. First, we present a series of models estimating the influence of class on party preference in each year. One set does not control for other key independent variables such as income, etc. The next set controls for these characteristics. The second stage of the analysis focuses on how class structure and party programmes have changed and, in particular, how the gap on the left–right ideological spectrum between the two main parties has changed since 1959. In the third and final stage of analysis we estimate a series of multilevel models to try and directly model the relationship between class, party platforms and party choice.
The Pattern of Long-Term Change, 1959–2006
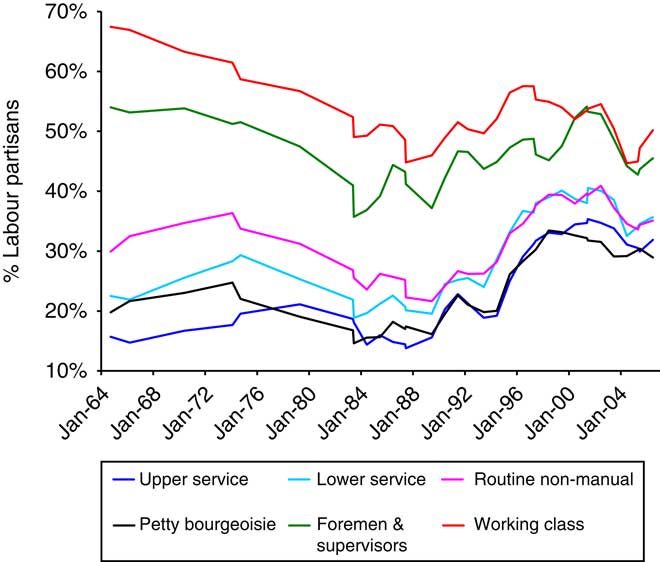
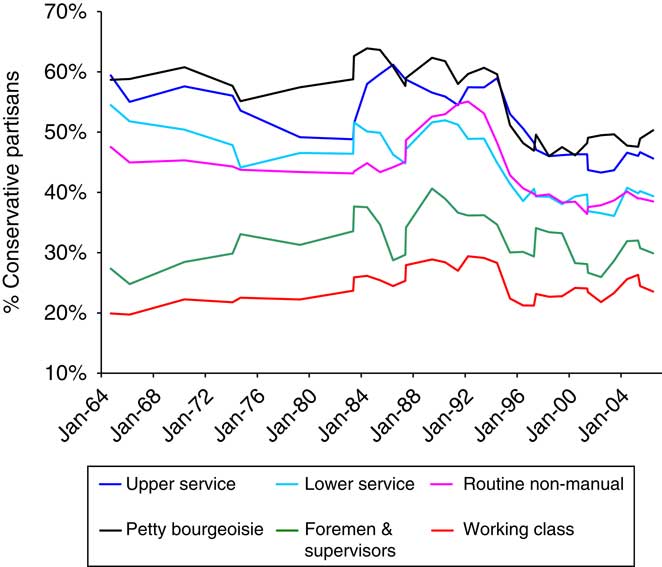
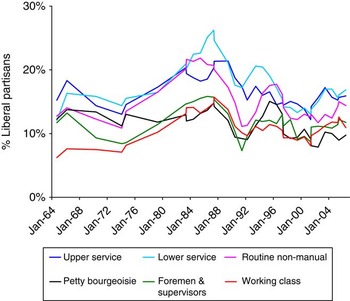
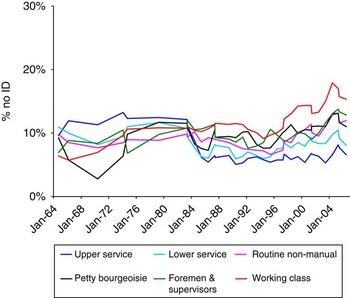
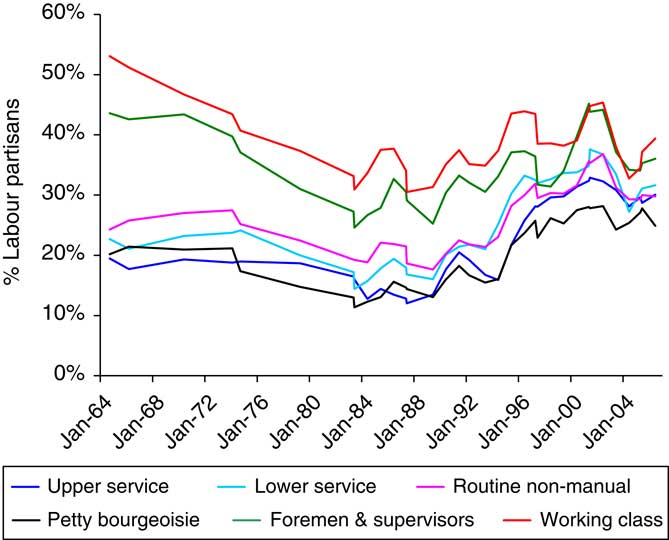
How has the association between class and party changed over time? Using a multinomial logit and the pooled 1959–2006 dataset of 81,758 cases,Footnote 47 we model party choice (which is categorized as Labour, Conservative, Liberal or no partisan identity) using social class, survey as a categorical variable, and an interaction between survey and class. We also include birth cohort, to cover changes over time that may be generational fully,Footnote 48 especially those related to declining rates of partisan identification, as well as changes over time due to changing party fortunes. This is then very similar to the type of model that has most often been presented in previous research, albeit in this case using a much larger dataset and a fuller specification of both class and party choice. The exact coefficient estimates are available on request, but, in the interests of conciseness, we simply present the predicted probabilities from this model graphically. Figures 1a to 1d thus show the pattern of change in the class–party association over nearly five decades. Because we are not concerned here with short-term fluctuations, the figures are of moving three-survey averages, and are derived from predicted probabilities for a respondent from each social class in each year born in the 1930s.
Predicted probability of Labour support by social class

Predicted probability of Conservative support by social class

Predicted probability of Liberal support by social class

Predicted probability of no party support by social class

Looking first at Figure 1a, Labour support, we see a most dramatic pattern of change. The gap between the upper service class (that is higher professional and managerial workers) and the working class declines from over 50 per cent in the 1960s to below 20 per cent in the 2000s. The gaps between the other middle classes (lower service, routine non-manual and the petty bourgeois) and the working class follow very similar though somewhat less pronounced trends. The ‘upper working-class’ group of foremen and supervisors is generally a little less Labour than the working class, although there is convergence here towards the very end of the period. In terms of the convergence between the middle-class groups and the working class though, it is not just the change that is striking, it is the stepped nature of this change. Much of the reduction in class partisanship occurs in the later part of the period we are examining, rather than the earlier period on which many of the authors on the decline of class politics were basing their assessments. The overall decline is due to a large fall in the difference between classes in the 1960s, some slight decline between 1970 and the early 1990s, then another sharp decline in the mid-1990s, followed by another slight decline up to 2006. We should also note that even at the end of the period after large declines, there remains a non-trivial, and statistically significant, gap between the two working-class groups and the various middle-class ones.
The pattern of Conservative partisanship by social class shown in Figure 1b is also relatively clear. The gap between the upper service class and manual workers declines from almost 40 per cent in the 1960s to around 20 per cent in the 2000s. Again this decline is centred around two periods, the 1960s and the 1990s. In fact, differences between the four middle-class groups and the working class are almost completely static between 1970 and 1995. Why class differences in Conservative support should have declined somewhat less markedly is not clear from a social change perspective, though the difference in magnitude between Labour and Conservative convergence patterns is prima facie consistent with the argument that it is Labour's shift to the centre that has been a key factor in class convergence.
In contrast to the two main parties it is clear that there is very little evidence of a class basis to Liberal support over the period we are studying. The most noticeable feature of Figure 1c is the rise and fall of support for the third party, peaking with the emergence of the Alliance Party in the 1980s. Even in the 1960s there was less than a 10 per cent gap in support between the upper service and working classes. This weakened further by the 2000s. Finally, there is a similar lack of class patterning to non-partisanship over most of the period. Figure 1d shows that there has been an interesting change in that non-partisans used to be centred in the upper and lower service classes in the 1960s and are now more likely to be working class, and to a lesser extent, members of the petty bourgeoisie, but these changes are clearly dwarfed by those to Labour and Conservative partisanship. Given the lack of major change to Liberal support and non-partisanship by class, we focus on support for the two main parties in the rest of the analysis.
In general, the changes in class differences in Labour versus Conservative support during the last four decades have been dramatic. In the 1960s Harold Wilson could rely on only a small percentage of the middle-class vote, but forty years later levels of support for Labour under Tony Blair among these groups were approaching that of the working class. To what degree these changes are accounted for by increases over time in social heterogeneity within classes and the increasing diversity of social sources of political preferences is not known. To answer this question, we estimate an equivalent model to that described above, but now we include the range of control variables discussed earlier, namely: income, level of education, private schooling, housing type, union membership, religion, sex, ethnicity and birth cohort. For simplicity's sake we include these variables as having constant effects over time in the model shown below, but we have run similar models allowing for change over time in the effects of the control variables that give almost identical results in terms of the relationship between class and party choice.Footnote 49 The inclusion of these controls improves model fit, in the previous model the Nagelkerke pseudo R 2 was 0.15, this improves to 0.25 with the inclusion of the controls.Footnote 50
Figures 2a and 2b show the predicted probabilities of being a Labour and Conservative supporter, respectively. These refer to a white male born in the 1930s with a minimum education in the state system, who does not belong to a trade union, is in the third income quintile, has no religion and is an owner-occupier. Naturally, we would expect the overall gap between classes to have reduced across the board once the numerous controls included here are taken into account, and indeed this is clearly the case for both the Conservatives and Labour. However, there remain real differences between classes even in later years: in 2006 the working class is still statistically significantly different to the middle-class groups in terms of the Conservative/Labour choice.
Predicted probability of Labour support by social class from a model including controls for other social characteristics

Predicted probability of Conservative support by social class from a model including controls for other social characteristics

More important is the shape of convergence. If social change accounts for all of the change in class voting for the main left–right parties, then the pattern of convergence seen in Figures 1a and 2a should flatten out: the funnel should become a tube. Looking first at Labour support in Figure 2a, the pattern of decline over time in the gap between the upper service class and the working class seems rather similar to that shown in Figure 1a: the gap is around 35 per cent in the 1960s and reduces to under 10 per cent in the 2000s. The gaps between manual workers and the other middle classes follow very similar trends. Interestingly, what reduction in convergence we do see eliminates the shallow declines between the 1970s and early 1990s and between the late 1990s and 2006. Although there is still a noticeable decline between the 1960s and 1970, the gaps between the various middle-class groups and the working class in 1995 are almost exactly the same as they were in the early 1970s. What is also obvious is that the pronounced pattern of convergence found in the 1990s remains almost undiminished. There is a similar story for the Conservatives as shown in Figure 2b. So, in general, the inclusion of the control variables reduces class differences in every year as we would expect, but it seems to make little difference to the twin declines in class voting up to the early 1970s, and then over the course of the mid- to late 1990s.
Changing Party Positions on Left–Right Ideology
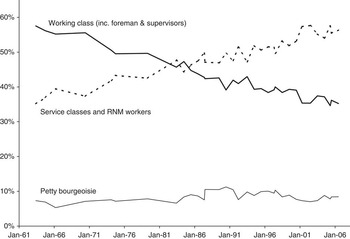
In the second strand of our analysis, we now turn to how parties have shifted their policy positions over the last half a century, focusing on the idea that the strategic move to the centre of the ideological spectrum by a vote-seeking Labour party may have suppressed class differences in main party support. To examine this thesis, we first present evidence of the changes in the size of classes that will have provided the motivation for a strategic ideological shift by the party. These changes are well known and, as can be seen from Figure 3, they occurred mainly during the first half of the period we are examining, with the ‘tipping point’ of over 50 per cent of the electorate falling within the white-collar middle classes by the early 1980s, just at the point when the Labour breakaway Social Democratic Party (SDP) was formed, followed shortly by the long march to the centre instigated by Neil Kinnock.
Relative sizes of the different classes (reduced to three categories) over time

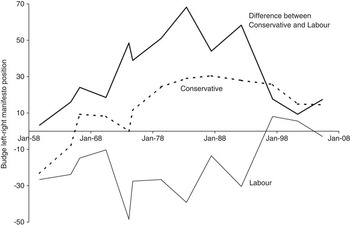
How these changes correspond to party shifts in the ideological landscape is shown in Figure 4. This presents the left–right ideological positions of the two main parties using the left–right scale from the CMP. It demonstrates the increased polarization from the 1970s onwards and the sharp convergence that occurred between 1992 and 1997.Footnote 51 This derives almost entirely from the move to the centre by the Labour party under Tony Blair. The Conservatives did not change their position to anywhere near the same degree. The upshot of this centre shift by the Labour party is a substantial reduction in the difference in left–right ideological positions between the two main parties. Given the intimate link between left–right ideology and the interests of different classes, this pattern of change provides prima facie evidence of why there might be convergence over time in the class–party association among voters.
Differences between the Conservatives and Labour over time on the left–right dimension as measured by the CMP

Linking Class Voting and Changing Party Positions
Just ‘eyeballing’ the graphs shown above, it is clear that the polarization that occurred between the parties is not exactly shadowed by changes in the class–party association over the whole time period we are looking at. In fact the fairly stable gap between the parties between 1964 and 1970 is accompanied by a decrease in class voting. Nonetheless, there does seem to have been a clear link between ideological convergence and class convergence after the 1960s. In particular, we might pick out three periods after the 1960s: first, the relatively steady difference between the parties between the mid- to late 1970s and the 1992 election (the mean manifesto difference score for the two 1974 elections is very similar to the mean of the 1987 and 1992 manifesto differences), which is mirrored by the relatively stable rates of class voting; secondly, the sharp convergence between the parties in the mid-1990s, which is accompanied by the sharp decline of class voting over this period; and thirdly, the resumption of relatively stable rates of class voting in the 2000s, again accompanied by stable party positions between 1997 and 2005.
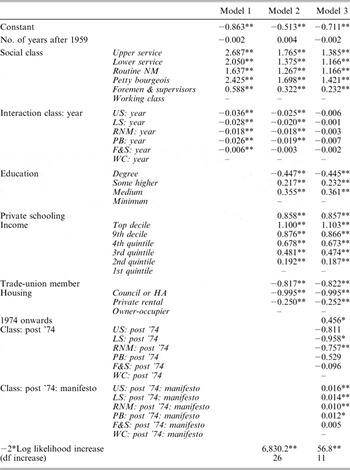
At first glance then, these results seem consistent with Hypothesis 3, which explicitly models the emergence of electoral responsiveness from the 1970s onwards, but not consistent with Hypothesis 2, which assumes ideologically responsive class voting throughout the 1959–2006 period. We can test these claims a little more rigorously using a series of multilevel models, presented in Table 1. These are logit models predicting Conservative partisanship, relative to Labour; here we exclude all Liberal identifiers and non-identifiers to concentrate on how the two major parties have shaped class voting rates. At Level 1 is the individual survey respondent, and at Level 2 is the survey itself.Footnote 52 Model 1 attempts to encapsulate the idea of a steady decline in class voting, including just class at the individual level and time at the contextual level; Model 2 includes other independent variables at the individual level that may have affected the composition of classes, trade unionism, housing, income and so forth, to test how much these can account for how the impact of class has changed over time; finally Model 3 includes some measures at the contextual level of the ideological distance of the parties to see how well this accounts for changes in the effect of class.
Multilevel Logistic Regression Models Predicting Conservative Support Relative to Labour

Notes: Models 2 and 3 also include controls for sex (reference category = men), race (reference category = white), birth cohort (reference category = 1930s) and religion (reference category = Anglican). All three models include 31 surveys and 51,421 individuals. *p < 0.05, **p < 0.01.
So to be more specific, Model 1 includes our categorical measure of social class, an interval level measure of time, specifically, to the nearest month, the number of years since January 1959 to the election (or in the case of the BSA, July of the year in which the BSA was conducted), and an interaction between social class and time. The coefficients for social class are thus effectively our estimates of class effects in 1959, and the coefficients for the interaction terms are our estimates of the yearly decline in the coefficients for class. This model therefore provides a way of operationalizing the notion of a steady decline over time in class voting. As Model 1 in Table 1 shows, we predict class to be clearly important in 1959 in predicting vote choice; the predicted probability for a member of the upper service class identifying as Conservative is 87 per cent, and for a member of the petty bourgeoisie it is 84 per cent, which compare with only 30 per cent for a member of the working class. There is also, unsurprisingly, a very strong trend over time to less class voting as well. By the time of the 2005 election, our model would predict that 52 per cent of the upper service class and 57 per cent of the petty bourgeoisie would identify as Conservative compared with 28 per cent of the working class.
Model 2 introduces the additional independent variables discussed earlier, though we just report the coefficients for the group of variables that form part of the discussion on the changing character of social classes – namely trade-union membership, education, housing and income. As can be seen these all have large, and highly statistically significant, effects on partisanship, and moreover their inclusion substantially reduces the main effects of social class. Clearly, in Model 1, part of the estimated effect of class was actually due to income, housing tenure and so forth, as these factors are correlated with class and partisan identity. This fuller model does not, however, show a radical reduction in the class/year coefficients; there is some fall in the size of the interaction coefficients for all classes, but this is partially due to the fact that the starting point for class differences has changed, and it is certainly the case that the trend towards less class-based partisanship remains. In 1959 our model predicts that a ‘typical’ working-class person has a 37 per cent chance of being a Conservative,Footnote 53 compared with 78 per cent for a member of the upper service class, over a 40 percentage point difference. By 2006 Model 2 would predict this same gap had closed to only 15 percentage points. In that sense, there is really little here to refute our earlier conclusions that Hypothesis 1 is simply not borne out. What about the link between party positions, class and partisanship though?
Model 3 introduces a number of terms to try to test how party movements have affected class voting. We include three new sets of variables. The first is simply a dummy variable for whether the survey is after 1974 or not (0 for before 1974, 1 for 1974 and after). We then include a series of interaction terms between this variable and the five class variables. These terms are included to capture the implications of the earlier results that showed there were declines in the class/party relationship during the 1960s that we cannot explain due to party movements. The dummy variable is also used in our final set of interactions, because, as we argued earlier, it is not only that class became less important over the 1960s in predicting party choices, but that this is a period in which we would expect that the electorate would be unresponsive to party platform change. Therefore, we include a measure of party divergence that is interacted with the dummy variable after the mid-1970s and with the five class dummy variables. What is this measuring? Well, it is the extra effect of class from the mid-1970s onwards, depending on whether parties are close together or far apart.Footnote 54 We measure party divergence using the manifesto data from Figure 4: specifically, the position of the Conservatives on the left–right dimension minus the position of Labour on the left–right dimension. For non-election surveys, we take the interpolated value from the two surrounding election years.
Model 3 shows how well party position change can account for changes to the class/party relationship, at least from the 1970s onwards. The post-1974/class interaction effects are all negative, although only those for the routine non-manual and the lower service classes are statistically significant, showing that there were, to some extent, greater class differences in party choice prior to the mid-1970s. More importantly though, the three-way interaction effects are statistically significant for all four of the middle-class groups, showing that the differences between the middle classes and the working class are, after the mid-1970s, dependent on the policy gap between the two main parties. And most importantly, the interaction terms between year and class are now effectively reduced to 0, and none are statistically significant. Thus, the combination of allowing the 1960s to be different from the later period and including a measure of party divergence/convergence interacted with class effectively eliminates all change over time in the class coefficients.
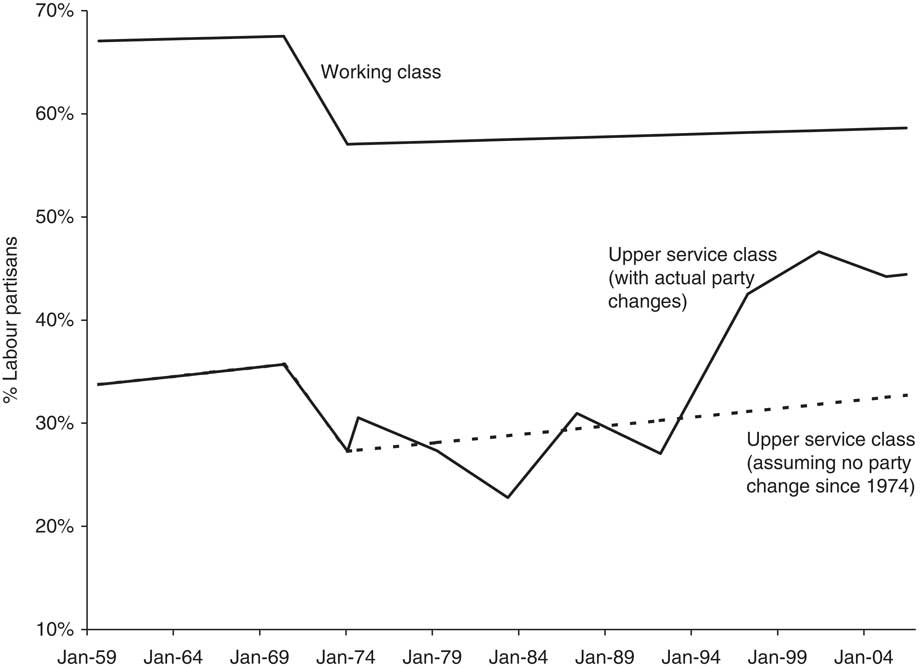
These effects are illustrated by a graph of the predicted probabilities of choosing Labour rather than Conservative using estimates derived from Model 3; these have been calculated again for our ‘typical’ person (see Figure 5). The two thick lines show the prediction for working-class and upper service-class Labour partisan share, assuming the real changes that happened to the parties over the period. Clearly, this matches reality very well, the classes remain distinct until Labour moves to the centre in the 1990s, at which point the classes become much more alike in their partisanship.
Predicted probabilities of Labour support over time controlling for movement in party ideological positions
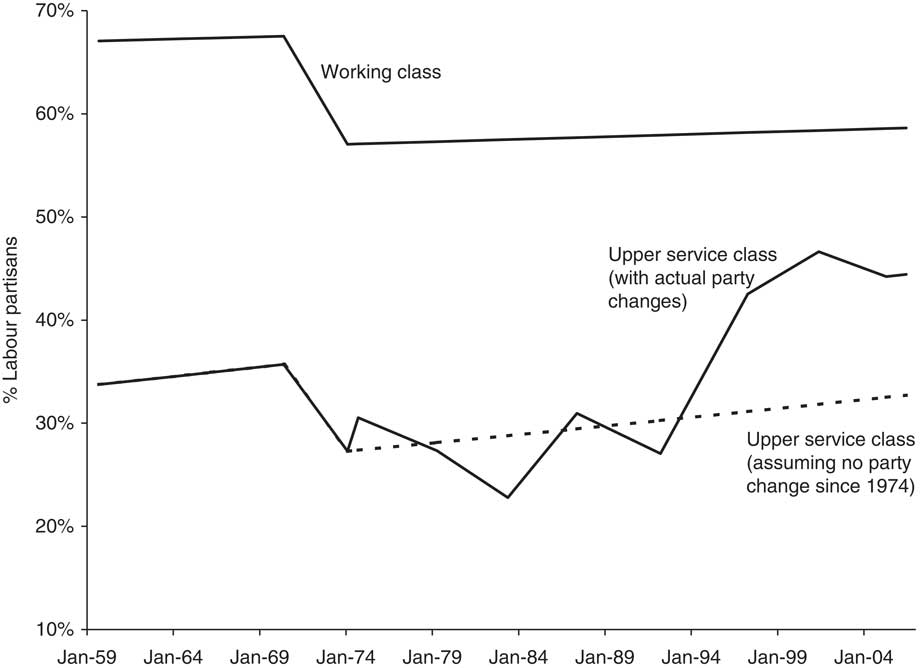
Yet if we assume that the difference between the parties had remained constant since the mid-1970s, the dotted line for the upper service class, then the convergence between classes from that point on is removed and replaced by continuous differences in the probability of choosing one party over the other, the implication being that, without ideological convergence, there would have been no further class convergence in choices between these parties over the last thirty years.
Conclusions
Though traditionally Britain has been characterized as a class-conscious society, in which there are large divisions between classes in political attitudes and behaviour, the new orthodoxy is that the influence of class has declined and that other factors have become more important in structuring political choices. The reasons for this have usually been attributed to aspects of social change that have weakened the distinctiveness of social classes and the solidity of the class structure. We have shown, however, that the explanatory power of this class heterogeneity approach is minimal when compared with one that emphasizes strategic ideological convergence by the main parties. Thus, even after controlling for changes in class heterogeneity and the impact this may have had on party behaviour, the level of class partisanship observed in the electorate closely parallels the extent of the main parties’ ideological convergence/polarization. Given that voter perceptions of party difference closely track the pattern of convergence in parties’ manifestos, we can conclude that there is prima facie evidence that party positions influence the electorate's perceptions and, through this, the variation over time in the political choices of the different social classes. This interpretation is further bolstered by evidence presented by other authors of the pronounced drop in the power of left–right attitudes to predict party support during the 1990s.Footnote 55 We are thus in agreement with authors such as Clarke et al. and Green who argue for the current pre-eminence of valence voting.Footnote 56 Unlike them, however, we do not think that the longstanding emphasis in British electoral research on social class is redundant. Rather, we hope to have demonstrated that reduced levels of class differences in party preference are themselves a function of the political factors that influence the political choices of a responsive electorate: the emergence of valence politics weakens the link from class to party, rather than vice versa. Moreover, these strategic shifts by parties of the left are prompted by the changing shape of the class structure itself. So the post-industrial transformation of the shape of the class structure, rather than the blurring or fracturing of class boundaries, is an independent influence on politics that in turn influences observed class differences in party preference. Contrary to the implications of much of the ‘bottom up’ literature on the decline of class politics in post-industrial society, strategic moves by political actors seem capable of generating pronounced changes in the social bases of party support over relatively short periods of time.
Inevitably, there are interpretative questions that remain. Thus, the close correspondence between the Labour party shift to the centre and the gap between the main parties on the CMP scale indicates that Labour's ideological shifts are particularly important to understanding the decline of class differences in party preferences. But what our analysis cannot in isolation unravel is whether it is this centrist move by the Labour party rather than the ensuing diminution of the gap between Labour and Conservatives that accounts for the convergence in class support between the main parties. The over-time correlation between Labour's manifesto position and that of the gap between them and the Conservatives is too high to disentangle. However, research elsewhere does lend some support to the argument that the position of parties on the left alone is inadequate to explain changes in class voting. In the United States, it is the Republicans who appear to have moved markedly since 1980, and in this case away from the centre, with the resulting polarization between the two main parties in tax and transfer policies, making it more attractive for poor voters to support the Democrats and richer ones the Republicans.Footnote 57 This has been accompanied by an increase in ‘class’ (measured as trifurcated income) voting,Footnote 58 which indicates that it is the gap between the parties that matters rather than specific movements by the party of the left. Huber and Stanig likewise find more voting polarization by income in countries where the party system is most polarized on the economic dimension, and the costs of voting for the ‘wrong’ party are higher.Footnote 59
There is also always the possibility that party convergence/polarization is itself endogenous. One source of this, of particular relevance for our analysis, could be the decline of social divisions: i.e. the disappearance of a defined class structure has itself led parties to converge on the middle ground of left–right politics. However, if the blurring of class differences through increased class heterogeneity leads to ideological convergence by the main ‘class’ parties, then modelling that heterogeneity controls for that source of party convergence. It incorporates the causal path that runs from increasing heterogeneity to party convergence and hence to the decline of class differences in party support. Therefore, any residual effects of party convergence cannot be attributed to increasing class heterogeneity.
A further source of endogeneity suggested by recent spatial models of party competition (for example, by Adams, Merrill and Grofman) is that class–party dealignment itself influences party convergence by increasing the incentives to pursue the support of the median voter.Footnote 60 To the degree that the positions of the parties depend on class dealignment, as well as potentially causing it, our estimates will be inflated. Given the available evidence, this cannot be ruled out. Our estimates of party effects should therefore be treated as an upper bound. At the same time, it seems unlikely that all of the very pronounced effects presented in Figure 5, for example, can be attributed to this potential reciprocality. Party positioning has an impact on class differences in party preference, though its precise magnitude cannot yet be ascertained.
Our interpretation of the individual-level mechanisms through which these changes in the class basis of party support occur refers to the idea that voters respond to party signals on an ideological dimension. Evidence that measures of substantive left–right values/ideology in the electorate display high levels of reliability, stability and predictive validity, even among politically unsophisticated voters, suggests this dimension provides a meaningful heuristic for connecting parties’ positions to voters’ decisions across the electorate as a whole.Footnote 61 Nonetheless, an alternative interpretation emphasizing group-based heuristics – i.e. voters in different class positions believe that Labour now represents to a lesser, or greater, degree ‘their sort of people’ – cannot be ruled out. Such heuristics are potentially widespread,Footnote 62 and there is evidence that the perceived link between social class and party has weakened: in 1987 no less than 46 per cent of people believed that Labour looked ‘very closely’ after the interests of working-class people, and as many as 33 per cent still did so in 1997, but by 2005 the figure had fallen to just 10 per cent.Footnote 63 Therefore, what our findings suggest is that such signals of affinity and relevance for group interests are themselves conditioned by parties’ ideological movements. The latter can be used to explain how such group-based judgements change over time.
What we have been less successful in explaining, whether through class heterogeneity or political choice models, is the decline in the class–party association observed between the 1960s and early to mid-1970s. We are not alone: Franklin's seminal work on class politics in Britain dedicated an entire chapter to the puzzle of the 1970 election, pointing to ad hoc factors such as the end of national service;Footnote 64 Heath et al., similarly, focused on one-off changes that occurred around that time, such as the reduction in the minimum voting age from 21 to 18 and the big increase in third-party contestation of constituencies in the 1970s;Footnote 65 while Evans et al. attributed the pronounced drop in working-class Labour support to disillusionment incurred by the party's incumbency.Footnote 66 The puzzle of the decline in class voting over this period remains unsolved.
Similarly, whether the findings from the British case can be generalized remains uncertain. Previous studies indicate that Scandinavian societies have substantial class cleavages, though these have declined in magnitude, whereas religion (as denomination or religiosity) forms a more significant cleavage in many other European societies.Footnote 67 Whether the religious cleavage is also conditioned by strategic party moves in response to a shrinking confessional base remains to be seen, but the idea that confessional parties react strategically to declines in their traditional constituencies, given the moral and value-based nature of their appeals, in distinction to the resources and interest basis of class parties, would seem to be an interesting case for party strategy models of cleavage evolution.
Notwithstanding these unresolved questions, the relative empirical validity of the two competing models of change outlined here does have implications with respect to our understanding of future political developments. The political choice thesis implies that we could in principle see higher levels of volatility in cleavage strength and the reversibility of ideological convergence trends if parties seek to differentiate themselves from others on dimensions where public opinion is favourably skewed. Therefore, the future strength of class politics, could depend more upon party strategy and electoral appeals than the social changes usually envisaged in discussions of post-industrial society. If parties diverge on class-related dimensions of competition, and assuming class position continues to influence voters’ perceptions of their interests, class could become a stronger source of party preferences.
In the British case this scenario is most likely to occur as a result of the adoption of a more proportional electoral system. The pressure to converge on the centre and away from traditional support bases in pursuit of the median voter would then be less pronounced. We could then see an increase in the class basis of party support in response to ideological differentiation induced by a changing strategic landscape. This is clearly not what is envisaged from a ‘bottom up’ perspective emphasizing the gradual dissolution of differences in interests derived from class structure. Our findings therefore point to a somewhat different view of the future of the class-politics cleavage than conventional wisdom might suggest.