Introduction
The hexagonal close-packed α phase is a dominant component of many in-service titanium alloys [Reference Leyens and Peters1, Reference Lutjering and Williams2]. In α-Ti alloys, basal and prismatic slips are two easiest slips [Reference Yoo and Wei3, Reference Naka, Lasalmonie, Costa and Kubin4]. However, under load along the c-axis, neither works due to vanishing resolved shear stress, and pyramidal slips and deformation twins can operate, although with much higher critical resolved shear stresses [Reference Naka, Lasalmonie, Costa and Kubin4, Reference Williams, Baggerly and Paton5]. Thence a grain oriented with its c-axis parallel to the external axial strain is called a hard grain with a hard orientation, which is the least plastic region in the microstructure. A number of fatigue fracture instances in α-Ti are attributed to crack initiation within the hard grains or on their boundaries [Reference Bache, Evans and Davies6, Reference Bache7, Reference Sinha, Mills and Williams8, Reference Dunne, Wilkinson and Allen9, Reference Dunne, Rugg and Walker10, Reference Dunne, Walker and Rugg11]. What is worse, owing to the existence of microtextured regions with similarly hard-oriented grains, cracks grow significantly faster compared with normal fatigue [Reference Sinha, Mills and Williams12, Reference Pilchak13], resulting in the dwell fatigue sensitivity of certain α-Ti and near α-Ti alloys. Currently, the microstructural origin of the “microtexture” is still under debate.
Dynamic recrystallization significantly influences the microstructure of Ti alloys and is closely relevant to microtexture formation. But direct experimental confirmation of the nucleation stage of dynamic recrystallization is difficult due to its time and space scales, as well as the coupling of deformation and temperature. Hence, molecular dynamics (MDs) simulations are performed in the present work to investigate the behavior of the soft/hard grain boundary (GB) in α-Ti with different GB orientations under various loading directions. The aim is to clarify, on the atomic scale, (i) the response of the soft/hard GB with and without residual dislocations under loading; (ii) the influence of the loading direction on the initiation of dynamic recrystallization. The result is expected to help achieving deeper insights into the nucleation of dynamic recrystallization. Moreover, this work has industrial importance, because predicting lower bound component behavior from specimen-level test requires a semiquantitative understanding for the probability of, and sensitivity to microstructural features.
Methodology
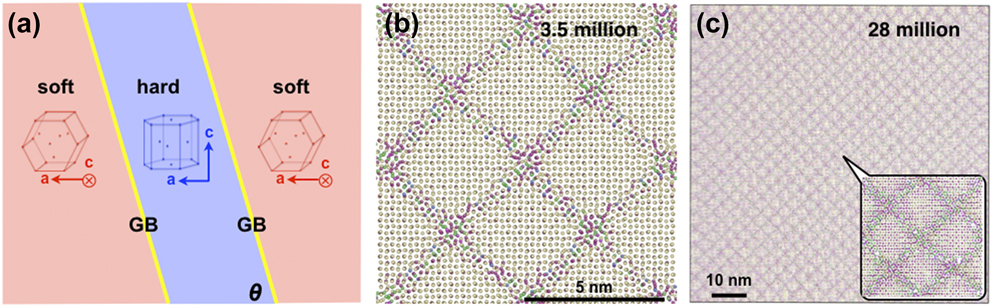
A crystal with sandwiched structure [Fig. 1(a)] is constructed according to experimental suggestion [Reference Dunne and Rugg14], where the soft (red) and hard (blue) grains follow the orientation relationship,  ${\left[ {11\bar{2}0} \right]_{\rm{s}}}{\parallel} {\left[ {11\bar{2}0} \right]_{\rm{h}}}$,
 ${\left[ {0001} \right]_{\rm{s}}}{\parallel} {\left[ {1\bar{1}00} \right]_{\rm{h}}}$, and
 ${\left[ {1\bar{1}00} \right]_{\rm{s}}}{\parallel} {\left[ {0001} \right]_{\rm{h}}}$. A series of GB are built with various orientation angles, θ [Fig. 1(a)], the angle between the GB plane normal and the basal plane normal of the hard grain. These GB series are then MD-relaxed at 1 K for 20 ps, and the resulting GB structure is shown in Fig. 1(b) for θ = 90°.
(a) Schematic of the soft (red) and hard (blue) grains with a boundary (yellow) in between. GB orientation, θ, is the angle between the GB plane and the basal plane of the hard grain. (b) and (c) Projections along the a-axis of the atomic structures of the 90° GB containing 3.5 and 28 million atoms, respectively, with atoms colored by coordination number, 13, blue; 12, yellow; 11, red; and 10, green.
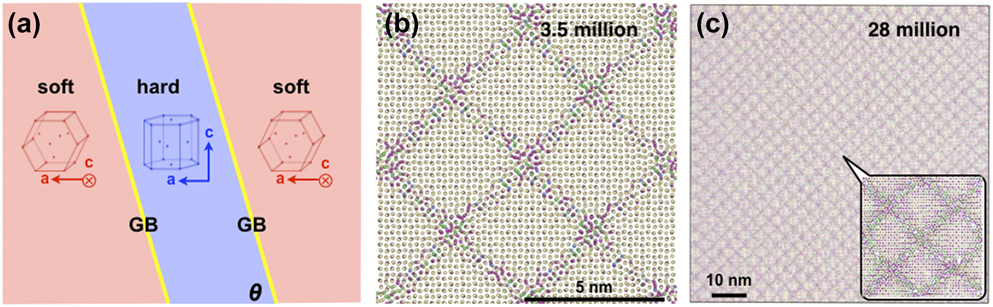
To avoid size effects on the GB structure, the 90° GB has been reproduced in a larger simulation box with doubled dimensions, 47.2 × 102.2 × 102.2 nm, containing 28 million atoms, thus with an interfacial area four times as large. As shown in Figs. 1(b) and 1(c), the GB structures in the small and large boxes do not have perceivable difference and share the same misfit dislocation density as indicated by the scale bars. Without introducing additional artifacts and to save computation time, the smaller box size is used throughout the study. Note that because of lattice mismatch along [0001] and  $\left[ {1\bar{1}00} \right]$, the resulting GB is a high angle incoherent boundary, and for the smaller simulation box, there is an overall mismatch of less than 0.5%, which does not bring in perceivable influence on the GB structure.
The atomic structures and energies of the soft/hard GB are systematically studied with the orientation angle θ ranging from 60° to 90° using the state-of-the-art interatomic potentials for Ti under the embedded-atom method (EAM) framework, i.e., the modified EAM (MEAM) [Reference Hennig, Lenosky, Trinkle, Rudin and Wilkins15], EAM [Reference Zope and Mishin16], and Finnis–Sinclair EAM (EAM/FS) [Reference Ackland17]. These potentials reproduce well the basic lattice properties, e.g., the c/a ratio and elastic constants. Periodic boundary conditions are used along all dimensions. Volume and temperature are controlled with Parrinello–Rahman scheme [Reference Parrinello and Rahman18] and the Nose–Hoover thermostat [Reference Nose19], respectively. AtomEye [Reference AtomEye20] is used to color the atoms according to their coordination number and, in certain figures, atoms with right HCP coordination number are not shown.
MDs simulations and ab initio calculations were carried out employing LAMMPS [Reference Plimpton21] and VASP [Reference Kresse and Furthmuller22], respectively, with the climbing-image nudged elastic band (CINEB) calculations performed using the built-in modules. Experiment details can be found in a previous work [Reference Qiu, Ma, Lei, Liu, Huang, Rugg and Yang23].
Results and discussion
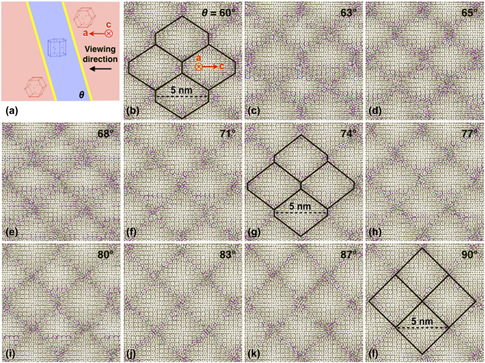
The relaxed atomic structures, projected along the a-axis [see Fig. 2(a)], are shown in Figs. 2(b)–2(l) with corresponding energy plotted in Fig. 3. Despite minor atomic-scale difference, the three potentials generate similar GB structures at the same GB orientation angle. As θ changes from 60° to 90°, the shape of the misfit dislocation network changes from hexagon to rhombus as indicated in Figs. 2(b)–2(l).
(a) Schematic of the soft–hard grain model. (b) to (l) Structures of the 60° to 90° GB projected along the a-axis of the soft grain (red) in (a), with atoms colored according to their coordination number. The misfit dislocation networks are indicated in (b), (g), and (l) with black grid and dashed scale bars.

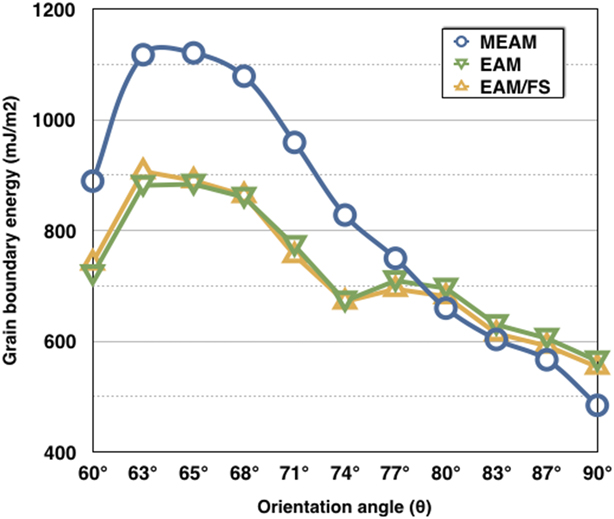
GB energy with respect to the orientation angle, θ, calculated with three EAM-type interatomic potentials.
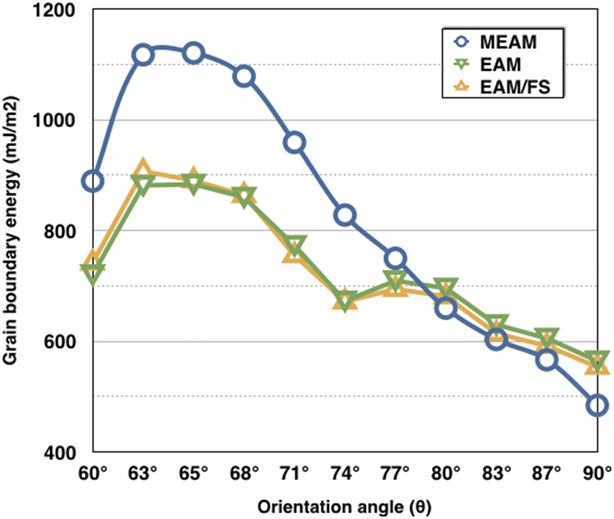
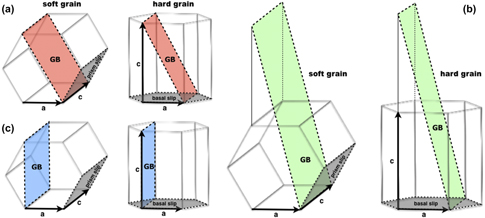
The energy of the above GB follows roughly the same trend as calculated with the three interatomic potentials (Fig. 3). For the MEAM potential, GB energy first increases and then decreases monotonically between the two extremities at θ = 60° and 90°, whereas for the EAM and EAM/FS potentials, GB energy has extra local minima at θ = 74°. We therefore choose three representative GB with orientation angle θ = 60°, 74°, and 90° as schematized in Fig. 4, and study their behavior under tensile loading with and without incoming dislocations in the following study. The GB planes thus correspond with  $\left( {10\bar{1}0} \right)$ prismatic plane and
 $\left( {2\bar{1}\bar{1}1} \right)$ pyramidal plane in the soft and hard grains, respectively, for the 60° GB;
 $\left( {8\bar{2}\bar{6}1} \right)$ and
 $\left( {4\bar{2}\bar{2}1} \right)$, respectively, for the 74° GB; and both
 $\left( {2\bar{1}\bar{1}0} \right)$ for the 90° GB.
Schematic drawing of the soft and hard grains with the 60° (a), 74° (b), and 90° GB (c), with the GB planes colored red, green, and blue, respectively. Prismatic and basal slip planes are colored gray.

Orientation-sensitive plastic behavior
The GB-containing simulation box is tensile loaded along various directions (Fig. 3) at 300 K at a constant strain rate of 108/s with MDs. Periodic boundary conditions are used along all degrees of freedom. For comparison, prismatic edge dislocations are then introduced to the soft grains, and the resulting configuration is loaded in the same manner. Simulations are carried out using both the MEAM and the EAM potentials with consistent results, and thus for clarity, only results from the EAM potential are presented in the following context.
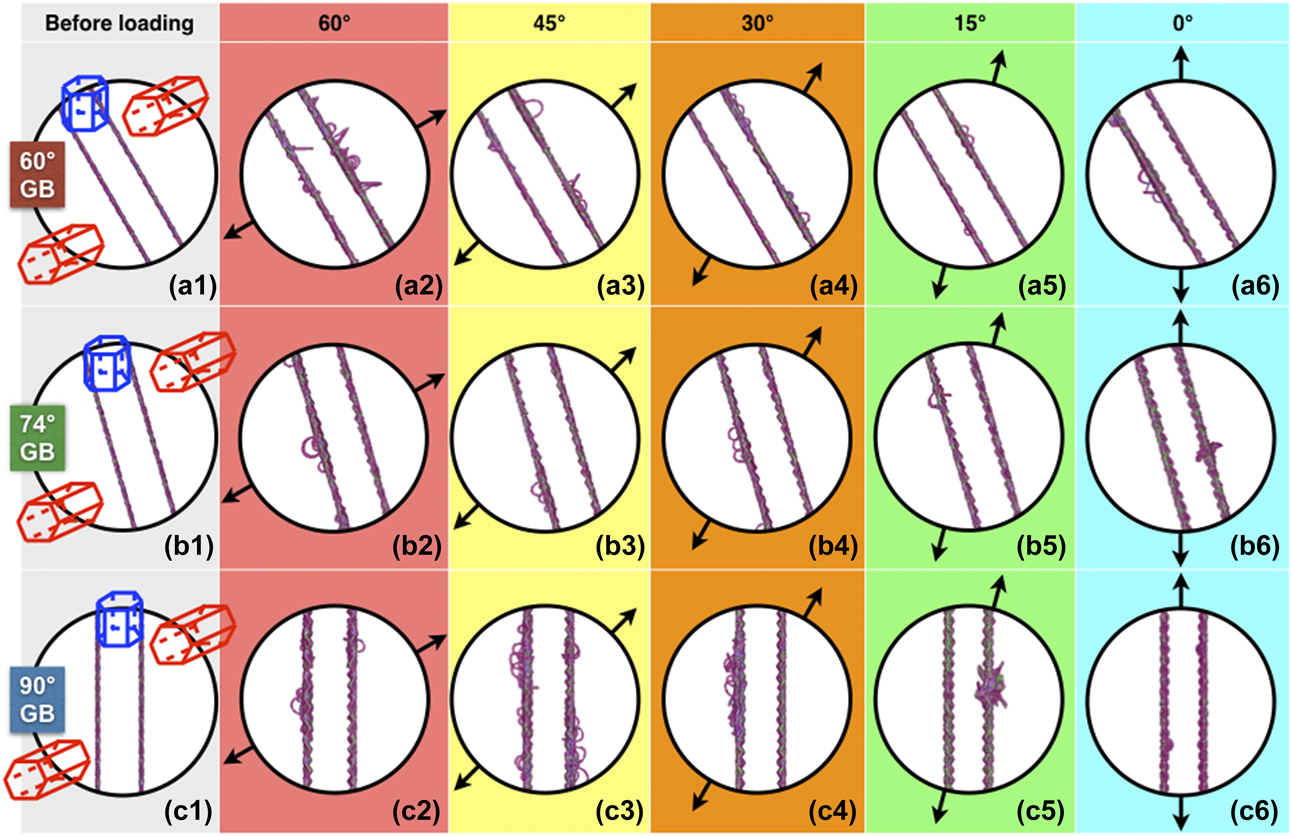
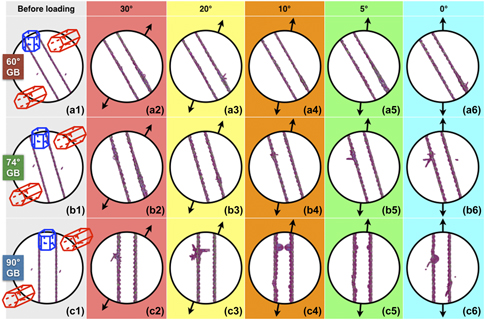
We first look at the response of the residual dislocation-free GB against tensile loading along various directions distinguished by the angle between the tensile direction and the basal plane normal of the hard grain. As the configurations in Fig. 5 are projected along the c-axis of the soft grain, we first identify various defects to facilitate later analysis. A rod-shaped defect in the hard grain like the one in between the two GB in Fig. 5(a2) is a dislocation loop with Burgers vector  ${1 / 3}\left[ {11\bar{2}0} \right]$ on the basal plane of the hard grain, thus dubbed
 $\left\langle a \right\rangle _{\rm{h}}^{\rm{b}}$; a rod-shaped defect in the soft grain like the one at the middle of the right GB in Fig. 5(a3) is a dislocation loop with Burgers vector
 ${1 / 3}\left[ {11\bar{2}0} \right]$ on the prismatic plane of the soft grain, dubbed
 $\left\langle a \right\rangle _{\rm{s}}^{\rm{p}}$; a ring-shaped defect like the upper one in Fig. 5(a3) is a dislocation loop with Burgers vector
 ${1 / 3}\left[ {11\bar{2}0} \right]$ on the basal plane of the soft grain, dubbed
 $\left\langle a \right\rangle _{\rm{s}}^{\rm{b}}$; a complex defect like that in Fig. 5(b6) corresponds with dislocations
 $\left\langle a \right\rangle _{\rm{s}}^{\rm{p}}$ and dislocations with Burgers vector
 ${1 / 3}\left[ {11\bar{2}3} \right]$ on the pyramidal plane of the hard grain, dubbed
 $\left\langle {c + a} \right\rangle _{\rm{h}}^{\rm{p}}$; and defects like those in Fig. 5(c6) correspond with grain reorientation. It is worth noting that because of the cracks formed on the GB, the local stress perceivably deviates from the applied tensile stress, resulting in plastic events that would otherwise not occur, e.g.,
 $\left\langle a \right\rangle _{\rm{s}}^{\rm{b}}$. However, the focus of the present work is on the initiation of plastic deformation and therefore detailed discussion of such secondary dislocation events is not included in the present paper because of the large information therein and will be reported in a forthcoming publication.
Initiation of plastic deformation at various loading angles from 60° to 0° for the 60°, 74°, and 90° GB without impacting dislocations. (a1, b1, and c1) Configurations before loading. (a2–a6, b2–b6, and c2–c6) Instantaneous configurations slightly after the initiation of plastic deformation. Atoms are colored according to their coordination number with ordinary HCP atoms not shown. Lattice orientation is the same as that in Fig. 3. Black arrows indicate the loading directions.
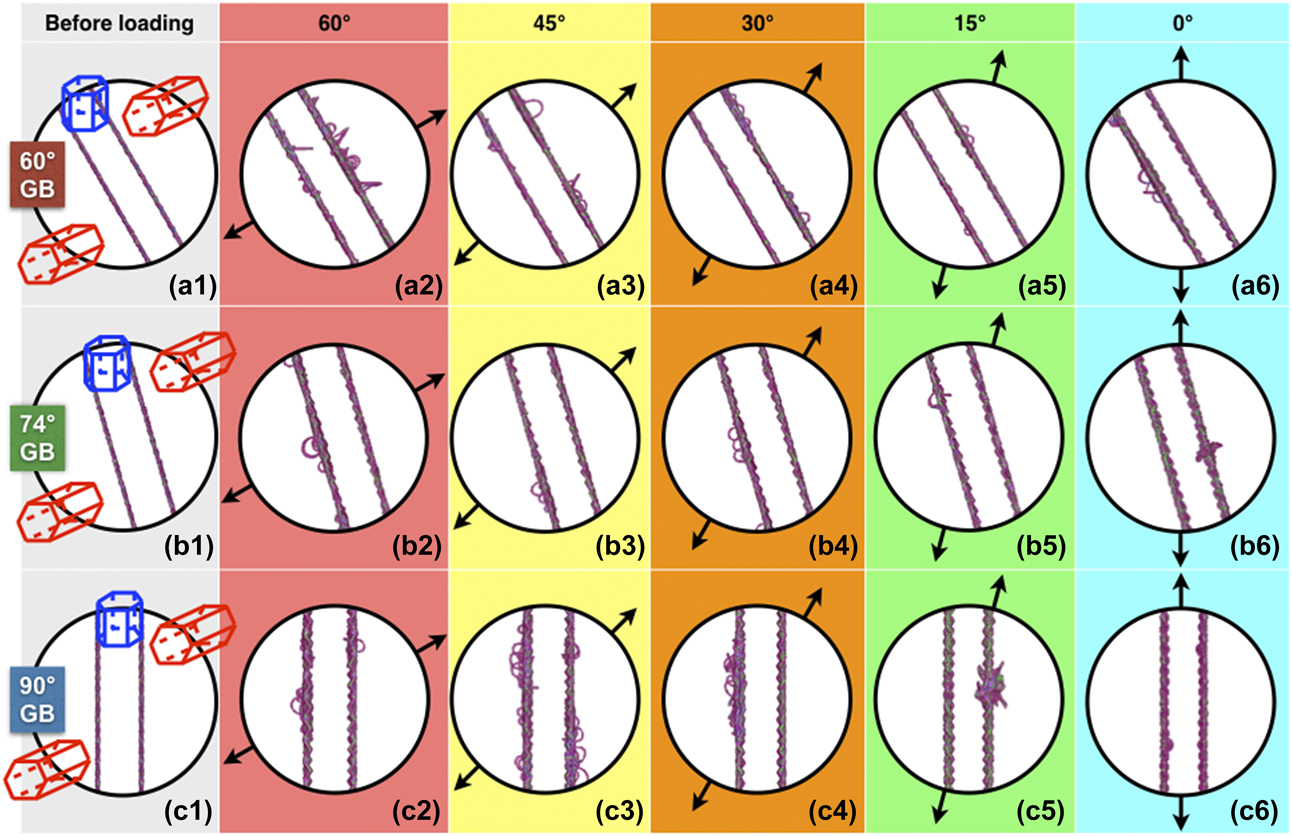
For the 60° GB, when the load reaches a critical value dependent on the angle φ, plastic deformation initiates by direct GB cracking with subsequent  $\left\langle a \right\rangle _{\rm{h}}^{\rm{b}}$,
 $\left\langle a \right\rangle _{\rm{s}}^{\rm{p}}$, and
 $\left\langle a \right\rangle _{\rm{s}}^{\rm{b}}$, from φ = +60° to 0° [Figs. 5(a2)–5(a6)]. For the 74° GB, plastic deformation initiates by direct GB cracking with subsequent
 $\left\langle a \right\rangle _{\rm{s}}^{\rm{b}}$ and
 $\left\langle a \right\rangle _{\rm{h}}^{\rm{b}}$ from φ = +60° to +15° [Figs. 5(b2)–5(b5)] or with subsequent
 $\left\langle {c + a} \right\rangle _{\rm{h}}^{\rm{p}}$ and
 $\left\langle a \right\rangle _{\rm{s}}^{\rm{p}}$ at φ = 0° [Fig. 5(b6)]. For the 90° GB, plastic deformation initiates by direct GB cracking with subsequent
 $\left\langle a \right\rangle _{\rm{s}}^{\rm{b}}$ and
 $\left\langle a \right\rangle _{\rm{h}}^{\rm{b}}$ from φ = +60° to +30° [Figs. 5(c2)–5(c4)] or with subsequent
 $\left\langle {c + a} \right\rangle _{\rm{h}}^{\rm{p}}$ and
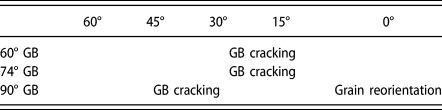
 $\left\langle a \right\rangle _{\rm{s}}^{\rm{p}}$ at φ = +15° [Fig. 5(c5)], and by grain reorientation from the soft grain to the hard at φ = 0° [Fig. 5(c6)]. For comparison, the underlying mechanisms, through which plastic deformation initiates for different GB under various loading directions, are collected in Table I.
Underlying mechanisms, through which plastic deformation initiates in the case of pure GB under tension.

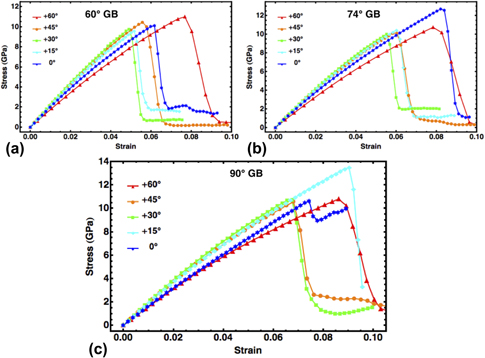
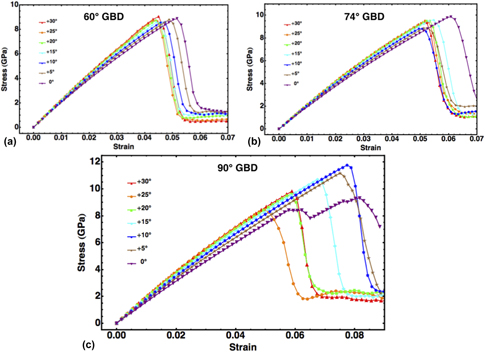
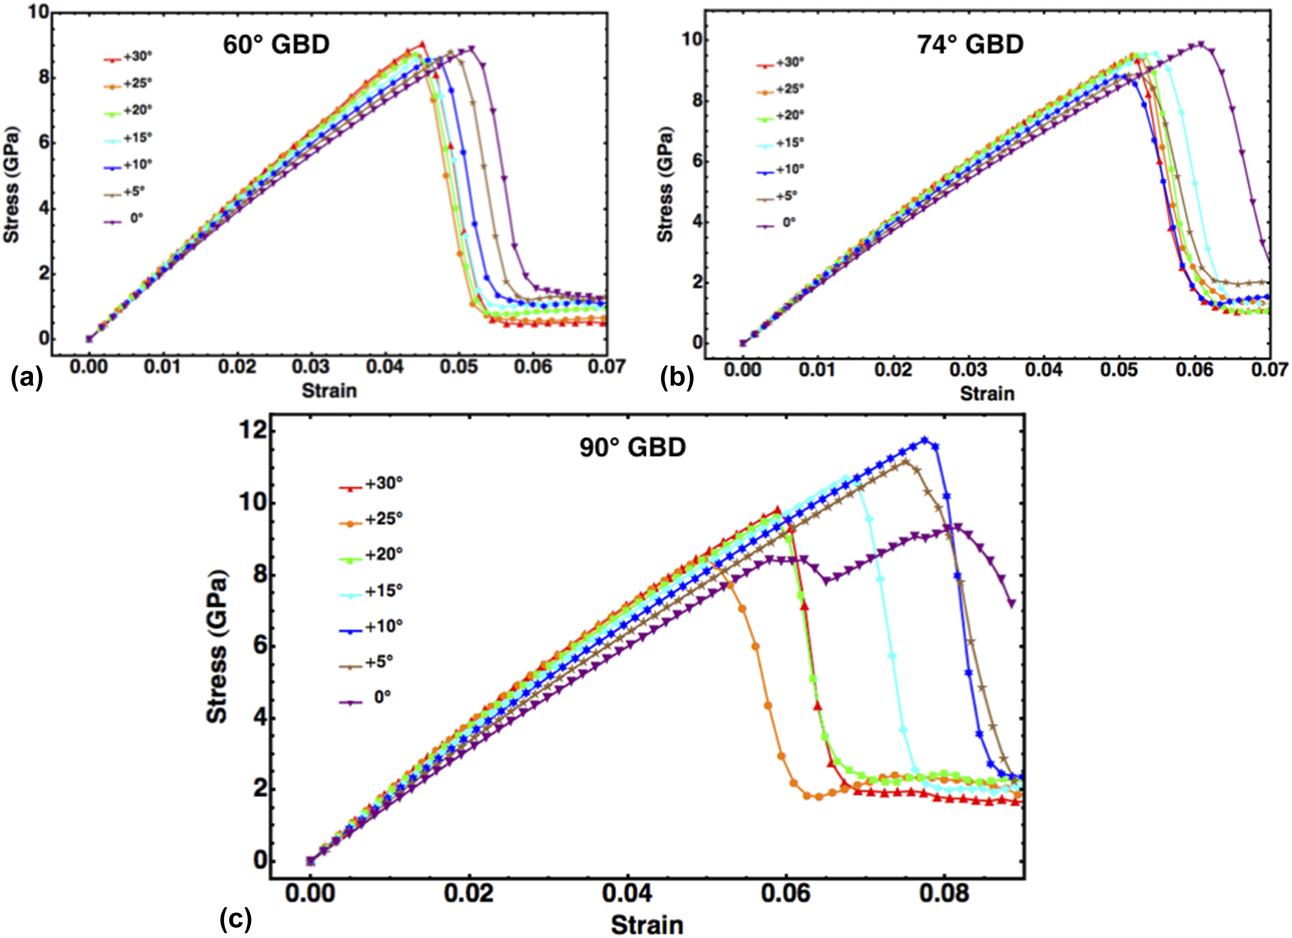
The normal stress–strain curves of the above loading processes are shown in Fig. 6. For the three GB studied, their stress–strain curves are found dependent on the loading direction. For the 60° GB, the highest critical stress and strain are 11.0 GPa and 7.7%, respectively, and the lowest critical stress and strain are 9.5 GPa and 5.0%, respectively; for the 74° GB, those values are 12.6 GPa and 8.2%, 9.9 GPa and 5.5%; and for the 90° GB, 13.5 GPa and 9.0%, 10.5 GPa and 6.7%. Generally, the critical stress and strain increase with the GB angle. For the 60°, 74°, and 90° GB, the ratios of the highest critical stress over the lowest are 1.16, 1.27, and 1.29, respectively.
Normal stress–strain curves of the 60° (a), 74° (b), and 90° (c) GB under tensile loading along various directions.

Plastic behavior with residual dislocations
We then consider GB behavior with residual dislocations. A pair of edge dislocations are introduced to the soft grains by removing atom slices from the corresponding prismatic planes, followed by relaxation at 1 K for 20 ps [see Figs. 7(a1), 7(b1), and 7(c1)]. The system is then tensile loaded under constant temperature of 300 K and a constant strain rate of 108 s−1 at various angles with respect to the c-axis of the hard grain. On tensile loading, due to the resolved shear stress, the prismatic dislocations introduced to the soft grain glide and enter the GB, becoming residual dislocations. Generally, the resulting defects are similar to those characterized in the previous section; however, plastic deformation prefers to initiate at the location or in the vicinity of the residual dislocations on the GB. Hence, the initiation is determined not only by the Schmid factors of various slip systems, but also by the GB structures as modified by the residual dislocations. When loading is about parallel to both the GB plane and the c-axis of the hard grain [Figs. 7(c4)–7(c6)], i.e., less than 15°, slip in neither grain can be activated; thus, grain reorientation operates.
Same as Fig. 5, but with impacting dislocations. Note the changes of underlying plastic processes.

For the 60° GB, plastic deformation initiates by direct GB cracking with subsequent  $\left\langle a \right\rangle _{\rm{s}}^{\rm{p}}$ and
 $\left\langle a \right\rangle _{\rm{s}}^{\rm{b}}$ from φ = +30° to 0° [Figs. 7(a2)–7(a6)]. For the 74° GB, plastic deformation initiates by direct GB cracking with subsequent
 $\left\langle a \right\rangle _{\rm{s}}^{\rm{b}}$ and
 $\left\langle a \right\rangle _{\rm{h}}^{\rm{b}}$ from φ = +30° to +5° [Figs. 7(b2)–7(b5)], and by
 $\left\langle a \right\rangle _{\rm{s}}^{\rm{p}}$ at φ = 0° [Fig. 7(b6)]. For the 90° GB, plastic deformation initiates by direct GB cracking with subsequent
 $\left\langle a \right\rangle _{\rm{s}}^{\rm{p}}$ and
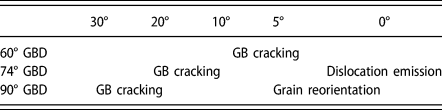
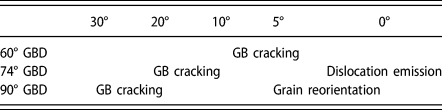
 $\left\langle a \right\rangle _{\rm{h}}^{\rm{b}}$ from φ = +30° to +20° [Figs. 7(c2)–7(c3)], and by grain reorientation from the soft grain to the hard from φ = +10° to 0° [Figs. 7(c4)–7(c6)]. For convenience, the underlying mechanisms, through which plastic deformation initiates, are collected in Table II.
Underlying mechanisms, through which plastic deformation initiates in the case of GB with residual dislocations under tension.
The normal stress–strain curves of the above loading processes are shown in Fig. 8. Similar to the situations without residual dislocations in the previous section, for all the three GB studied, their stress–strain curves are found dependent on the loading direction. For the 60° GB, the highest critical stress and strain are 9.0 GPa and 5.2%, respectively, and the lowest critical stress and strain are 8.5 GPa and 4.3%, respectively; for the 74° GB, those values are 9.5 GPa and 5.6%, 8.8 GPa and 5.0%; and for the 90° GB, 11.8 GPa and 8.1%, 8.4 GPa and 5.0%. Compared with GB without residual dislocations, the critical stress and strain generally decrease with the presence of the residual dislocations. Such weakening of the GB has some similarity to the weakening effect of dislocation cores to the perfect lattice [Reference Gu, Xu, Wang and Yang24]. For the 60°, 74°, and 90° GB, the ratios of the highest critical stress over the lowest are approximately 1.06, 1.08, and 1.40, respectively, relying more on the GB angle than the case without residual dislocations.
Normal stress–strain curves of the 60°, 74°, and 90° GB with residual dislocations under various loading directions.
Orientation dependence of critical stress and strain
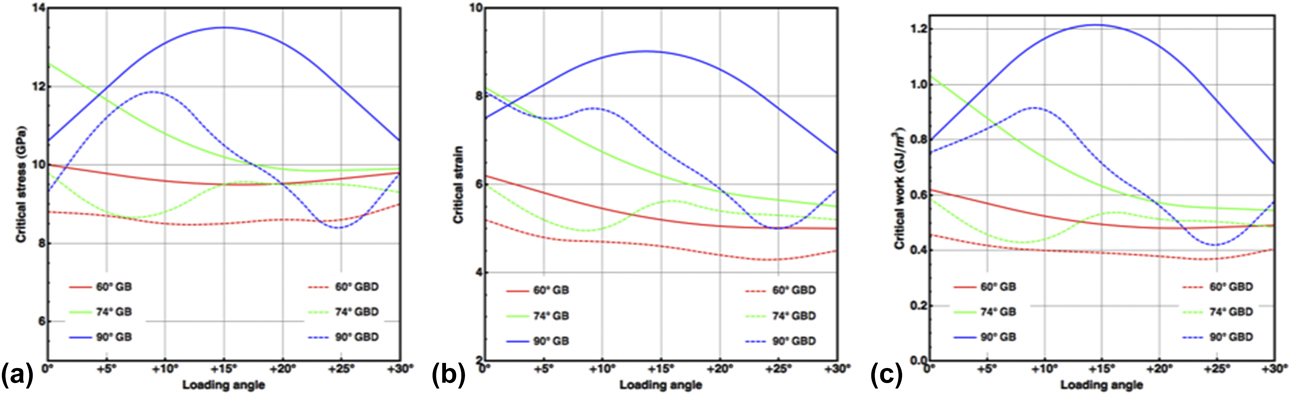
The critical stress and strain for the initiation of plastic deformation depend on the loading direction. For the sake of comparison, the critical stresses corresponding with the plastic behavior initiation in Figs. 5 and 7 are collected and plotted in Fig. 9(a) and the critical strains in Fig. 9(b), where GB and GBD denote the cases of GB without and with residual dislocations, respectively. It is readily seen that the residual dislocations reduce the strength of the GB, as indicated by the smaller critical stress and strain in the case of GBD than GB, and introduce more local minima to the curves. Correspondingly, the critical work density, defined as the product of the critical stress and strain, i.e., w c = σc × εc, is plotted in Fig. 9(c). Both the critical stress and strain of the 90° GB strongly depend on the loading angle.
Critical stress, strain, and work of the 60°, 74°, and 90° GB upon loading along various directions.
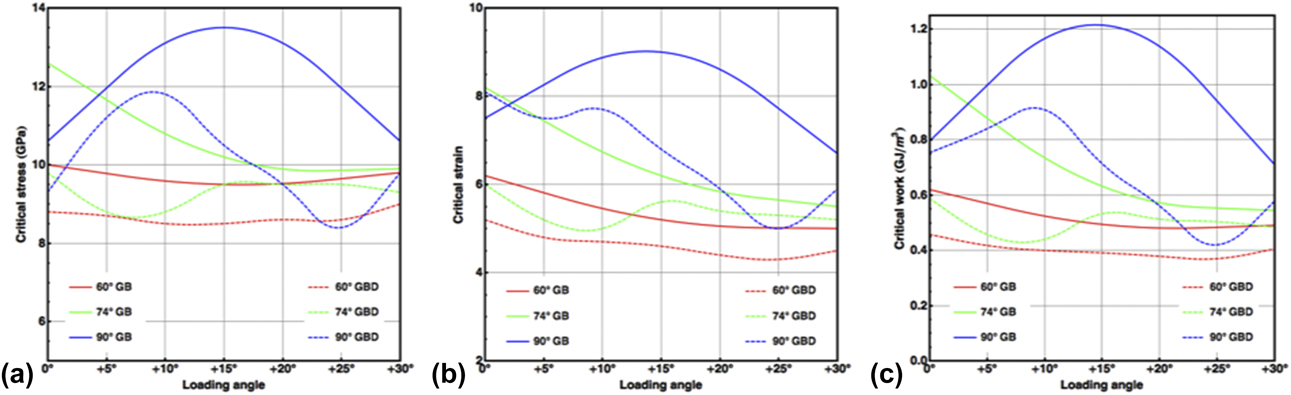
In Fig. 9(c) for the 90° GB with residual dislocations, the maximum critical works correspond to the loading angle of approximately +8°. In this case, the angle between the loading angle and the GB plane is also 8°, coinciding with previous observations in the cold dwell fatigue experiments, where the normal directions of the facet planes are sometimes found about 10° off the loading directions. It is thus possible that, in the microstructure under dwell conditions, the difficulty to initiate plastic deformation under a combination of 90° GB and 0° loading promotes crack initiation.
Atomic processes during plastic deformation initiation
The yielding events are grouped into three categories, direct GB cracking, dislocation emission, and grain reorientation. Here, we present the details of plastic deformation initiation on the GB with residual dislocations using typical atomic configurations during the above tensile deformation. Here, we focus on the primary defects formed during the plastic initiation and leave secondary defects, e.g., 〈a〉- and 〈c + a〉-dislocation nucleation near cracks, to future reports.
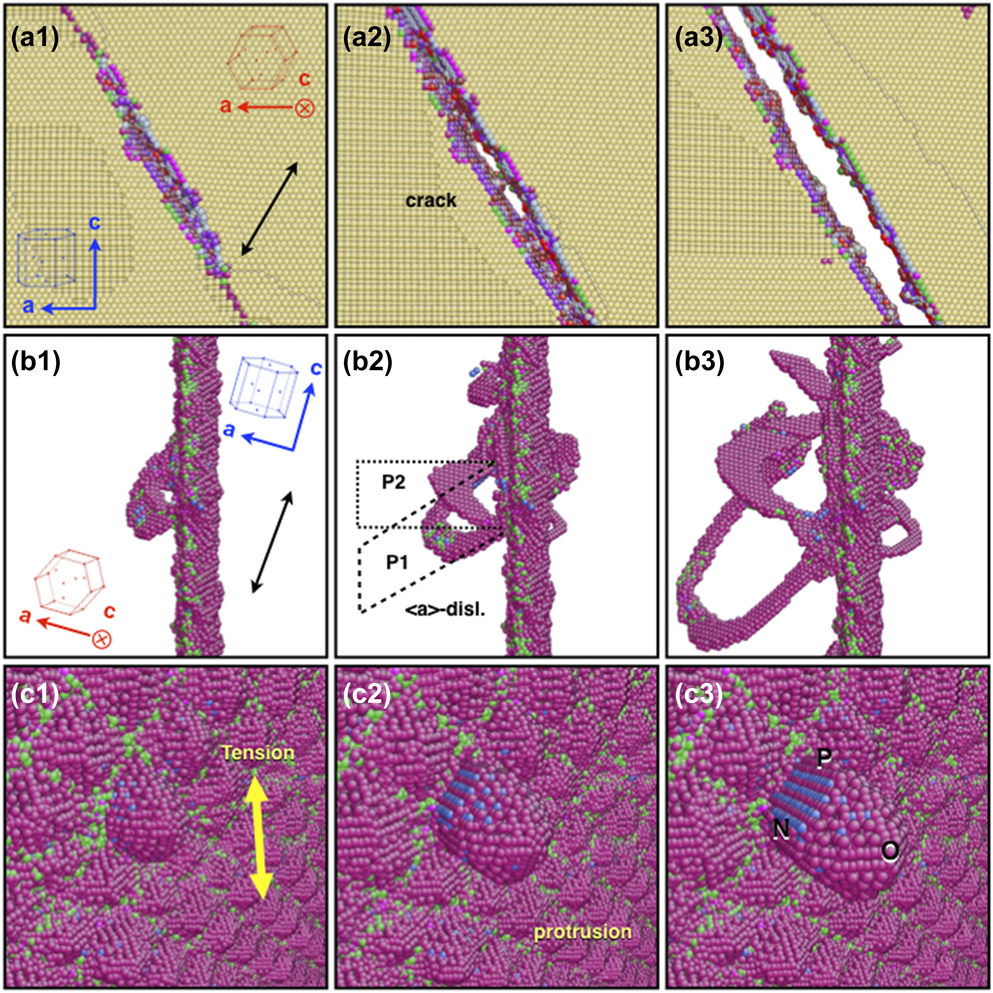
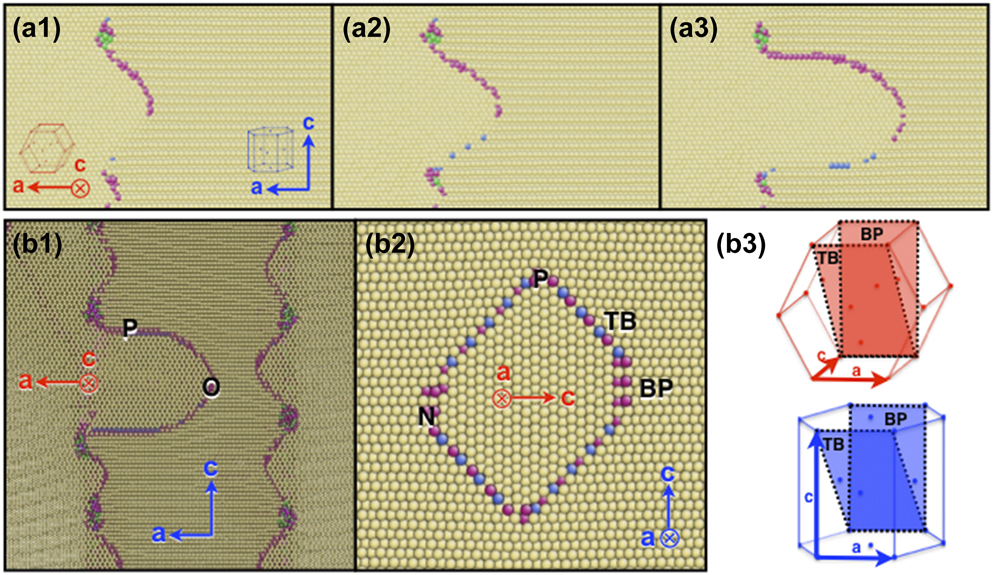
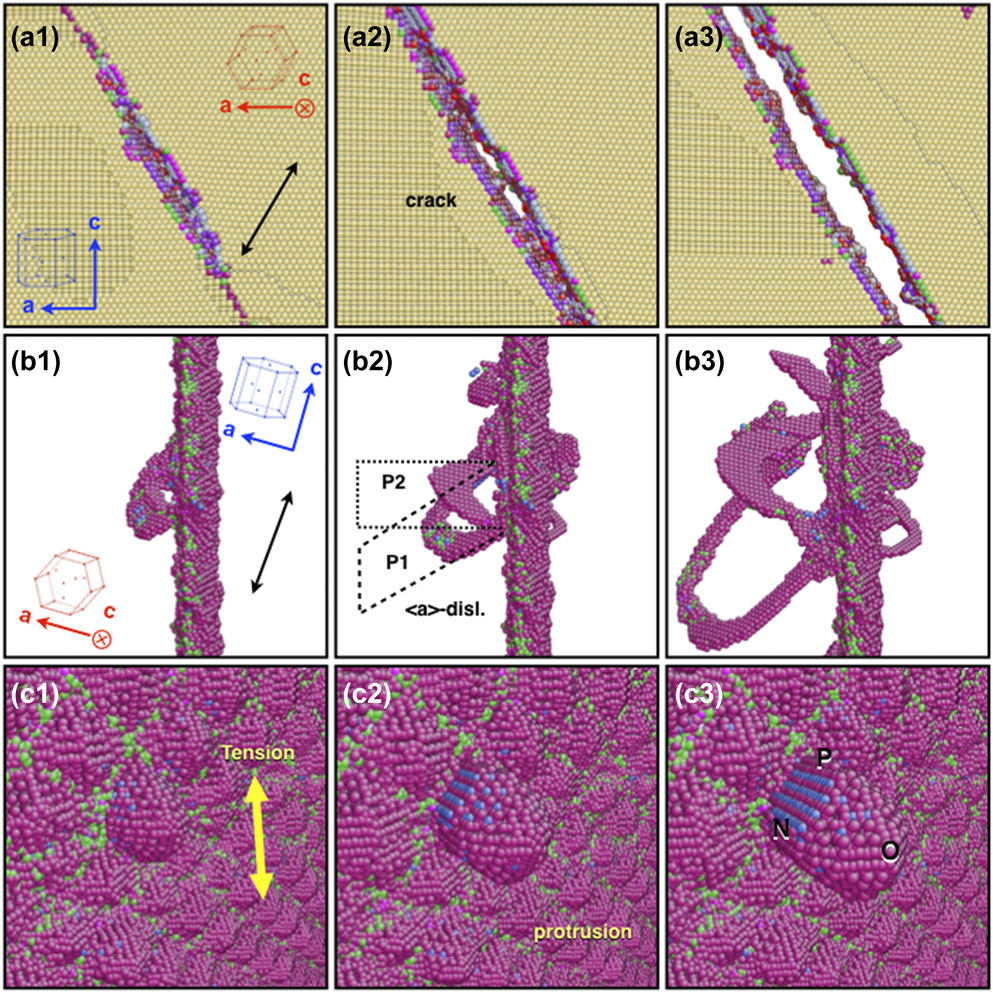
The atomic processes corresponding with Fig. 7 are shown in Fig. 10. When the tensile stress has a relatively large component normal to the GB plane, the boundary splits [Figs. 10(a1)–10(a3)], which is followed by dislocation emission in the vicinity of the microcrack (not shown here). When the tensile direction approaches the GB plane, 〈a〉-dislocation emission becomes the dominant process with the glide planes being either the prismatic planes in the soft grain or the basal planes in the hard grain, depending on the specific tensile direction. In Figs. 10(b1)–10(b3), there is relatively large resolved shear stress on the inclined prismatic plane P1, where the first half dislocation loop nucleates with a Burgers vector of 〈a〉. Subsequently, because of the modification of the local stress state, the second 〈a〉-dislocation loop nucleates on the horizontal prismatic plane P2. When the tensile direction is nearly parallel to the GB plane, still 〈a〉-dislocation emission operates for the 60° GB, whereas for the 74° and 90° GB, grain reorientation becomes the most favored [Figs. 10(c1)–10(c3)]. The boundary between the protruding grain and the original grain is largely twin boundary (TB) with a small portion of basal–prismatic (BP) interface, and thus the two grains have twin relationship. However, by comparing Figs. 10(c2) and 10(c3), it is readily seen that the protrusion grows in parallel with the TB and BP boundaries, which is in variation with conventional deformation twining, as in the latter case the penetrating grain is supposed to grow within the paper plane of Fig. 10(c3).
Atomic processes during plastic deformation initiation. (a1–a3) GB cracking. (b1–b3) 〈a〉-dislocation emission on the prismatic planes in the soft grain. (c1–c3) Grain reorientation from the soft to the hard grain. Atoms are colored according to their coordination number, with normal HCP atoms invisible in (b1–b3) and (c1–c3).
Dynamic recrystallization via grain reorientation
Under loading about parallel to the c-axis of the hard grain, slip in neither grain can be activated, and direct reorientation of the hard grain to the soft grain occurs. From the microstructure point of view, such grain reorientation extends the soft grain in the expense of the hard grain and results in dynamic recrystallization. Compared with dislocation nucleation, although grain reorientation requires larger critical strain and stress, as well as larger critical work per unit volume (see Fig. 9), it nevertheless can be a potential way to accommodate plastic deformation during severe deformation, e.g., shock compression.
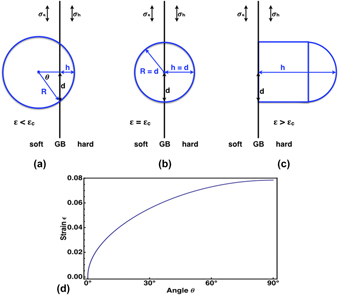
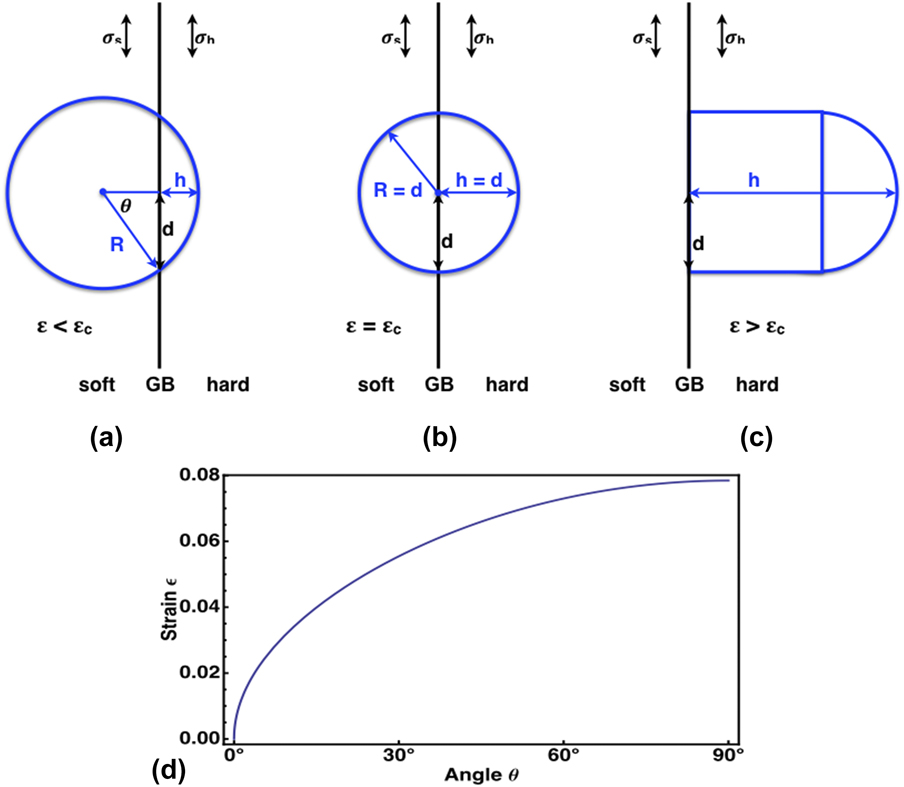
First, it is thus worth discussing its nucleation condition. Upon tension, due to strain compatibility, the elastic energy stored in the hard grain is larger than that in the soft grain, providing the driving force for the reorientation, which competes with the interfacial energy. At a given strain, the nucleus height h is determined by the pressure difference between the two grains and the interfacial tension [Fig. 11(a)]. With fixed nucleus width d, induced by the misfit dislocation network, h increases with the strain until the spherical cap becomes a half sphere [Fig. 11(b)]. If the strain continues to increase, stress balance can no longer be reached with the rod-like nucleus [Fig. 11(c)], and dynamic recrystallization by spontaneous grain reorientation is triggered.
(a–c) Schematic drawing of grain reorientation, at the beginning when ε < εc (a), later stage, ε = εc (b), and at large strain, ε > εc (c). The blue frames in the hard grain side represent the protrusions, with R the radius and h the penetrating depths. d is the half width of the misfit dislocation network. (d) Relation between the external strain ε and the equilibrium penetrating angle θ.
A scenario of such dynamic recrystallization is summarized as follows:
(i) Initially, tensile loading results in a small nucleus on the GB [Fig. 11(a)]. The nucleus has a spherical cap shape with height h and radius R, lying on the misfit dislocation network with half spacing d.
(ii) As the load increases, the stress mismatch increases and the spherical GB moves further into the hard grain. Since d is fixed, h increases, but R decreases, until the spherical cap becomes a half sphere [Fig. 11(b)].
(iii) With further increased load, the spherical shape can no longer be retained and the nucleus becomes rod-like. At this stage, stress balance can no longer be reached, and dynamic recrystallization occurs [Fig. 11(c)].
Second, we discuss in detail the critical condition, considering it as a stress-driven nucleation process. Before any plastic event, the two grain share the same strain, ε, and the stress within the soft and hard grains are thus σs = C sε and σh = C hε, where C s and C h are the corresponding elastic constants along the loading direction, C h > C s. At small strain, assuming a spherical cap shape of the penetrated grain as shown in Fig. 11(a), the geometrical constraint gives
 $$d = R\;\sin \;\theta ,\;h = R\left( {1 - \cos \theta } \right) = d\;\tan {\theta \over 2}\quad ,$$
With grain reorientation, the change in free energy is
 $$\Delta G = \gamma S - {1 \over 2}\left( {{C_{\rm{h}}} - {C_{\rm{s}}}} \right){\varepsilon ^2}V\quad ,$$
where S = 2πRh is the surface area of the spherical cap and V = πh 2(3R − h)/3 its volume. Substitute R and h with θ and the critical condition, dΔG/dθ = 0 gives the equilibrium θ at a given ε. Such relation is complicated and we instead plot the ε–θ curve in Fig. 11(d), using C s = 178 GPa, C h = 191 GPa, d = 2.5 nm and γ = 0.5 J/m2. The critical strain is 0.08 at θ = 90°, in full agreement with the MD results.
Third, the atomic configurations during MD simulation of the reorientation process under 5° loading are shown in Figs. 12(a1)–12(a3). Under tension, a spherical cap-like reorientation nucleus immediately forms on the GB [Fig. 12(a1)] with an equilibrium size determined by the external tensile strain. As the strain increases, its volume enlarges grows into the hard grain and meanwhile thickens perpendicular to the growth direction [Figs. 12(a2) and 12(a3)], converting more atoms from the hard orientation into the soft. Cross-section views are shown in Figs. 12(b1) and 12(b2) along the c-axis of the soft grain and the a-axis, respectively. The non-yellow atoms approximately indicate the GB and the boundary between the hard grain and the penetrating soft grain. Under tensile loading, the boundary bows out toward the hard grain [Fig. 12(b)1], forming protrusion nuclei at the misfit dislocation network on the GB [for the network, see Fig. 2(a)]. The formation of the reoriented grain releases the local stress and strain, therefore hindering the growth of other reorientation nuclei nearby [Fig. 12(b1)]. What surround the penetrating grain are twin boundaries (TBs) and BP boundaries [Figs. 12(b2) and 12(b3)], with relatively low interfacial energies, whereas near the protrusion front [Fig. 12(a3)], the boundary does not correspond with any specific crystallographic plane.
(a1–a3) Cross-section views along the c-axis of the soft grain showing the atomic configurations during grain reorientation under +5° loading. (b1–b2) Cross-section views of a3 along the c-axis and the a-axis of the soft grain, respectively. We use the representative points, N, O, and P, as marked in Fig. 10(a3). The paper plane of b1 is perpendicular to the c-axis of the soft grain and that of b2 is parallel to the GB plane. (b3) Schematics of the TB and BP boundary in b2. Atoms are colored according to their coordination number. Lattice orientations are indicated in a1, b1, and b2, where the red and blue arrows correspond with the soft and hard grains, respectively.

Minimum energy paths and activation energy
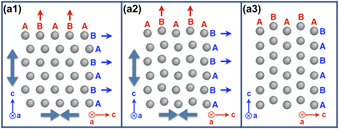
Figure 13 schematizes the coordinated atomic movement during grain reorientation. Lattices in a1 and a3 have the hard (blue axes) and the soft (red axes) orientations, respectively. To transform from a1 to a3, the whole lattice expands along the c-axis of the hard grain and contracts along the c-axis of the soft grain, with horizontal move of atomic rows B (blue) toward the right, and vertical move of atomic column B (red) toward the top. The hard–soft reorientation consumes an overall tensile strain of 8.3% along the hard direction.
(a1–a3) Schematics of the coordinated atomic movement during the reorientation from a hard grain (a1) to a soft grain (a3) under uniaxial tension. Hard and soft orientations are indicated by the blue and red axes, respectively. Lattice expansion and contraction are indicated by large solid arrows in a1 and a2. Atomic movement is shown by small blue and red arrows.
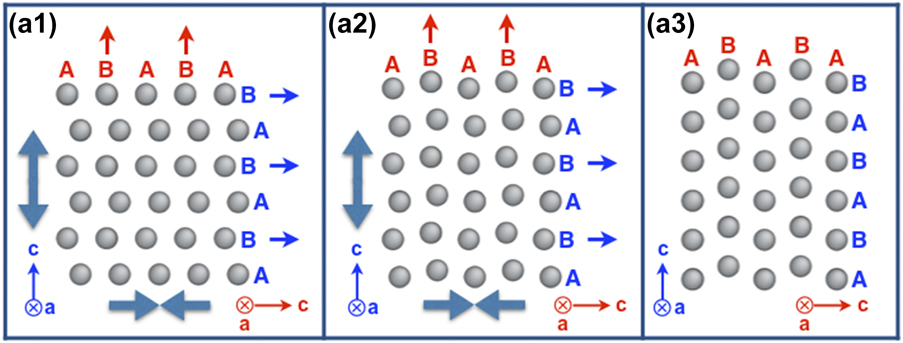
The minimum energy paths of grain reorientation are studied in a series of HCP metals, employing the state-of-the-art nudged elastic band method [Reference Sheppard, Xiao, Chemelewski, Johnson and Henkelman25]. The energy along the path is plotted in Fig. 14. DFT calculations are performed for Be, Ti, Zr, and Mg. In each calculation, a periodic cell with 4 atoms was used within the projected augmented wave method and generalized gradient approximation with a Methfessel–Paxton smearing of 0.2 eV, cutoff energies of 510, 460, 410, and 360 eV, and γ-centered k-point meshes of 25 × 21 × 21, 13 × 11 × 11, 15 × 12 × 12, and 19 × 17 × 17, for Be, Ti, Zr, and Mg, respectively. For comparison and validation, interatomic potential calculations are performed for Ti and Mg in simulation boxes with 4000 atoms, using state-of-the-art potentials [Reference Zope and Mishin16, Reference Liu, Adams, Ercolessi and Moriarty26].
(a) Energy per atom along the minimum energy path of grain reorientation in HCP metals, Be, Ti, Zr, and Mg, by DFT calculations. (b) The same as (a), but for those obtained by interatomic potentials and DFT calculations in Ti and Mg. (c) Minimum energy paths of grain reorientation in Ti at various tensile strains.

The activation energy decreases in the order of Be, Ti, Zr, and Mg [Fig. 14(a)], as the c/a ratio increases (1.579, 1.583, 1.599, and 1.623 predicted by DFT calculations, respectively, compared with experimental results 1.568, 1.588, 1.593, and 1.624). A general agreement is found between interatomic potentials and DFT calculations for Ti and Mg, although the former systematically overestimate the activation energy [Fig. 14(b)]. For Ti, the results are quite close, less than 0.01 eV per atom, and therefore further validating the potential. For Mg, despite the relatively large difference between the results, grain reorientation was confirmed in both MD simulations and experiments [Reference Liu, Wang, Li, Lu, Zhang, Shan, Li, Jia, Sun and Ma27]. For the HCP systems considered in the present study, tensile strain facilitates grain reorientation. In Ti, minimum energy paths of grain reorientation are calculated at various tensile strains [Fig. 14(c)] and vanished activation energy is found at a tensile strain of ∼12.5%.
Comparison and implication
In single crystals under compression, twinning through reorientation has been captured by in situ transmission electron microscopy in Mg [Reference Liu, Wang, Li, Lu, Zhang, Shan, Li, Jia, Sun and Ma27] and by MDs simulations in Ti [Reference Zong, Ding, Lookman, Li, Sun, Cerreta, Escobedo, Addessio and Bronkhorst28]. Nevertheless, the present work enriches the operating conditions with GB-containing samples suggested by industrial applications. Moreover, despite the similar crystallography, grain reorientation is somewhat different from the deformation modes in previous investigations [Reference Liu, Wang, Li, Lu, Zhang, Shan, Li, Jia, Sun and Ma27, Reference Zong, Ding, Lookman, Li, Sun, Cerreta, Escobedo, Addessio and Bronkhorst28, Reference Wang, Yadav, Hirth, Tomé and Beyerlein29] in the sense that, due to the initiation of grain protrusion in the present case, the boundary between the twinned grain and the original grain moves in a direction perpendicular to the loading direction and parallel to the TB. This latter point is also recognized comparing the critical stress in our case ∼10 GPa with that in previous simulations ∼20 GPa [Reference Zong, Ding, Lookman, Li, Sun, Cerreta, Escobedo, Addessio and Bronkhorst28].
Specific to the cold dwell fatigue of α-Ti alloys, the microtexture contains large regions with the hard orientation, where the easy slip systems can hardly be activated. In this sense, although the present result does not provide the source of dwell fatigue, it indicates that lattice reorientation can act as an alternative mechanism to facilitate plastic deformation and, due to the lack of dislocation slip, can be a controlling mechanism therein. Although there is yet no direct observation of deformation by lattice reorientation in Ti, several experiments nevertheless suggest unrevealed deformation mode, which presents very similar behavior to grain reorientation. Flow stress softening was observed with decreased alpha lath/platelet thickness in a series of hot compression tests on Ti–6Al–4V and Ti–6Al–2Sn–4Zr–2Mo–0.1Si [Reference Semiatin and Bieler30], implying a way to compensate grain-size strengthening, and in the Ti–6Al–2Sn–4Zr–6Mo alloy, the refined microstructure is found less dwell sensitive [Reference Qiu, Ma, Lei, Liu, Huang, Rugg and Yang23], implying that new deformation mode is hindering crack initiation and propagation.
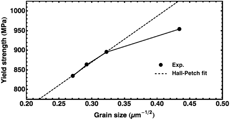
Aiming at understanding the influence of microstructure refinement on dwell fatigue sensitivity, a systematic investigation was carried out on Ti–6Al–2Sn–4Zr–2Mo (Ti6242), Ti–6Al–2Sn–4Zr–3Mo (Ti6243), Ti–6Al–2Sn–4Zr–4Mo (Ti6244), and Ti–6Al–2Sn–4Zr–6Mo (Ti6246). By thermomechanical processing and heat treatments at normalized temperatures, the same type of microstructure is achieved and the average α grain sizes are 13.6 μm, 11.7 μm, 9.6 μm, and 5.3 μm for Ti6242, Ti6243, Ti6244, and Ti6246, respectively. The yield strength with respect to α grain size is shown in Fig. 15, where a significant deviation from the Hall–Petch relationship is found for Ti6246, which has the finest microstructure with the smallest grain size. It is worth noting that the above alloys are near α alloys with a volume fraction of transformed β phase (10%, 15%, 20%, and 40% in Ti6242, Ti6243, Ti6244, and Ti6246, respectively) with a lower yield strength than the α phase, but the existence of the transformed β phase cannot fully explain the perfect Hall–Petch relation for Ti6242–Ti6244 and the sudden large softening at Ti6246. It is therefore postulated that there exists at least one unknown softening mechanism in the microstructure of Ti6246 to compensate the Hall–Petch strengthening. Given the large amount of soft–hard grains in the microstructure of Ti6246 and the grain size efficiently small, it is reasonable to suggest that grain reorientation may function in Ti6246. Grain reorientation weakens the microtexture and, together with the refined microstructure, reduces the dwell sensitivity of Ti6246.
Yield strength with respect to α grain size for Ti6242, Ti6243, Ti6244, and Ti6246 with the same type of microstructure. Black dots are experimental measurements. The dashed line is a Hall–Petch fit of the data of Ti6242, Ti6243, and Ti6244.

Together with the observations in Mo [Reference Wang, Wang, Du, Zhang, Sui and Mao31], the present work also adds to the knowledge on how grain reorientation can be triggered in plastic deformation, revealing a new deformation mode of materials. It is worth emphasizing that because we are focusing on a microscopic region, the critical stress and strain are several times larger than the macroscopic measurements in experiments, while as indicated in Mo [Reference Wang, Wang, Du, Zhang, Sui and Mao31], agreement will be reached when both simulation and experimental measurement are also performed on the same microscopic region.
Conclusion
Employing MD simulations, we systematically investigated the response of the soft/hard grain model with different GB angles, with and without residual dislocations on the GB, against tensile loading along various directions. Under the unique combination, where the GB normal is perpendicular to the c axes of the soft and hard grains and the loading direction is close to the c-axis of the hard grain, the crystal is the most difficult to deform, and plastic deformation initiates through twin nucleation from the soft into the hard grain. Detailed conclusions are drawn as follows.
(1) Depending on the GB orientation and the tensile direction, plastic deformation initiates through direct GB cracking, dislocation emission, or grain reorientation.
(2) The critical stress and strain to initiate plastic deformation are sensitive to the tensile direction. In particular for the 90° GB, the ratio of the highest critical stress to the lowest is approximately 1.40. Compared with GB without residual dislocations, the critical stress and strain generally decrease with the presence of residual dislocations.
(3) A new twin nucleation mode is identified, which results in grain reorientation from the soft to the hard grain. During the reorientation, the lattice expands along the c-axis of the soft grain and contracts along the c-axis of the hard grain, with atomic shuffles. This mode provides a local normal strain of 8.3%. The activation energy of the lattice reorientation decreases with tensile strain, with a tension-free value of 0.04 eV/atom.
In general, twin nucleation by lattice reorientation in α-Ti affords to be a possible plastic deformation mode for hard-oriented grains under moderate conditions, for example, in cold dwell fatigue.
Acknowledgments
This work is supported by the National Key Research and Development Program of China (2016YFB0701304), the Natural Science Foundation of China (51671195), and the Chinese Academy of Sciences (QYZDJ-SSW-JSC031-01 and XXH13506-304). Simulations were performed in the CAS-Shenyang Supercomputing Center. HW acknowledges the financial support of the Youth Innovation Promotion Association, CAS (2015151).