Pseudomonas aeruginosa (PSA) is an important pathogen that accounts for ~10% of healthcare-acquired infections.Reference Gaynes and Edwards 1 It has multiple intrinsic and acquired resistance mechanisms that may confer resistance to all available antibiotic therapies.Reference Livermore 2 Infection with antibiotic-resistant PSA results in higher mortality, longer length of hospital stay, and higher healthcare costs.Reference Aloush, Navon-Venezia, Seigman-Igra, Cabili and Carmeli 3 – Reference Carmeli, Troillet, Karchmer and Samore 5 Rates of resistance to fluoroquinolones (FQs) in PSA are significant, with reported rates of ≤35%. 6 The mechanism of action of FQs involves binding to and inhibiting the activity of the type II topoisomerases, specifically DNA gyrase and topoisomerase IV. A major mechanism of FQ resistance is modification of target proteins in DNA gyrase and topoisomerase IV, most commonly in the gyrA and parC subunits, respectively.Reference Jalal and Wretlind 7 , Reference Lee, Lee, Park and Kim 8 It has been shown that, while a small number of mutations may not result in phenotypic resistance, the addition of subsequent mutations will eventually give rise to full resistance to FQs.Reference Qiang, Qin, Fu, Cheng, Li and Yi 9 , Reference Bagel, Hullen, Wiedemann and Heisig 10
Risk factors for phenotypic resistance to FQs in PSA have previously been studied, comparing patients with FQ-resistant PSA to those with FQ-susceptible PSA.Reference Gasink, Fishman, Weiner, Nachamkin, Bilker and Lautenbach 11 – Reference Khayr, Rheault, Waiters and Walters 15 Prior FQ use has been identified as a risk factor in these studies. However, risk factors for specific FQ resistance mechanisms in PSA may differ from those for phenotypic resistance and have not yet been studied. Identification of the risk factors associated with the presence of specific FQ resistance mechanisms will lead to an improved understanding of the early steps in the development of resistance in PSA and of the modifiable variables at which interventions can be targeted to prevent the emergence of resistance. Therefore, the objective of this study was to identify risk factors associated with gyrA and parC mutations in PSA with a focus on prior antibiotic exposure.
METHODS
Study Design and Study Participants
This study was conducted at 2 academic adult acute-care hospitals within the University of Pennsylvania Health System, the Hospital of the University of Pennsylvania (HUP), a 782-bed quaternary care center, and Penn Presbyterian Medical Center (PPMC), a 331-bed urban community hospital, from May 23, 2008, through November 10, 2009. To identify the risk factors associated with gyrA and parC mutations, we conducted a case-case-control study, in which 2 parallel case-control studies were conducted using the same control group.Reference Kaye, Harris, Samore and Carmeli 16
Eligible patients were identified through the HUP Clinical Microbiology Laboratory, which processes and cultures all samples from both hospitals. Patients hospitalized at HUP or PPMC with a first clinical PSA isolate on hospital day 3 or later during the study period were eligible for inclusion in the study. Day 3 was chosen to optimize capture of nosocomially acquired PSA. All eligible patients were included and each study participant was included only once. The presence of mutations in gyrA and parC was then determined using PCR amplification and sequencing. The cases for the first case-control study (case 1) were defined as those patients with a PSA clinical isolate in which any mutation in gyrA or parC was identified. These patients were compared to a 10% random sample of all patients hospitalized during the same period for at least 3 days without PSA isolated in a clinical culture. The cases for the second case-control study (case 2) were defined as those patients with a PSA clinical isolate in which no mutations in gyrA or parC were identified. These study participants were compared to the same control group.
This study was approved by the Institutional Review Board of the University of Pennsylvania. A waiver of informed consent was obtained.
Data Collection
Data on the primary exposure of interest and potential confounding variables were ascertained through The Pennsylvania Integrated Clinical and Research Database, which includes demographic, pharmacy, laboratory and billing information and has been used successfully in prior studies of antibiotic resistance.Reference Gasink, Fishman, Weiner, Nachamkin, Bilker and Lautenbach 11 , Reference Lautenbach, Weiner, Nachamkin, Bilker, Sheridan and Fishman 17
The primary exposure of interest was antibiotic use (with a focus on FQ use) during the current admission. Antibiotics were grouped in the following categories: FQs (ie, ciprofloxacin, levofloxacin, moxifloxacin), aminoglycosides (ie, gentamicin, tobramycin, amikacin), antipseudomonal cephalosporins (ie, cefepime and ceftazidime), other cephalosporins (eg, ceftriaxone, cefuroxime, cefazolin), antipseudomonal penicillins (ie, piperacillin with or without tazobactam), other penicillins (eg, oxacillin, amoxicillin, ampicillin), carbapenems (ie, imipenem-cilastatin and meropenem), sulfonamides (ie, trimethoprim-sulfamethoxazole, also known as co-trimoxazole), tetracyclines (doxycycline), macrolides (ie, azithromycin, clarithromycin), monobactams (aztreonam), vancomycin, primary anti-anaerobic agents (ie, metronidazole and clindamycin), and other extended spectrum Gram-positive agents (ie, linezolid, daptomycin, quinopristin-dalfopristin). Antibiotic exposure was calculated as antibiotic days (ie, days count separately for each antimicrobial category). Data on potential confounders were ascertained on the day of admission. The following data elements were collected on all study participants: age, gender, race/ethnicity, comorbidities (using the Elixhauser Comorbidity indexReference Elixhauser, Steiner, Harris and Coffey 18 ), illness severity and risk of mortality (using the All-Patient Refined Diagnosis Related Groups subclass scoresReference Baram, Daroowalla and Garcia 19 – Reference Averill, Goldfield, Steinbeck, Grant, Muldoon, Brough and Gay 21 ), and time at risk. Time at risk was defined as the number of days from admission to a clinical culture positive for PSA in the case groups and the number of days from admission to discharge in the control group.
Laboratory Testing
Antimicrobial susceptibility testing of PSA was performed using the Vitek2 system (bioMerieux Inc., Durham, NC) and interpreted using Clinical Laboratory Standards Institute breakpoints. 22 gyrA and parC genes were amplified by PCR using primers described by Gorgani et al.Reference Gorgani, Ahlbrand, Patterson and Pourmand 23 PCR products were cleaned and submitted to the University of Pennsylvania DNA Sequencing Facility for Sanger sequencing. 24 DNA sequences were then analyzed using Lasergene software (DNASTAR, Madison, WI).
Data Analysis
Analyses were conducted separately for each case-control study. The results of the final models were then qualitatively compared.
For each study, bivariable analyses were conducted to evaluate the association between exposure and potential confounding variables and the outcomes (ie, isolation of PSA with gyrA or parC mutations [case 1] or isolation of PSA without gyrA or parC mutations [case 2]). The t test or Wilcoxon rank sum test was used for continuous variables, and the χ2 or Fisher exact test was used for categorical variables, as appropriate.
Adjusted odds ratios (ORs) were calculated using multivariate logistic regression. The first multivariate model identified independent risk factors for isolation of PSA with gyrA or parC mutations; the second multivariate model identified independent risk factors for isolation of PSA without gyrA or parC mutations. Days of FQ use, time at risk, and illness severity score were included in the final models. Other antibiotic and non-antibiotic independent variables with a P<.20 in bivariate analyses were initially included in the models,Reference Sun, Shook and Kay 25 and were maintained in the final models if they remained significantly associated with the outcome using backward selection.Reference Mickey and Greenland 26
For all calculations, a 2-tailed P<.05 was considered significant. All statistical calculations were performed using commercially available software (SAS 9.3, SAS Institute Inc., Cary, North Carolina, USA).
RESULTS
A total of 398 PSA isolates were identified during the study period; of these, 37 (9.3%) showed phenotypic resistance to levofloxacin (used as a marker of FQ resistance) and 361 (90.7%) did not. Of the 398 isolates, we were able to completely sequence the 3 mutations for parC and 6 mutations in the gyrA subunit in 298 (79.4%). A total of 298 isolates comprised the study cohort. A total of 45,644 patients met eligibility criteria to be included in the control group; a sample of 4,564 patients (10%) was randomly selected as the controls for the 2 case groups.
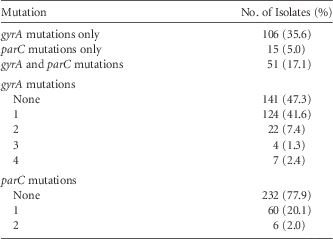
Table 1 shows the number and type of mutations identified in the isolates. A total of 172 (57.7%) isolates had at least 1 mutation in gyrA or parC whereas 126 (42.3%) had no mutations. In regard to mutations in specific subunits, 106 (35.6%) had mutations in gyrA only, 15 (5.0%) had mutations in parC only, and 51 (17.1%) had mutations in both gyrA and parC subunits. Of isolates with at least 1 mutation, 34 (19.8%) showed phenotypic resistance to FQs, while only 2 (1.6%) of those without mutations were resistant to FQs.
gyrA and parC Mutations in P. aeruginosa Isolates

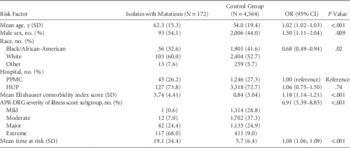
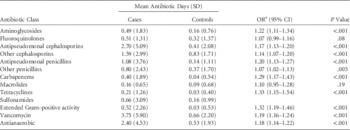
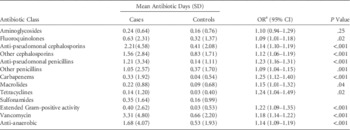
The first case-control study examined risk factors for isolation of PSA with at least 1 mutation in gyrA or parC (case 1). Results of bivariate analysis for this study are shown in Table 2 and Table 3. Compared to controls without PSA, study participants with PSA with at least 1 mutation had significantly higher comorbidity scores (OR, 1.18; 95% CI, 1.14–1.21; P<.001), higher illness severity scores (OR, 6.91; 95% CI, 5.39–8.85; P<.001), and longer time at risk (OR, 1.08; 95% CI, 1.06–1.09; P<.001) than controls. As shown in Table 3, most antibiotic classes (given as odds of exposure per day) were significantly associated with isolation of PSA with at least 1 gyrA or parC mutation on bivariate analysis.
Unadjusted Association Between Baseline Characteristics and Isolation of P. aeruginosa Isolates with Any gyrA or parC Mutations

NOTE. OR, odds ratio; CI: 95% confidence interval; SD, standard deviation; HUP, Hospital of the University of Pennsylvania; PPMC, Penn Presbyterian Medical Center; APR-DRG, All Patient Refined Diagnosis Related Groups.
Unadjusted Association Between Antibiotic Exposure and Isolation of P. aeruginosa with Any gyrA or parC Mutations

NOTE. SD, standard deviation; OR, Odds ratio; CI, confidence interval.
a OR represents the odds of exposure per day.
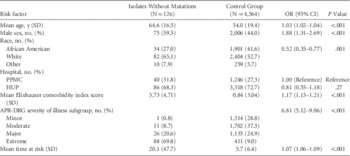
The second case-control study examined risk factors for isolation of PSA without mutations in gyrA or parC (case 2). The results of the bivariate analysis for this study are shown in Table 4 and Table 5. Higher comorbidity scores (OR, 1.17; 95% CI, 1.13–1.21; P<.001) and illness severity scores (OR, 6.81; 95% CI, 5.12–9.06; P<.001) were also associated with isolation of PSA without mutations. Most antibiotic classes were significantly associated with isolation of PSA without mutations, given as odds of exposure per day (Table 5).
Unadjusted Association Between Baseline Characteristics and ISolation of P. aeruginosa Isolates Without gyrA or parC Mutations

NOTE. OR, odds ratio; CI, confidence interval; SD, standard deviation; HUP, Hospital of the University of Pennsylvania; PPMC, Penn Presbyterian Medical Center; APR-DRG, All Patient Refined Diagnosis Related Groups.
Unadjusted Association Between Antibiotic Exposure and Isolation of P. aeruginosa Without gyrA or parC Mutations

NOTE. SD, standard deviation; OR, odds ratio; CI, confidence interval.
a OR represents the odds of exposure per day.
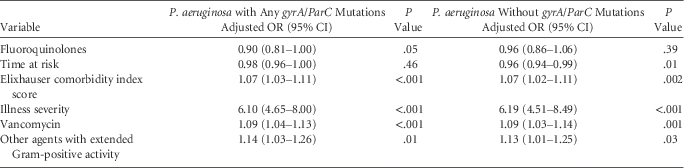
Table 6 shows the results of the multivariate analyses. After adjusting for time at risk, comorbidities, and illness severity, exposure to vancomycin (adjusted OR, 1.09; 95% CI, 1.04–1.13; P<.001) and to other extended Gram-positive agents (OR, 1.14; 95% CI, 1.03–1.26; P=.01) were associated with isolation of PSA with any gyrA or parC mutations. Similar findings were demonstrated for isolation of PSA without gyrA or parC mutations (vancomycin OR, 1.09; 95% CI 1.03–1.14; P=.001; agents with extended Gram-positive activity OR, 1.13; 95% CI, 1.01–1.25; P=.03). FQ use was not associated with isolation of PSA with or without mutations (OR, 0.90; 95% CI, 0.81–1.00; P=.05 and OR, 0.96; 95% CI, 0.86–1.06; P=.39, respectively).
Comparison of Multivariable Models of Risk Factors for Isolation of P. aeuruginosa with gyrA and parC Mutations Versus Isolation of P. aeuruginosa Without gyrA and parC MutationsFootnote a

NOTE. OR, odds ratio; CI, confidence interval.
a Both case groups were independently compared to control group without isolate.
DISCUSSION
This is the first study, to our knowledge, to identify risk factors for specific resistance mechanisms in PSA. We found that exposure to vancomycin is a risk factor for isolation of PSA both with and without gyrA and parC mutations. Similarly, exposure to agents with extended Gram-positive activity was found to be associated with PSA with mutations both with and without gyrA and parC mutations. Interestingly, FQ exposure does not appear to be associated with isolation of PSA with gyrA and parC mutations nor with isolation of PSA without these mutations. Exposures to other antimicrobials were not associated with isolation of PSA.
More than half (172, 57.7%) of the isolates had at least 1 mutation in gyrA or parC. However, only 34 of these isolates (19.8%) showed phenotypic resistance. The accumulation of stepwise mutations in the type II topoisomerases has been shown to increase minimum inhibitory concentration (MIC) to FQs in EnterobacteriaceaeReference Qiang, Qin, Fu, Cheng, Li and Yi 9 , Reference Bagel, Hullen, Wiedemann and Heisig 10 and is likely true for PSA, which would explain this finding. Further studies are needed to confirm the association between number and type of mutations that are associated with increasing FQ MIC and subsequent development of phenotypic FQ resistance in PSA.
Exposure to vancomycin and agents with extended Gram-positive activity (ie, daptomycin, linezolid, quinopristin-dalfopristin) is associated with isolation of PSA with or without mutations. This has also been demonstrated in previous case-case-control studies conducted by Harris et alReference Harris, Perencevich, Roghmann, Morris, Kaye and Johnson 27 examining risk factors for phenotypic resistant PSA. Exposure to vancomycin during hospitalization was identified as a risk factor for isolation of piperacillintazobactam-resistant PSAReference Harris, Perencevich, Roghmann, Morris, Kaye and Johnson 27 and imipenem-resistant PSA.Reference Harris, Smith, Johnson, Bradham and Roghmann 28 The likely explanation is that exposure to agents with extended Gram-positive activity then selects for the isolation of Gram-negative organisms, such as PSA. Patients with higher severity of illness are more likely to receive these antibiotic classes. However, the associations between vancomycin and other Gram-positive agents and isolation of PSA remained after adjusting for illness severity and comorbidities, suggesting that the associations are independent from severity of illness.
Receipt of FQs during hospitalization has been identified as a risk factor for phenotypic FQ resistance in prior studies.Reference Gasink, Fishman, Weiner, Nachamkin, Bilker and Lautenbach 11 – Reference Khayr, Rheault, Waiters and Walters 15 However, use of the patients with antibiotic-sensitive isolates as the control group in a case-control design may overinflate the risks associated with antibiotic exposure in the case patients,Reference Kaye, Harris, Samore and Carmeli 16 so this association may not be seen if a case-case-control study design is employed. This study did not identify FQ exposure as a risk factor for isolation of PSA with gyrA or parC mutations, which could be related to use of the case-case-control study design. Perhaps longer duration of exposure or repeated exposure is required to develop initial mutations compared to the threshold mutation that confers phenotypic resistance. The effect of FQ exposure and timing on gyrA and parC mutation development in PSA needs to be further elucidated.
This study has several limitations. This study did not distinguish between true infection and colonization as all clinical isolates were included. Additionally, some patients with colonization may not have been captured if the colonizing site was not cultured, thereby including cases in the control group. However, given the large sample of controls, we expect this to be a small minority of patients, particularly given that PSA is a rare infecting and colonizing organism. Furthermore, the purpose of this study was to understand the risk factors for the development of a specific resistance mechanism rather than those specific to infection or colonization with a resistant organism, so we believe the study population was appropriate to answer this study question. Furthermore, misclassification of antibiotic exposure may have occurred, specifically to FQs. For example, patients with an increased number of mutations may have been exposed to FQs in prior hospitalizations, which may have deterred clinicians from using FQs during the current hospitalization given the tendency of PSA to quickly develop resistance to antibiotic agents. However, restricting our investigation to only the first PSA isolate for each patient minimized the likelihood that this was a recurrent isolate. Limiting antibiotic use to current hospitalization may not have provided a sufficient period of antibiotic exposure to see an effect, and outpatient antibiotic exposure was not collected and may have had an impact on development of mutations, but previous studies have linked phenotypic FQ resistance with antibiotics used during hospitalization. Several other factors are associated with PSA and could have been confounding variables, such as mechanical ventilation, admission to intensive care units, presence of indwelling catheters. However, adjusting for comorbidities and severity of illness should limit potential confounding by these factors, as there is likely a high level of collinearity between these variables. Patterns of antimicrobial resistance vary across regions, so the findings of this study are generalizable to healthcare settings with similar resistance rates and patterns. Finally, a limitation of the case-case-control study design is lack of quantification of differences between models. Advanced statistical methods should be developed to better compare these models.
In conclusion, the results of this study show that exposure to vancomycin and agents with extended Gram-positive activity are risk factors for isolation of PSA. No risk factors were identified that were specific to isolation of PSA with any gyrA or parC mutations. This may indicate that it is difficult to target interventions toward specific antibiotics to curb the development of FQ resistance in PSA in inpatients. Other mechanisms of resistance (eg, multi-drug efflux pumps) may play a bigger role in acute development of phenotypic FQ resistance and should be studied. Additionally, the role of patient-to-patient spread of resistant organisms may be a large driver of isolation of resistant PSA among inpatients. Further studies are needed to define the association between the number of gyrA and parC mutations that subsequently confer phenotypic FQ resistance. In addition, future studies should be conducted to identify risk factors for other mechanisms of FQ resistance alone and together with gyrA and parC mutations.
Acknowledgments
Financial support: This work was supported by a grant from the National Institute of Allergy and Infectious Diseases (grant no. R21AI075303 to DRL). This work was also supported by the National Institutes of Health (grant no. K24-AI080942 to EL) and by the Centers for Disease Control and Prevention Epicenters Program (grant no. U54-CK000163 to EL).
Potential conflicts of interest: All authors have no conflicts of interest to report.